Pay vs Performance Disclosure - USD ($)
Dec. 31, 2025
Dec. 31, 2024
Dec. 31, 2023
Dec. 31, 2022
Dec. 31, 2021
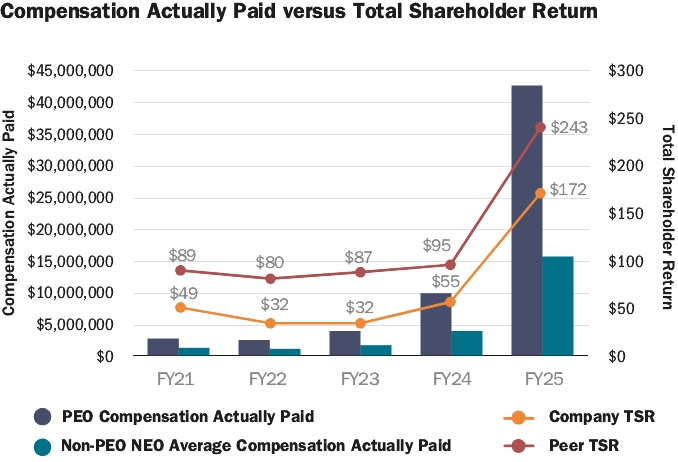
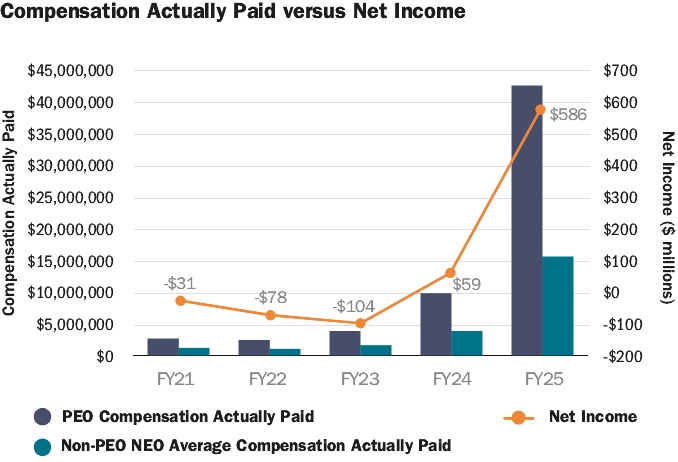
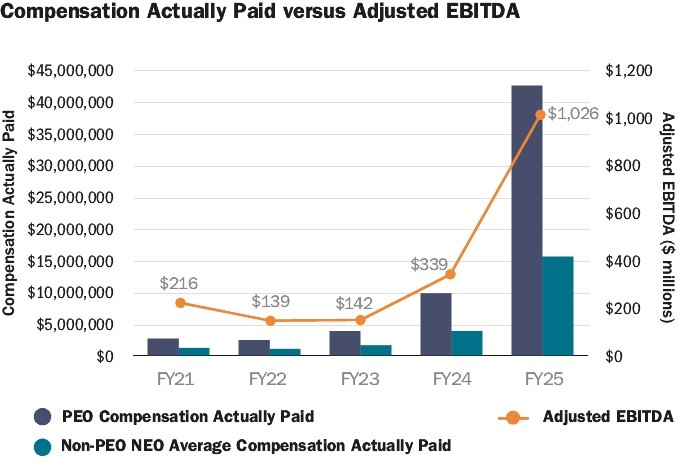
The following table sets forth additional compensation information of our CEO (sometimes referred to as “PEO” for purposes of this section) and our other NEOs along with TSR, net income, and adjusted EBITDA performance results for our fiscal years ended 2025, 2024, 2023, 2022 and 2021. The calculations and analysis below do not necessarily reflect the Company’s approach to aligning executive compensation with performance. For information concerning the Company’s compensation philosophy and how the Company aligns executive compensation with Company performance, refer to the CD&A beginning on page 51.
Year (a) | Summary Compensation Table Total for PEO1 (b) | Compensation Actually Paid to PEO2 (c) | Average Summary Compensation Table Total for non-PEO NEOs3 (d) | Average Compensation Actually Paid to non-PEO NEOs2,3 (e) | Value of Initial Fixed $100 Investment Based On: | Net Income (h) | Adjusted EBITDA (Company Selected Measure)5 (i) | |||||||||||||||||||
Total Stockholder Return4 (f) | Peer Group Total Stockholder Return4 (g) | |||||||||||||||||||||||||
2025 | $6,646,601 | $42,801,553 | $2,538,285 | $15,683,503 | $172 | $243 | $585,872,000 | $1,025,772,000 | ||||||||||||||||||
2024 | $4,387,806 | $9,841,535 | $1,837,740 | $3,866,999 | $55 | $95 | $58,900,000 | $339,152,000 | ||||||||||||||||||
2023 | $4,108,972 | $3,852,029 | $1,722,556 | $1,595,045 | $31 | $87 | ($103,612,000) | $142,302,000 | ||||||||||||||||||
2022 | $3,905,654 | $2,406,554 | $1,558,682 | $1,028,030 | $32 | $80 | ($78,107,000) | $138,954,000 | ||||||||||||||||||
2021 | $3,703,859 | $2,672,360 | $1,479,751 | $1,177,195 | $49 | $89 | ($31,322,000) | $216,112,000 | ||||||||||||||||||
1 | In all the years in question, Mitchell J. Krebs was our Chief Executive Officer. |
2 | The following tables set forth the adjustments made during 2025 represented in the PVP table to arrive at CAP to our PEO and average CAP to our other NEOs. The equity award adjustments to arrive at “Compensation Actually Paid” or “CAP” were calculated consistent with FASB ASC 718, and the valuation assumptions used to calculate fair values did not materially differ from those disclosed at the time of grant. For information on our adjustments made during 2021-2024, refer to our 2025 Proxy Statement. |
PEO | Average Non-PEO | |||||||
Total Reported in 2025 Summary Compensation Table (SCT) | $6,646,601 | $2,538,285 | ||||||
Less, value of Stock Awards reported in SCT | $4,223,336 | $1,464,327 | ||||||
Plus, Year-End Fair Value of Awards Granted in the Fiscal Year that are Unvested and Outstanding | $11,201,346 | $3,883,764 | ||||||
Plus, Change in Fair Value of Prior Year Awards that are Outstanding and Unvested | $28,497,925 | $10,600,550 | ||||||
Plus, FMV of Awards Granted this Year and that Vested this Year | — | — | ||||||
Plus, Change in Fair Value (from prior year-end to vesting date) of Prior Year Awards that Vested during the Fiscal Year | $679,017 | $125,232 | ||||||
Less, Prior Year Fair Value of Prior Year Awards that Failed to Vest this Year | — | — | ||||||
Total Adjustments | $36,154,953 | $13,145,218 | ||||||
Compensation Actually Paid for 2025 | $42,801,553 | $15,683,503 | ||||||
3 | During 2025, our non-PEO NEOs consisted of Thomas S. Whelan, Michael Routledge, Casey M. Nault and Aoife McGrath. During each of 2024, 2023 and 2022, our non-PEO NEOs consisted of Thomas S. Whelan, Michael Routledge, Casey M. Nault and Emilie C. Schouten. During 2021, our non-PEO NEOs consisted of Thomas S. Whelan, Michael Routledge, Casey M. Nault, Terrence F. Smith, and Hans J. Rasmussen. Mr. Smith departed the Company effective August 27, 2021, and Mr. Rasmussen retired from his position as Senior Vice President, Exploration, effective March 31, 2022. |
4 | Company and peer group TSR reflects the Company’s “TSR peer group” as reflected in our 2025 Annual Report on Form 10-K pursuant to Item 201(e) of Regulation S-K. Each year reflects what the cumulative value of $100 would be, including reinvestment of dividends, if such amount were invested on December 31, 2025. |
5 | Adjusted EBITDA, a non-GAAP financial reporting measure, is used by the Company to evaluate operating performance of our core mining business and allows investors and analysts to compare results of the Company to similar results of other mining companies. For a reconciliation of Adjusted EBITDA to net income, please refer to the tables in Appendix A. |
1 | In all the years in question, Mitchell J. Krebs was our Chief Executive Officer. |
3 | During 2025, our non-PEO NEOs consisted of Thomas S. Whelan, Michael Routledge, Casey M. Nault and Aoife McGrath. During each of 2024, 2023 and 2022, our non-PEO NEOs consisted of Thomas S. Whelan, Michael Routledge, Casey M. Nault and Emilie C. Schouten. During 2021, our non-PEO NEOs consisted of Thomas S. Whelan, Michael Routledge, Casey M. Nault, Terrence F. Smith, and Hans J. Rasmussen. Mr. Smith departed the Company effective August 27, 2021, and Mr. Rasmussen retired from his position as Senior Vice President, Exploration, effective March 31, 2022. |
4 | Company and peer group TSR reflects the Company’s “TSR peer group” as reflected in our 2025 Annual Report on Form 10-K pursuant to Item 201(e) of Regulation S-K. Each year reflects what the cumulative value of $100 would be, including reinvestment of dividends, if such amount were invested on December 31, 2025. |
2 | The following tables set forth the adjustments made during 2025 represented in the PVP table to arrive at CAP to our PEO and average CAP to our other NEOs. The equity award adjustments to arrive at “Compensation Actually Paid” or “CAP” were calculated consistent with FASB ASC 718, and the valuation assumptions used to calculate fair values did not materially differ from those disclosed at the time of grant. For information on our adjustments made during 2021-2024, refer to our 2025 Proxy Statement. |
PEO | Average Non-PEO | |||||||
Total Reported in 2025 Summary Compensation Table (SCT) | $6,646,601 | $2,538,285 | ||||||
Less, value of Stock Awards reported in SCT | $4,223,336 | $1,464,327 | ||||||
Plus, Year-End Fair Value of Awards Granted in the Fiscal Year that are Unvested and Outstanding | $11,201,346 | $3,883,764 | ||||||
Plus, Change in Fair Value of Prior Year Awards that are Outstanding and Unvested | $28,497,925 | $10,600,550 | ||||||
Plus, FMV of Awards Granted this Year and that Vested this Year | — | — | ||||||
Plus, Change in Fair Value (from prior year-end to vesting date) of Prior Year Awards that Vested during the Fiscal Year | $679,017 | $125,232 | ||||||
Less, Prior Year Fair Value of Prior Year Awards that Failed to Vest this Year | — | — | ||||||
Total Adjustments | $36,154,953 | $13,145,218 | ||||||
Compensation Actually Paid for 2025 | $42,801,553 | $15,683,503 | ||||||
Additional Performance Measures
The following performance measures reflect the Company’s most important performance measures used to link compensation actually paid to NEOs to performance in 2025, as further described and defined in the CD&A.
Adjusted EBITDA | ||
ROIC | ||
Production | ||
Costs Applicable to Sales | ||
Growth in Reserves and Resources | ||
Environmental, Health and Safety Performance | ||
Strategic Initiatives | ||
rTSR | ||
5 | Adjusted EBITDA, a non-GAAP financial reporting measure, is used by the Company to evaluate operating performance of our core mining business and allows investors and analysts to compare results of the Company to similar results of other mining companies. For a reconciliation of Adjusted EBITDA to net income, please refer to the tables in Appendix A. |