Pay vs Performance Disclosure - USD ($)
Dec. 31, 2025
Dec. 31, 2024
Dec. 31, 2023
Dec. 31, 2022
Dec. 31, 2021
PAY VERSUS PERFORMANCE
We are providing the following information about the relationship between executive compensation actually paid (CAP) and certain financial performance of the Company as
required by SEC rules. Please see “Compensation Discussion and Analysis” for discussion of our compensation philosophy and how the Compensation and Talent Committee structures our compensation program with
performance-based and at-risk target compensation to motivate and reward the achievement of performance-based financial and other goals that align with our operational and strategic objectives. The SEC-defined CAP
data set forth in the table below does not reflect amounts actually realized by the NEOs, and the Compensation and Talent Committee has not used or considered CAP previously in establishing the NEO compensation
program. A significant portion of the CAP amounts shown relate to changes in values of unvested awards over the course of the reporting year. These unvested awards remain subject to significant risk from forfeiture
conditions and possible future declines in value based on changes in our stock price. As described in detail in the “Compensation Discussion and Analysis” section above, the PSUs are subject to multi-year performance
conditions tied to relative and absolute performance metrics and all of the RSUs and PSUs are subject to time vesting conditions. The ultimate values actually realized by the NEOs from unvested equity awards, if any,
will not be determined until the awards fully vest.
Pay Versus Performance Table
| Value Of Initial Fixed $100 Investment Based On: | | | ||||||
| Year | Summary Compensation Table Total For PEO ($)(1) | Compensation Actually Paid To PEO ($)(2) | Average Summary Compensation Table Total For Non-PEO NEOs ($)(3) | Average Compensation Actually Paid To Non-PEO NEOs ($)(2) | Total Shareholder Return ($)(4) | Peer Group Total Shareholder Return ($)(5) | Net Income ($ In Millions) (6) | Adjusted EBITDA ($ In Millions) (7) |
| 2025 | 12,966,927 | 14,539,276 | 2,544,371 | 2,626,605 | 55.77 | 79.56 | 18.3 | 174.8 |
| 2024 | 6,316,439 | (1,929,161) | 2,245,511 | 1,010,140 | 89.94 | 80.91 | 64.9 | 182.9 |
| 2023 | 7,572,491 | 3,969,782 | 2,141,593 | 1,831,339 | 117.95 | 104.54 | 40.3 | 180.6 |
| 2022 | 5,408,566 | (1,128,864) | 1,505,277 | 520,649 | 147.08 | 104.59 | 24.4 | 129.8 |
| 2021 | 5,972,977 | 10,669,937 | 1,470,524 | 1,525,029 | 195.76 | 142.18 | 93.4 | 157.0 |
| (1) |
Reflects the amount reported in the “Total” column of the Summary Compensation Table for our Principal Executive Officer (“PEO”), as applicable, for each
corresponding year. See “Named Executive Officer Compensation Tables – Summary Compensation Table for 2025, 2024, and 2023”.
|
| (2) | Amounts reported reflect CAP for Mr. Eyler from 2021 through 2024 and Mr. Presley in 2025 and for the other NEOs as a group (excluding Messrs. Eyler and Presley), as computed in accordance with Item 402(v) of Regulation S-K, for each corresponding year, which amounts do not reflect the actual amount of compensation earned by or paid to Messrs. Eyler and Presley or the other NEOs as a group (excluding Messrs. Eyler and Presley) during the applicable year. The adjustments below were made to Mr. Presley’s total compensation for 2025 and to the NEOs as a group (excluding Mr. Presley) for 2025 to determine the CAP for 2025 in accordance with the requirements of Item 402(v) of Regulation S-K. No amounts were reported in the “Change in Pension and Nonqualified Deferred Compensation” column of the Summary Compensation Table for 2025, so no defined benefit and actuarial pension plan adjustments were made 2025. |
| Fiscal Year 2025 | ||
| PEO ($) | Non-PEO NEOs ($) | |
| Summary Compensation Table total | 12,966,927 | 2,544,371 |
| Adjustments:(a) | ||
| Minus reported value of equity awards(b) | 7,804,910 | 1,144,421 |
| Plus year end fair value of equity awards granted in the year | 9,377,259 | 1,407,341 |
| Plus year over year change in fair value of outstanding and unvested equity awards | ― | (149,597) |
| Plus year over year change in fair value of equity awards granted in prior years that vested in the year | ― | (31,089) |
| Minus fair value at the end of the prior year of equity awards that failed to meet vesting conditions in the year | ― | ― |
| Compensation actually paid (CAP) | 14,539,276 | 2,626,605 |
| (a) |
The fair values of RSUs and PSUs included in the CAP to our PEO and the Average CAP to our other NEOs are calculated at the required measurement dates,
consistent with the approach used to value the awards at the grant date as described in our Annual Report on Form 10-K for 2025. The valuation assumptions used to calculate fair values did not materially
differ from those disclosed at the time of grant. Any changes to the RSU and PSU fair values from the grant date (for current year grants) and from prior year-end (for prior year grants) are based on our
updated stock price at the respective measurement dates, and for PSUs (Adjusted EBITDA/Relative Revenue Growth/Relative TSR/ROIC), updated Company performance metric projections.
|
| (b) |
Amounts reflect the grant date fair value of equity awards as reported in the “Stock Awards” column in the Summary Compensation Table for 2025. No amounts
were reported in the “Option Awards” column in the Summary Compensation Table for 2025.
|
| (3) | Reflects the average amount reported in the “Total” column of the Summary Compensation Table for our other NEOs as a group (excluding Messrs. Eyler and Presley) for each corresponding year. See “Named Executive Officer Compensation Tables – Summary Compensation Table for 2025, 2024, and 2023”. The names of each of the other NEOs (excluding Messrs. Eyler and Presley) included for purposes of calculating the average amounts in each applicable year are as follows: (i) for 2025, Mr. Douyard, Mr. Stocker, Ms. Wilson and Mr. Sundaram; (ii) for 2024, Mr. Anversa, Mr. Stocker, Ms. Wilson, Ms. Runyon and Ms. Xu; (iii) for 2023, Mr. Anversa, Mr. Stocker, Mr. Sundaram and Ms. Xu; (iv) for 2022, Mr. Anversa, Ms. Runyon, Mr. Stocker and Ms. Xu.; and (v) for 2021, Mr. Anversa, Mr. Fisch, Mr. Stocker, Ms. Xu and Mr. Giberson. |
| (4) |
The cumulative TSR depicts a hypothetical $100 investment in our common stock. The amount is calculated by dividing the sum of the cumulative amount of
dividends for the measurement period, assuming dividend reinvestment, and the difference between the Company’s share price at the end and the beginning of the measurement period by the Company’s share price
at the beginning of the measurement period. Historical stock performance is not necessarily indicative of future stock performance.
|
| (5) | The cumulative TSR depicts a hypothetical $100 investment in our common stock. The amount represents the TSR for the Dow Jones US Auto Parts Index, weighted according to the respective companies’ stock market capitalization at the beginning of each period for which a return is indicated. |
| (6) |
Amounts reflect the net income as reported in the Company’s audited consolidated financial statements for the applicable year.
|
| (7) | Adjusted EBITDA is defined as earnings before interest, taxes, depreciation and amortization, deferred financing cost amortization, non-cash stock based compensation expenses, and other gains and losses not reflective of the Company’s ongoing operations and related tax effects, including transaction expenses, debt retirement expenses, impairment of assets held for sale, impairment of goodwill, gain or loss on sale of business, restructuring expense, unrealized currency gain or loss, and unrealized revaluation of derivatives. Beginning in 2023, the Company excluded the impact of non-cash stock-based compensation from Adjusted EBITDA results; prior years have not been restated. We may calculate Adjusted EBITDA differently in future years. |
| (2) | Amounts reported reflect CAP for Mr. Eyler from 2021 through 2024 and Mr. Presley in 2025 and for the other NEOs as a group (excluding Messrs. Eyler and Presley), as computed in accordance with Item 402(v) of Regulation S-K, for each corresponding year, which amounts do not reflect the actual amount of compensation earned by or paid to Messrs. Eyler and Presley or the other NEOs as a group (excluding Messrs. Eyler and Presley) during the applicable year. The adjustments below were made to Mr. Presley’s total compensation for 2025 and to the NEOs as a group (excluding Mr. Presley) for 2025 to determine the CAP for 2025 in accordance with the requirements of Item 402(v) of Regulation S-K. No amounts were reported in the “Change in Pension and Nonqualified Deferred Compensation” column of the Summary Compensation Table for 2025, so no defined benefit and actuarial pension plan adjustments were made 2025. |
| (3) | Reflects the average amount reported in the “Total” column of the Summary Compensation Table for our other NEOs as a group (excluding Messrs. Eyler and Presley) for each corresponding year. See “Named Executive Officer Compensation Tables – Summary Compensation Table for 2025, 2024, and 2023”. The names of each of the other NEOs (excluding Messrs. Eyler and Presley) included for purposes of calculating the average amounts in each applicable year are as follows: (i) for 2025, Mr. Douyard, Mr. Stocker, Ms. Wilson and Mr. Sundaram; (ii) for 2024, Mr. Anversa, Mr. Stocker, Ms. Wilson, Ms. Runyon and Ms. Xu; (iii) for 2023, Mr. Anversa, Mr. Stocker, Mr. Sundaram and Ms. Xu; (iv) for 2022, Mr. Anversa, Ms. Runyon, Mr. Stocker and Ms. Xu.; and (v) for 2021, Mr. Anversa, Mr. Fisch, Mr. Stocker, Ms. Xu and Mr. Giberson. |
| (5) | The cumulative TSR depicts a hypothetical $100 investment in our common stock. The amount represents the TSR for the Dow Jones US Auto Parts Index, weighted according to the respective companies’ stock market capitalization at the beginning of each period for which a return is indicated. |
| (2) | Amounts reported reflect CAP for Mr. Eyler from 2021 through 2024 and Mr. Presley in 2025 and for the other NEOs as a group (excluding Messrs. Eyler and Presley), as computed in accordance with Item 402(v) of Regulation S-K, for each corresponding year, which amounts do not reflect the actual amount of compensation earned by or paid to Messrs. Eyler and Presley or the other NEOs as a group (excluding Messrs. Eyler and Presley) during the applicable year. The adjustments below were made to Mr. Presley’s total compensation for 2025 and to the NEOs as a group (excluding Mr. Presley) for 2025 to determine the CAP for 2025 in accordance with the requirements of Item 402(v) of Regulation S-K. No amounts were reported in the “Change in Pension and Nonqualified Deferred Compensation” column of the Summary Compensation Table for 2025, so no defined benefit and actuarial pension plan adjustments were made 2025. |
| Fiscal Year 2025 | ||
| PEO ($) | Non-PEO NEOs ($) | |
| Summary Compensation Table total | 12,966,927 | 2,544,371 |
| Adjustments:(a) | ||
| Minus reported value of equity awards(b) | 7,804,910 | 1,144,421 |
| Plus year end fair value of equity awards granted in the year | 9,377,259 | 1,407,341 |
| Plus year over year change in fair value of outstanding and unvested equity awards | ― | (149,597) |
| Plus year over year change in fair value of equity awards granted in prior years that vested in the year | ― | (31,089) |
| Minus fair value at the end of the prior year of equity awards that failed to meet vesting conditions in the year | ― | ― |
| Compensation actually paid (CAP) | 14,539,276 | 2,626,605 |
| (a) |
The fair values of RSUs and PSUs included in the CAP to our PEO and the Average CAP to our other NEOs are calculated at the required measurement dates,
consistent with the approach used to value the awards at the grant date as described in our Annual Report on Form 10-K for 2025. The valuation assumptions used to calculate fair values did not materially
differ from those disclosed at the time of grant. Any changes to the RSU and PSU fair values from the grant date (for current year grants) and from prior year-end (for prior year grants) are based on our
updated stock price at the respective measurement dates, and for PSUs (Adjusted EBITDA/Relative Revenue Growth/Relative TSR/ROIC), updated Company performance metric projections.
|
| (b) |
Amounts reflect the grant date fair value of equity awards as reported in the “Stock Awards” column in the Summary Compensation Table for 2025. No amounts
were reported in the “Option Awards” column in the Summary Compensation Table for 2025.
|
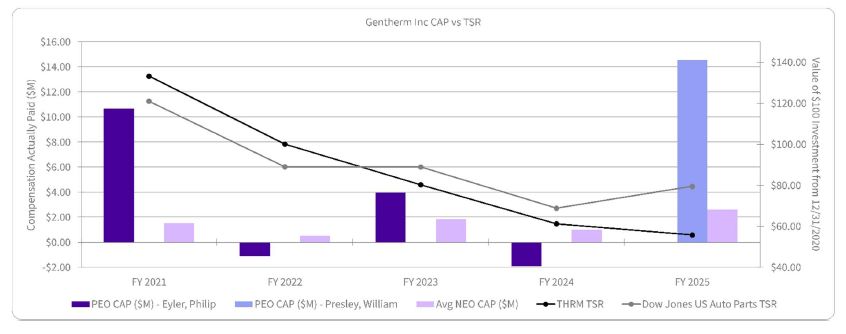
Cap And Cumulative TSR
The CAP for Mr. Eyler from 2021 through 2024 and Mr. Presley in 2025 and the average CAP for the Company’s other NEOs as a group (excluding Messrs. Eyler and
Presley) for 2021, 2022, 2023, 2024 and 2025 is presented in comparison to the Company’s cumulative TSR and to the Dow Jones U.S. Auto Parts Index (the peer group presented for this purpose) for the five years
presented in the Pay Versus Performance Table above in the table below.
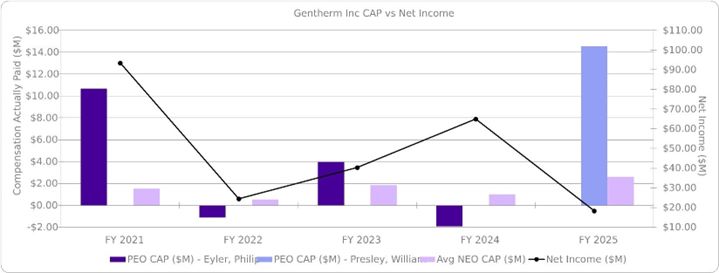
Cap And Net Income
The CAP for Mr. Eyler from 2021 through 2024 and Mr. Presley in 2025 and the average CAP for the Company’s other NEOs as a group (excluding Messrs. Eyler and
Presley) for 2021, 2022, 2023, 2024 and 2025 is presented in comparison to the Company’s net income over such periods in the table below.
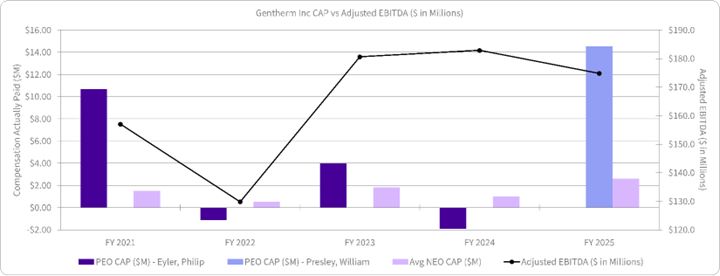
Cap And Adjusted EBITDA
The CAP for Mr. Eyler from 2021 through 2024 and Mr. Presley in 2025 and the average CAP for the Company’s other NEOs as a group (excluding Messrs. Eyler and
Presley) for 2021, 2022, 2023, 2024 and 2025 is presented in comparison to the Company’s Adjusted EBITDA over such periods in the table below.
Cap And Cumulative TSR
The CAP for Mr. Eyler from 2021 through 2024 and Mr. Presley in 2025 and the average CAP for the Company’s other NEOs as a group (excluding Messrs. Eyler and
Presley) for 2021, 2022, 2023, 2024 and 2025 is presented in comparison to the Company’s cumulative TSR and to the Dow Jones U.S. Auto Parts Index (the peer group presented for this purpose) for the five years
presented in the Pay Versus Performance Table above in the table below.
Financial Performance Measures
As described in “Compensation Discussion and Analysis,” a significant portion of the NEO pay is performance-based and at-risk, consistent with the compensation
philosophy established by the Compensation and Talent Committee. The NEO compensation program rewards the achievement of specific short-term (annual) and long-term financial and other goals, which are aligned with
our operational and strategic goals. The most important financial performance measures used by the Company to link CAP for the Company’s NEOs to the Company’s performance for the most recently completed year are
shown below.
| MOST IMPORTANT PERFORMANCE MEASURES | |||
| Adjusted EBITDA | Revenue Growth | ||
| Adjusted EBITDA Margin | Relative TSR* | ||
| Adjusted Free Cash Flow Conversion | |||
*Reflects the Company’s TSR compared to a peer group established by the Compensation and Talent Committee.
Company Selected Measure
We have presented Adjusted EBITDA as the Company-selected measure in the table above in accordance with Item 402(v) of Regulation S-K. While the Company uses numerous
financial and non-financial performance measures for the purpose of evaluating performance for the Company’s compensation programs, the Company has determined that Adjusted EBITDA is the financial performance
measure that, in the Company’s assessment, represents the most important performance measure used by the Company to link CAP for the Company’s NEOs to Company performance for the most recently completed year that
is not otherwise required to be disclosed in the pay versus performance table above. In identifying Adjusted EBITDA as the most important performance measure used by the Company to link CAP for the NEOs to
performance for 2025, we considered that (1) the cash bonuses earned by the NEOs under the 2025 Senior Level Bonus Plan were based on the achievement of two financial performance metrics— Adjusted EBITDA and
Adjusted Free Cash Flow Conversion—along with a strategic goals measurement, with Adjusted EBITDA being weighted the greatest at 50% and (2) 60-70% of the grant value of the 2025 equity awards granted to the NEOs
was delivered via target PSUs, with 75% of the grant value of such target PSUs being earned based on our annual and three-year growth of Adjusted EBITDA Margin. We may determine a different financial performance
measure to be the most important financial performance measure in future years.