Pay vs Performance Disclosure - USD ($)
Dec. 31, 2025
Dec. 31, 2024
Dec. 31, 2023
Dec. 31, 2022
Dec. 31, 2021
Pay vs. Performance (“PvP”) Tabular Disclosure — 2025
As required by Section 953(a) of the Dodd-Frank Act, and Item 402(v) of Regulation philosophy and how the Company aligns executive compensation with the Company’s performance, refer to the Compensation Discussion and Analysis.
S-K,
we are providing the following information about the relationship between “compensation actually paid” (“CAP”) to our CEO and to our other NEOs and certain financial performance metrics of the Company. CAP, as determined under SEC requirements, does not reflect the actual amount of compensation earned by or paid to our executive officers during a covered year. For further information concerning the Company’s pay-for-performance
Pay |
Performance | ||||||||||||||||||||||||||||||||||||||||||||||||||||
CEO |
Average of Other NEOs |
Value of $100 Initial Investment Based On: |
|||||||||||||||||||||||||||||||||||||||||||||||||||
Year (1) |
SCT Total Comp - CEO |
SCT Total Comp - Prior CEO |
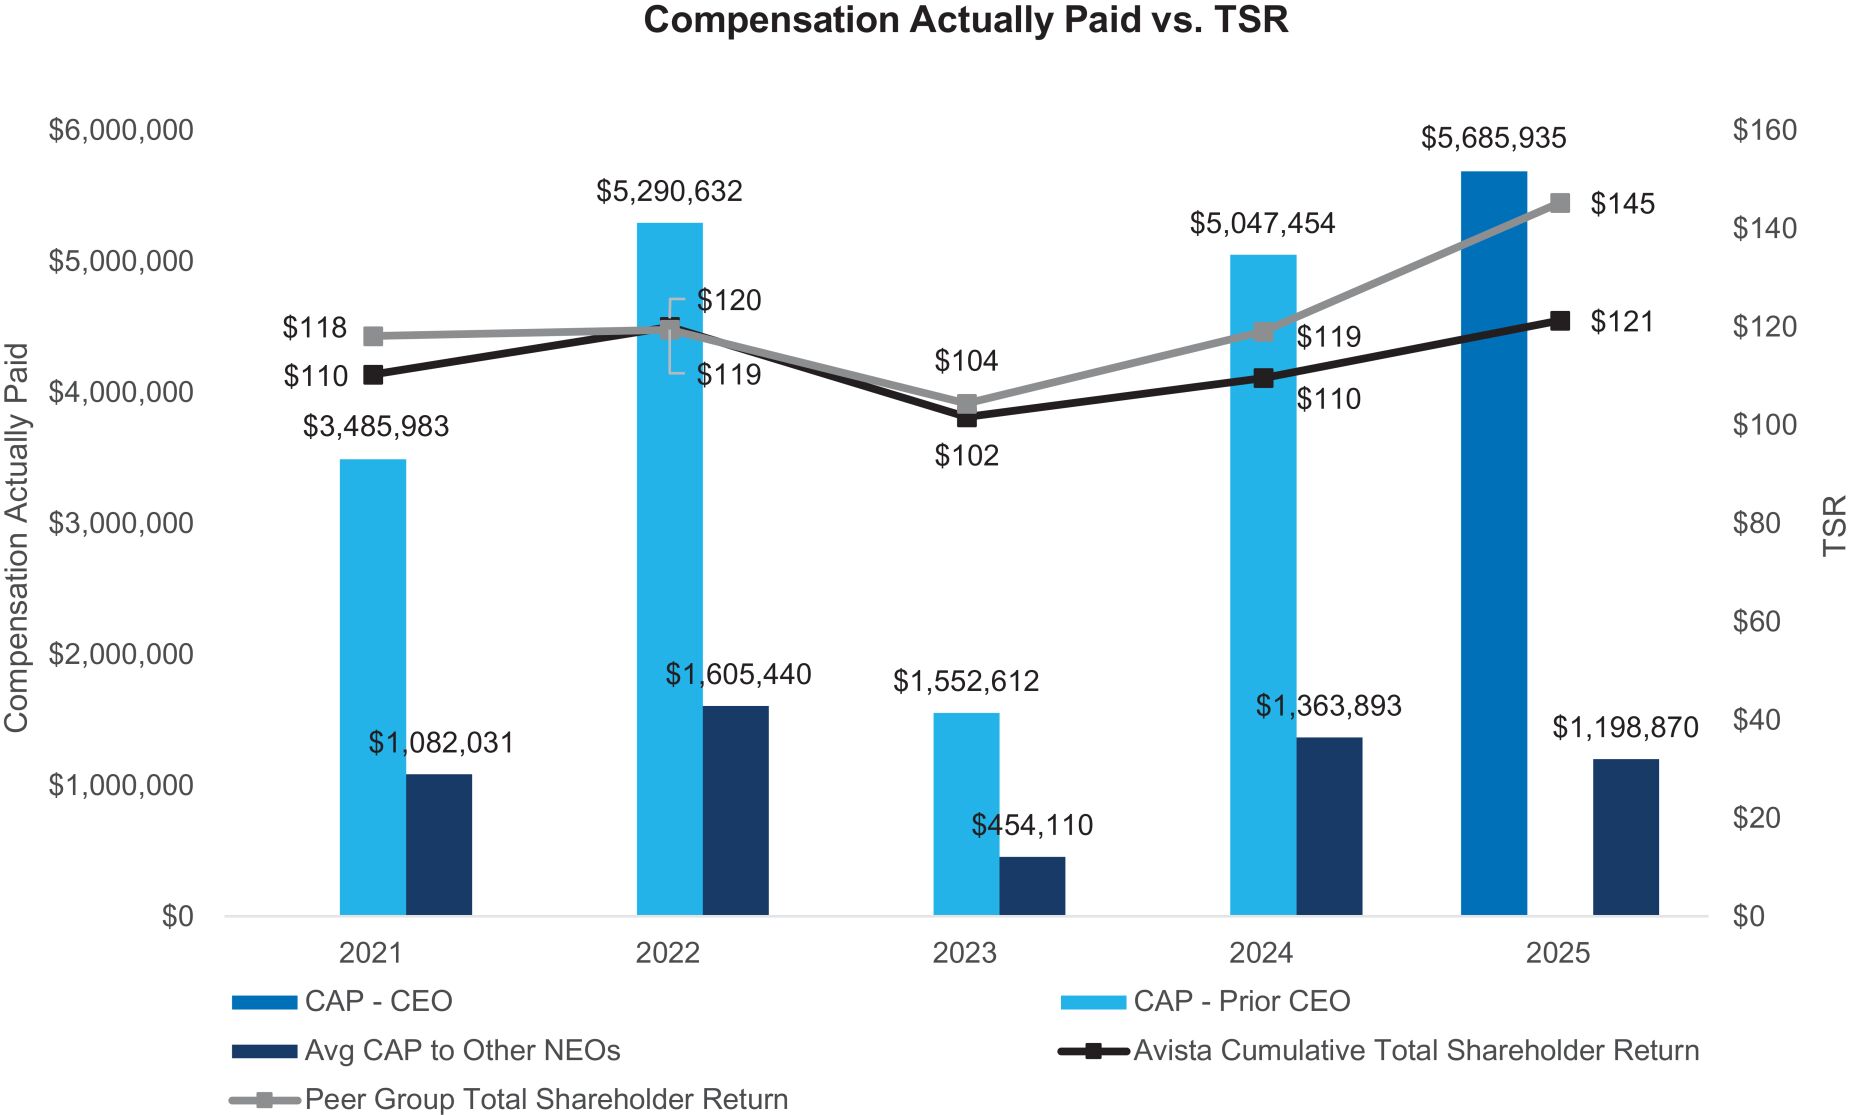
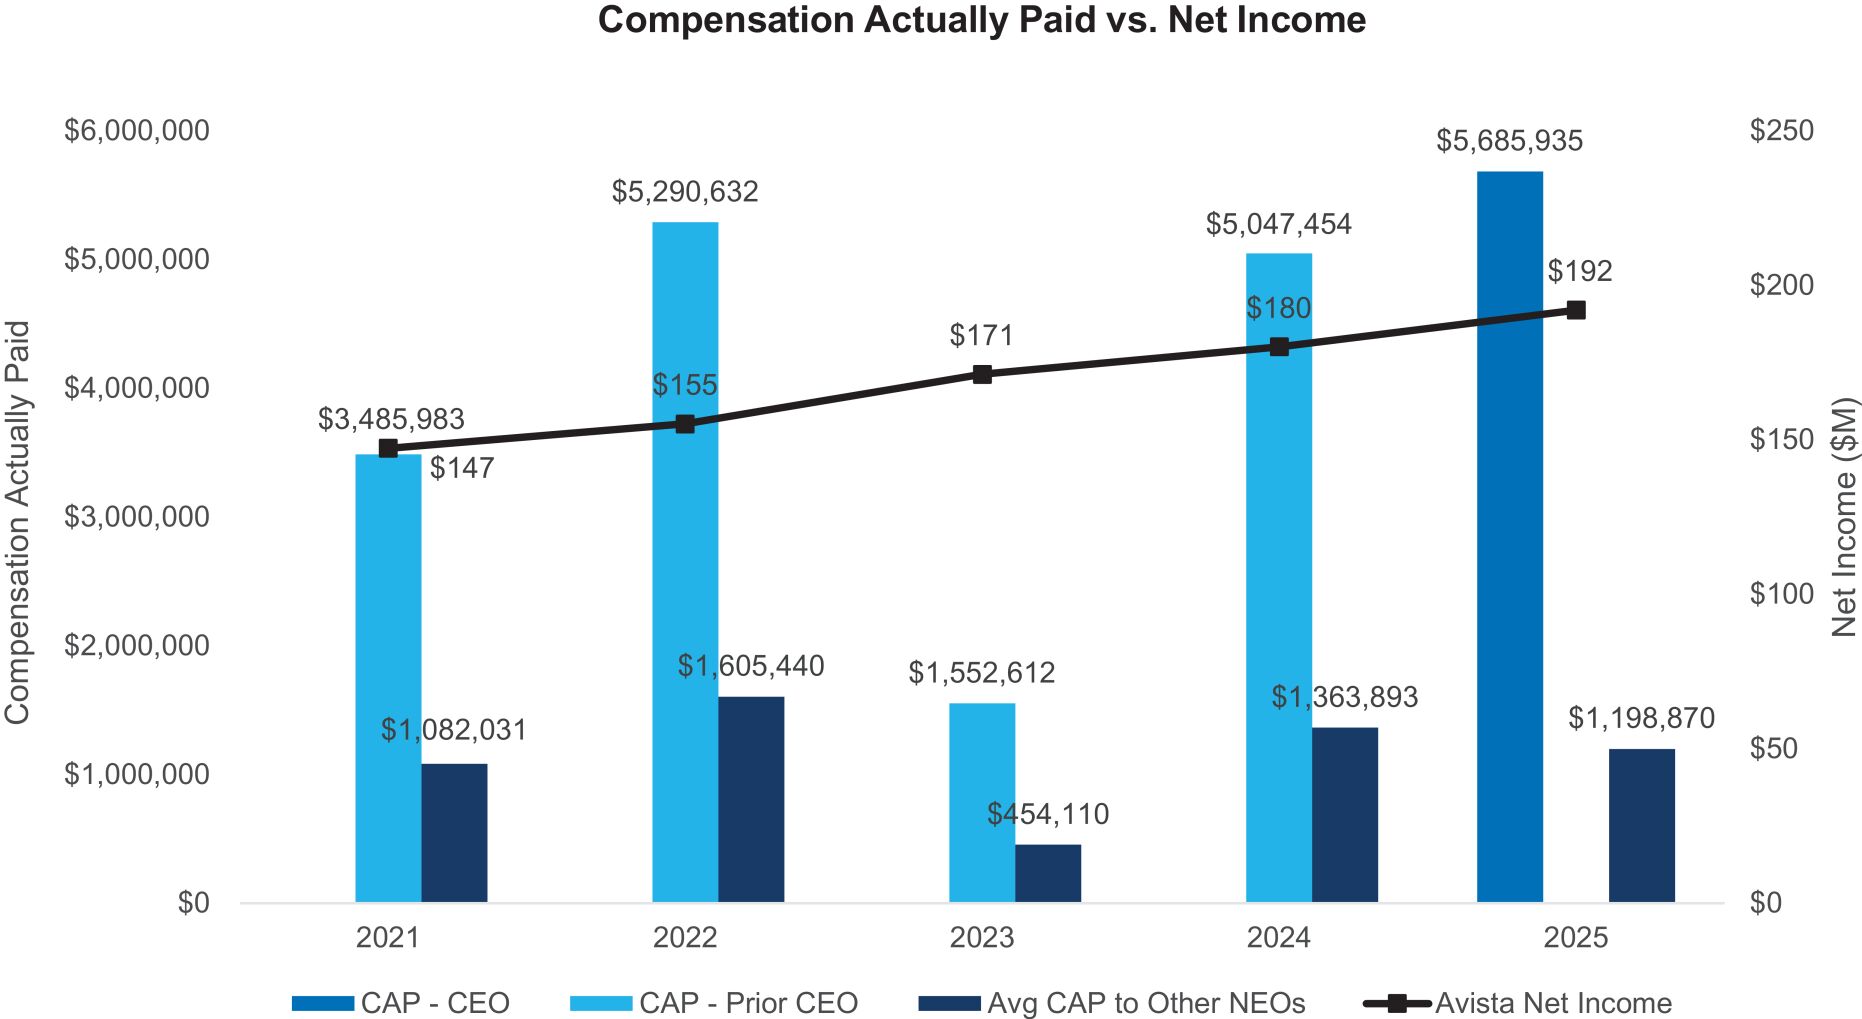
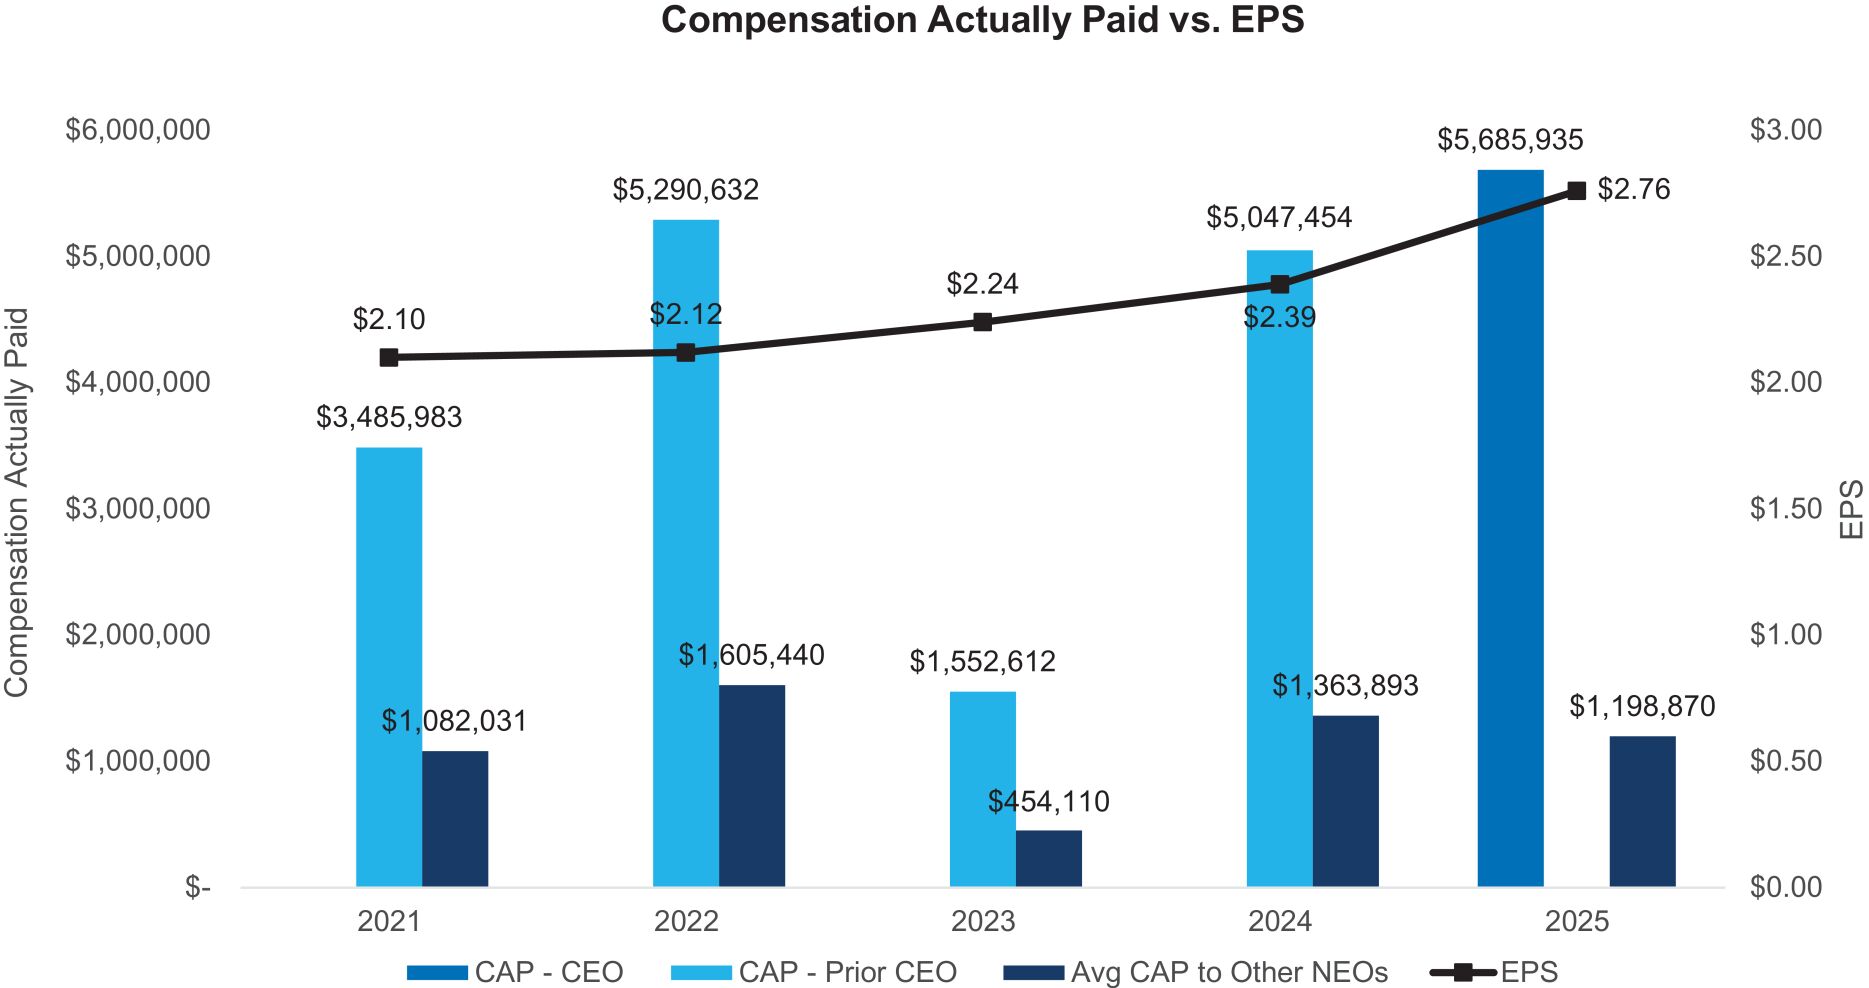
Compensation Actually Paid (2) - CEO |
Compensation Actually Paid (2) - PriorCEO |
SCT Total Compensation |
Compensation Actually Paid (2) |
Cumulative TSR |
Peer Group Cumulative TSR (3) |
Net Income ($M) |
EPS | |||||||||||||||||||||||||||||||||||||||||||
2025 |
$ |
4,773,308 |
— |
$ |
5,685,935 |
— |
$ |
1,699,924 |
$ |
1,198,870 |
$ |
121 |
$ |
145 |
$ |
192.0 |
$ |
2.76 |
|||||||||||||||||||||||||||||||||||
2024 |
$ |
4,977,194 |
$ |
5,047,454 |
$ |
1,340,034 |
$ |
1,363,893 |
$ |
110 |
$ |
119 |
$ |
180.1 |
$ |
2.39 |
|||||||||||||||||||||||||||||||||||||
2023 |
$ |
5,229,962 |
$ |
1,552,612 |
$ |
1,137,887 |
$ |
454,110 |
$ |
102 |
$ |
104 |
$ |
171.2 |
$ |
2.24 |
|||||||||||||||||||||||||||||||||||||
2022 |
$ |
4,745,379 |
$ |
5,290,632 |
$ |
1,318,402 |
$ |
1,605,440 |
$ |
120 |
$ |
119 |
$ |
155.2 |
$ |
2.12 |
|||||||||||||||||||||||||||||||||||||
2021 |
$ |
4,577,539 |
$ |
3,485,983 |
$ |
1,257,052 |
$ |
1,082,031 |
$ |
110 |
$ |
118 |
$ |
147.3 |
$ |
2.10 |
|||||||||||||||||||||||||||||||||||||
| (1) | The CEO in reporting years 2021-2024 was Dennis Vermillion; the current CEO for 2025 is Heather Rosentrater. The other NEOs in the 2024 reporting year were Kevin Christie, Heather Rosentrater, Gregory Hesler, and Jason Thackston. The other NEOs in the 2023 reporting year were Mark Thies (ret.), Kevin Christie, Heather Rosentrater, Jason Thackston, and Wayne Manuel. The other NEOs in the 2022 and 2021 reporting years were Mark Thies (ret.), Jason Thackston, Heather Rosentrater, and Kevin Christie. |
| (2) | Amounts reported in this column are based upon total compensation reported for our CEO and our other NEOs in the SCT for the indicated reporting years and adjusted as shown in the table below. Fair value of equity awards was computed in accordance with the Company’s methodology used for financial reporting purposes. |
2021 |
2022 |
2023 |
2024 |
2025 | ||||||||||||||||||||||||||||||||||||||||||||||
CEO |
Other NEOs |
CEO |
Other NEOs |
CEO |
Other NEOs |
CEO |
Other NEOs |
CEO |
Other NEOs | |||||||||||||||||||||||||||||||||||||||||
SCT Reported Compensation |
$ |
4,577,539 |
$ |
1,257,052 |
$ |
4,745,379 |
$ |
1,318,402 |
$ |
5,229,962 |
$ |
1,137,887 |
$ |
4,977,194 |
$ |
1,340,034 |
$ |
4,773,308 |
$ |
1,699,924 |
||||||||||||||||||||||||||||||
Deduct: |
$ | (905,751 | ) | $ | (170,893 | ) | $ | — | $ | — | $ | (1,384,964 | ) | $ | (155,884 | ) | $ | (528,636 | ) | $ | (142,187 | ) | $ | (419,238 | ) | $ | (239,668 | ) | ||||||||||||||||||||||
Add |
$ | 6,658 | $ | 118,549 | $ | 3,813 | $ | 115,378 | $ | 804 | $ | 35,117 | $ | 422 | $ | 51,637 | $ | 62,999 | $ | 56,851 | ||||||||||||||||||||||||||||||
Deduct: |
$ | (1,986,445 | ) | $ | (443,078 | ) | $ | (2,923,157 | ) | $ | (642,502 | ) | $ | (2,728,537 | ) | $ | (505,521 | ) | $ | (2,854,069 | ) | $ | (530,051 | ) | $ | (2,653,743 | ) | $ | (718,294 | ) | ||||||||||||||||||||
Deduct |
$ | — | $ | — | $ | — | $ | — | $ | — | $ | (104,376 | ) | $ | — | $ | — | $ | — | $ | — | |||||||||||||||||||||||||||||
Add: |
$ | 1,865,542 | $ | 416,058 | $ | 2,626,495 | $ | 577,278 | $ | 1,767,071 | $ | 242,652 | $ | 3,213,321 | $ | 596,766 | $ | 3,742,943 | $ | 414,596 | ||||||||||||||||||||||||||||||
Add |
$ | (192,645 | ) | $ | (63,103 | ) | $ | 268,274 | $ | 61,234 | $ | (1,518,971 | ) | $ | (240,617 | ) | $ | (454,563 | ) | $ | (77,953 | ) | $ | (364,976 | ) | $ | (202,047 | ) | ||||||||||||||||||||||
Add |
$ | 179,733 | $ | 40,100 | $ | 217,488 | $ | 63,451 | $ | 227,735 | $ | 58,177 | $ | 314,212 | $ | 58,361 | $ | 294,407 | $ | 91,436 | ||||||||||||||||||||||||||||||
Add: |
$ | (197,784 | ) | $ | (108,165 | ) | $ | 119,893 | $ | 60,392 | $ | (183,866 | ) | $ | (36,344 | ) | $ | 164,104 | $ | 27,739 | $ | 52,257 | $ | 37,173 | ||||||||||||||||||||||||||
Add |
$ | 139,135 | $ | 35,511 | $ | 232,446 | $ | 51,807 | $ | 143,377 | $ | 23,019 | $ | 215,470 | $ | 39,548 | $ | 197,978 | $ | 58,899 | ||||||||||||||||||||||||||||||
Total Compensation Actually Paid |
$ |
3,485,983 |
$ |
1,082,031 |
$ |
5,290,632 |
$ |
1,605,440 |
$ |
1,552,612 |
$ |
454,110 |
$ |
5,047,454 |
$ |
1,363,893 |
$ |
5,685,935 |
$ |
1,198,870 |
||||||||||||||||||||||||||||||
| (3) | Amounts reported in this column represent returns on an initial $100 investment in the S&P 400 Utilities Index, which we chose as peer group for purposes of the PvP table. |
| (1) | The CEO in reporting years 2021-2024 was Dennis Vermillion; the current CEO for 2025 is Heather Rosentrater. The other NEOs in the 2024 reporting year were Kevin Christie, Heather Rosentrater, Gregory Hesler, and Jason Thackston. The other NEOs in the 2023 reporting year were Mark Thies (ret.), Kevin Christie, Heather Rosentrater, Jason Thackston, and Wayne Manuel. The other NEOs in the 2022 and 2021 reporting years were Mark Thies (ret.), Jason Thackston, Heather Rosentrater, and Kevin Christie. |
| (3) | Amounts reported in this column represent returns on an initial $100 investment in the S&P 400 Utilities Index, which we chose as peer group for purposes of the PvP table. |
| (2) | Amounts reported in this column are based upon total compensation reported for our CEO and our other NEOs in the SCT for the indicated reporting years and adjusted as shown in the table below. Fair value of equity awards was computed in accordance with the Company’s methodology used for financial reporting purposes. |
2021 |
2022 |
2023 |
2024 |
2025 | ||||||||||||||||||||||||||||||||||||||||||||||
CEO |
Other NEOs |
CEO |
Other NEOs |
CEO |
Other NEOs |
CEO |
Other NEOs |
CEO |
Other NEOs | |||||||||||||||||||||||||||||||||||||||||
SCT Reported Compensation |
$ |
4,577,539 |
$ |
1,257,052 |
$ |
4,745,379 |
$ |
1,318,402 |
$ |
5,229,962 |
$ |
1,137,887 |
$ |
4,977,194 |
$ |
1,340,034 |
$ |
4,773,308 |
$ |
1,699,924 |
||||||||||||||||||||||||||||||
Deduct: |
$ | (905,751 | ) | $ | (170,893 | ) | $ | — | $ | — | $ | (1,384,964 | ) | $ | (155,884 | ) | $ | (528,636 | ) | $ | (142,187 | ) | $ | (419,238 | ) | $ | (239,668 | ) | ||||||||||||||||||||||
Add |
$ | 6,658 | $ | 118,549 | $ | 3,813 | $ | 115,378 | $ | 804 | $ | 35,117 | $ | 422 | $ | 51,637 | $ | 62,999 | $ | 56,851 | ||||||||||||||||||||||||||||||
Deduct: |
$ | (1,986,445 | ) | $ | (443,078 | ) | $ | (2,923,157 | ) | $ | (642,502 | ) | $ | (2,728,537 | ) | $ | (505,521 | ) | $ | (2,854,069 | ) | $ | (530,051 | ) | $ | (2,653,743 | ) | $ | (718,294 | ) | ||||||||||||||||||||
Deduct |
$ | — | $ | — | $ | — | $ | — | $ | — | $ | (104,376 | ) | $ | — | $ | — | $ | — | $ | — | |||||||||||||||||||||||||||||
Add: |
$ | 1,865,542 | $ | 416,058 | $ | 2,626,495 | $ | 577,278 | $ | 1,767,071 | $ | 242,652 | $ | 3,213,321 | $ | 596,766 | $ | 3,742,943 | $ | 414,596 | ||||||||||||||||||||||||||||||
Add |
$ | (192,645 | ) | $ | (63,103 | ) | $ | 268,274 | $ | 61,234 | $ | (1,518,971 | ) | $ | (240,617 | ) | $ | (454,563 | ) | $ | (77,953 | ) | $ | (364,976 | ) | $ | (202,047 | ) | ||||||||||||||||||||||
Add |
$ | 179,733 | $ | 40,100 | $ | 217,488 | $ | 63,451 | $ | 227,735 | $ | 58,177 | $ | 314,212 | $ | 58,361 | $ | 294,407 | $ | 91,436 | ||||||||||||||||||||||||||||||
Add: |
$ | (197,784 | ) | $ | (108,165 | ) | $ | 119,893 | $ | 60,392 | $ | (183,866 | ) | $ | (36,344 | ) | $ | 164,104 | $ | 27,739 | $ | 52,257 | $ | 37,173 | ||||||||||||||||||||||||||
Add |
$ | 139,135 | $ | 35,511 | $ | 232,446 | $ | 51,807 | $ | 143,377 | $ | 23,019 | $ | 215,470 | $ | 39,548 | $ | 197,978 | $ | 58,899 | ||||||||||||||||||||||||||||||
Total Compensation Actually Paid |
$ |
3,485,983 |
$ |
1,082,031 |
$ |
5,290,632 |
$ |
1,605,440 |
$ |
1,552,612 |
$ |
454,110 |
$ |
5,047,454 |
$ |
1,363,893 |
$ |
5,685,935 |
$ |
1,198,870 |
||||||||||||||||||||||||||||||
Most Important Measures Linking Avista NEO Pay to Performance — 2025
The following are the most important financial and
non-financial
performance measures, as determined by the Company, that link compensation actually paid to our NEOs to the Company’s performance for the most recently completed fiscal year. | • | Earnings per Share (“EPS”) |
| • | 3-Year Relative TSR |
| • | Cost Per Customer |