Pay vs Performance Disclosure - USD ($)
|
12 Months Ended |
Dec. 31, 2025 |
Dec. 31, 2024 |
Dec. 31, 2023 |
Dec. 31, 2022 |
Dec. 31, 2021 |
| Pay vs Performance Disclosure |
|
|
|
|
|
| Pay vs Performance Disclosure, Table |
| | | | | | | | | | | | | | | | | | | | | | | | | | | | | | | | | | Year | Summary Compensation Table Total for PEO (Nunes) (1) | Summary Compensation Table Total for PEO (McHugh) (1) | Compensation Actually Paid to PEO (Nunes) (2) | Compensation Actually Paid to PEO (McHugh) (2) | Average Summary Compensation Table Total for Other NEOs (1) | Average Compensation Actually Paid to Other NEOs (2) | Value of Initial Fixed $100 Investment Based On: | Net Income
(in millions) | Adjusted EBITDA (4)
(in millions) | | Total Shareholder Return | Peer Group Total Shareholder Return (3) | | 2025 | — | | $5,457,716 | | — | | $4,170,523 | | $2,014,782 | | $1,636,852 | | $99.72 | | $105.43 | | $480.4 | | $248.0 | | | 2024 | $3,357,889 | | $4,751,207 | | $331,928 | | $3,205,374 | | $1,731,472 | | $1,216,143 | | $108.51 | | $107.29 | | $369.0 | | $230.2 | | | 2023 | $6,285,716 | | — | | $5,746,248 | | — | | $1,930,903 | | $1,720,720 | | $125.99 | | $106.31 | | $178.5 | | $246.0 | | | 2022 | $5,751,241 | | — | | $4,677,297 | | — | | $1,636,262 | | $1,396,101 | | $119.24 | | $99.59 | | $122.8 | | $259.9 | | | 2021 | $5,316,481 | | — | | $9,416,465 | | — | | $1,532,344 | | $2,390,845 | | $141.54 | | $137.29 | | $210.5 | | $250.5 | |
|
|
|
|
|
| Company Selected Measure Name |
Adjusted EBITDA
|
|
|
|
|
| Named Executive Officers, Footnote |
|
For 2025, Mr. McHugh is included in the second PEO columns. For 2024, Mr. Nunes is included in the first PEO columns and Mr. McHugh is included in the second PEO columns. For 2025 and 2024, Ms. Tice and Messrs. Long, Rogers and Bridwell are included in the Other NEOs columns. For 2023, 2022 and 2021, Mr. Nunes is included in the PEO columns and Messrs. McHugh, Long, Rogers and Bridwell are included in the Other NEOs columns.
|
|
|
|
| Peer Group Issuers, Footnote |
The peer group represents the FTSE NAREIT All Equity REIT Index.
|
|
|
|
|
| Adjustment To PEO Compensation, Footnote |
The dollar amounts reported represent the amount of “compensation actually paid”, as computed in accordance with Item 402(v) of Regulation S-K. The dollar amounts do not reflect the actual amount of compensation earned by or paid to our NEOs during the applicable year. The value represents the Summary Compensation Table totals for the applicable year less the pension and stock award columns, plus: (a) the fair value of stock awards calculated by taking the year end fair value of stock awards granted during the year, plus the change in fair value during the fiscal year for outstanding awards granted in prior years, plus for any awards vested during the year, the change in fair value during the fiscal year through the date of vesting; and (b) the aggregate of the service costs attributable to services rendered during the year for pension plan participants which is $0 since our plan was frozen on December 31, 2016. Performance share awards were valued using a Monte Carlo simulation model. A reconciliation of the adjustments are summarized in the following table: | | | | | | | | | | | | | | | | | | | | | | | | | | | | Year | Summary Compensation Table Total | Deductions | Additions | Compensation Actually Paid | Summary Compensation Table
Stock Awards | Summary Compensation Table
Pension | Year End Fair Value of Equity Awards Granted in the Year | Year over Year Change in Fair Value of Outstanding Unvested Equity Awards Granted in Prior Years | Year over Year Change in Fair Value of Equity Awards Granted in Prior Years that Vested in the Year | Value of Dividends Paid on Equity Awards not Otherwise Reflected in Fair Value or Total Compensation | | PEO | | 2025 | $5,457,716 | | $3,058,120 | | — | | $2,129,585 | | ($802,609) | | $75,167 | | $368,784 | | $4,170,523 | | | 2024 (McHugh) | $4,751,207 | | $2,911,666 | | — | | $1,974,564 | | ($852,510) | | $165,040 | | $78,739 | | $3,205,374 | | | 2024 (Nunes) | $3,357,889 | | $1,970,264 | | — | | $666,238 | | ($2,309,005) | | $461,701 | | $125,369 | | $331,928 | | | 2023 | $6,285,716 | | $3,786,040 | | — | | $3,709,528 | | $176,590 | | ($801,783) | | $162,237 | | $5,746,248 | | | 2022 | $5,751,241 | | $3,337,902 | | — | | $2,727,867 | | ($1,270,246) | | $649,325 | | $157,012 | | $4,677,297 | | | 2021 | $5,316,481 | | $2,735,312 | | — | | $3,377,761 | | $3,284,367 | | $32,246 | | $140,922 | | $9,416,465 | | | Other NEOs | | 2025 | $2,014,782 | | $844,223 | | — | | $587,892 | | ($261,564) | | $26,541 | | $113,424 | | $1,636,852 | | | 2024 | $1,731,472 | | $778,060 | | — | | $527,646 | | ($355,417) | | $63,702 | | $26,800 | | $1,216,143 | | | 2023 | $1,930,903 | | $893,213 | | $93,329 | | $875,162 | | $37,866 | | ($172,494) | | $35,825 | | $1,720,720 | | | 2022 | $1,636,262 | | $743,195 | | — | | $607,369 | | ($268,765) | | $131,238 | | $33,192 | | $1,396,101 | | | 2021 | $1,532,344 | | $587,060 | | — | | $724,944 | | $685,016 | | $6,725 | | $28,876 | | $2,390,845 | |
|
|
|
|
|
| Non-PEO NEO Average Total Compensation Amount |
$ 2,014,782
|
$ 1,731,472
|
$ 1,930,903
|
$ 1,636,262
|
$ 1,532,344
|
| Non-PEO NEO Average Compensation Actually Paid Amount |
$ 1,636,852
|
1,216,143
|
1,720,720
|
1,396,101
|
2,390,845
|
| Adjustment to Non-PEO NEO Compensation Footnote |
The dollar amounts reported represent the amount of “compensation actually paid”, as computed in accordance with Item 402(v) of Regulation S-K. The dollar amounts do not reflect the actual amount of compensation earned by or paid to our NEOs during the applicable year. The value represents the Summary Compensation Table totals for the applicable year less the pension and stock award columns, plus: (a) the fair value of stock awards calculated by taking the year end fair value of stock awards granted during the year, plus the change in fair value during the fiscal year for outstanding awards granted in prior years, plus for any awards vested during the year, the change in fair value during the fiscal year through the date of vesting; and (b) the aggregate of the service costs attributable to services rendered during the year for pension plan participants which is $0 since our plan was frozen on December 31, 2016. Performance share awards were valued using a Monte Carlo simulation model. A reconciliation of the adjustments are summarized in the following table: | | | | | | | | | | | | | | | | | | | | | | | | | | | | Year | Summary Compensation Table Total | Deductions | Additions | Compensation Actually Paid | Summary Compensation Table
Stock Awards | Summary Compensation Table
Pension | Year End Fair Value of Equity Awards Granted in the Year | Year over Year Change in Fair Value of Outstanding Unvested Equity Awards Granted in Prior Years | Year over Year Change in Fair Value of Equity Awards Granted in Prior Years that Vested in the Year | Value of Dividends Paid on Equity Awards not Otherwise Reflected in Fair Value or Total Compensation | | PEO | | 2025 | $5,457,716 | | $3,058,120 | | — | | $2,129,585 | | ($802,609) | | $75,167 | | $368,784 | | $4,170,523 | | | 2024 (McHugh) | $4,751,207 | | $2,911,666 | | — | | $1,974,564 | | ($852,510) | | $165,040 | | $78,739 | | $3,205,374 | | | 2024 (Nunes) | $3,357,889 | | $1,970,264 | | — | | $666,238 | | ($2,309,005) | | $461,701 | | $125,369 | | $331,928 | | | 2023 | $6,285,716 | | $3,786,040 | | — | | $3,709,528 | | $176,590 | | ($801,783) | | $162,237 | | $5,746,248 | | | 2022 | $5,751,241 | | $3,337,902 | | — | | $2,727,867 | | ($1,270,246) | | $649,325 | | $157,012 | | $4,677,297 | | | 2021 | $5,316,481 | | $2,735,312 | | — | | $3,377,761 | | $3,284,367 | | $32,246 | | $140,922 | | $9,416,465 | | | Other NEOs | | 2025 | $2,014,782 | | $844,223 | | — | | $587,892 | | ($261,564) | | $26,541 | | $113,424 | | $1,636,852 | | | 2024 | $1,731,472 | | $778,060 | | — | | $527,646 | | ($355,417) | | $63,702 | | $26,800 | | $1,216,143 | | | 2023 | $1,930,903 | | $893,213 | | $93,329 | | $875,162 | | $37,866 | | ($172,494) | | $35,825 | | $1,720,720 | | | 2022 | $1,636,262 | | $743,195 | | — | | $607,369 | | ($268,765) | | $131,238 | | $33,192 | | $1,396,101 | | | 2021 | $1,532,344 | | $587,060 | | — | | $724,944 | | $685,016 | | $6,725 | | $28,876 | | $2,390,845 | |
|
|
|
|
|
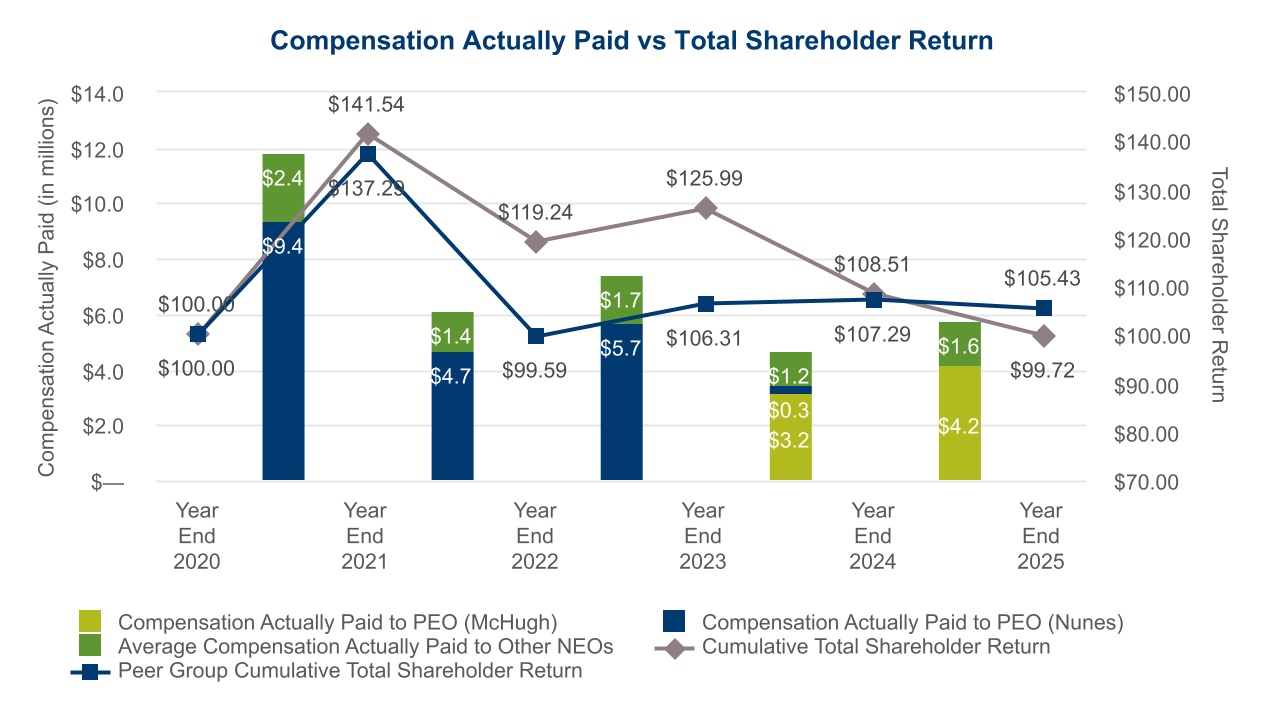
| Compensation Actually Paid vs. Total Shareholder Return |
The following chart reflects the relationship between our NEO compensation actually paid, calculated in accordance with Item 402(v) of Regulation S-K, versus the performance of Rayonier’s common shares (assuming reinvestment of dividends). The chart also compares the performance of Rayonier's common shares with that of the FTSE NAREIT All Equity REIT Index.
|
|
|
|
|
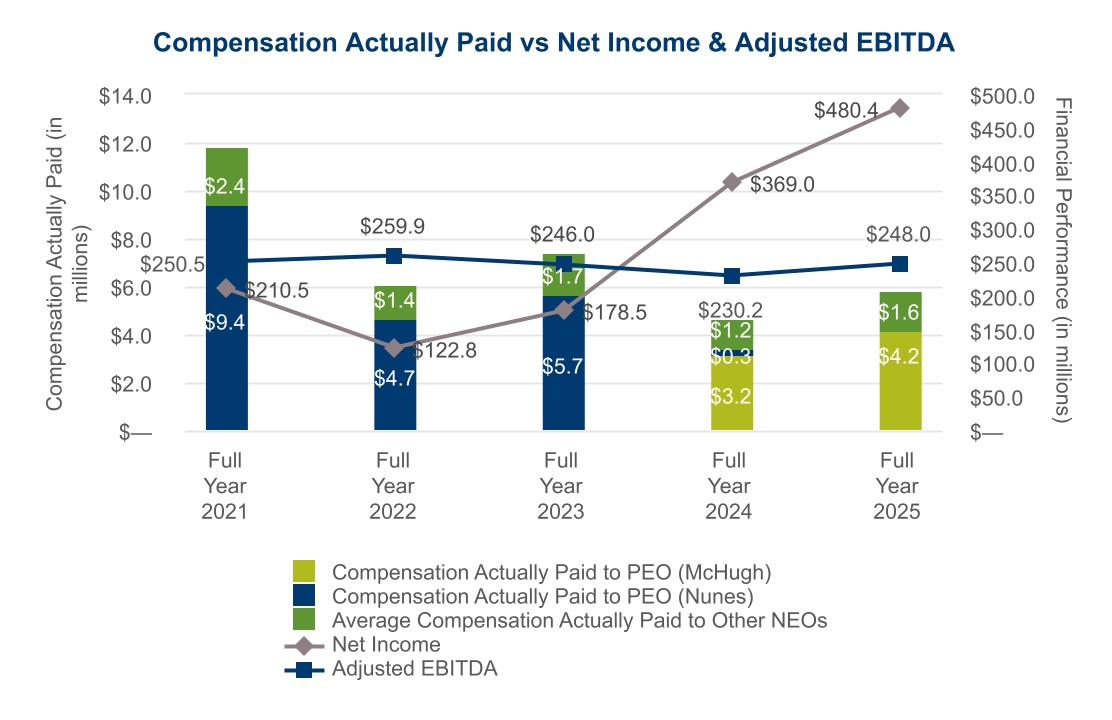
| Compensation Actually Paid vs. Net Income |
The following chart reflects the relationship between our NEO compensation actually paid, calculated in accordance with Item 402(v) of Regulation S-K, versus our Adjusted EBITDA and Net Income performance.
|
|
|
|
|
| Compensation Actually Paid vs. Company Selected Measure |
The following chart reflects the relationship between our NEO compensation actually paid, calculated in accordance with Item 402(v) of Regulation S-K, versus our Adjusted EBITDA and Net Income performance.
|
|
|
|
|
| Total Shareholder Return Vs Peer Group |
The following chart reflects the relationship between our NEO compensation actually paid, calculated in accordance with Item 402(v) of Regulation S-K, versus the performance of Rayonier’s common shares (assuming reinvestment of dividends). The chart also compares the performance of Rayonier's common shares with that of the FTSE NAREIT All Equity REIT Index.
|
|
|
|
|
| Total Shareholder Return Amount |
$ 99.72
|
108.51
|
125.99
|
119.24
|
141.54
|
| Peer Group Total Shareholder Return Amount |
105.43
|
107.29
|
106.31
|
99.59
|
137.29
|
| Net Income (Loss), Including Portion Attributable to Noncontrolling Interest |
$ 480,400,000
|
$ 369,000,000.0
|
$ 178,500,000
|
$ 122,800,000
|
$ 210,500,000
|
| Company Selected Measure Amount |
248,000,000.0
|
230,200,000
|
246,000,000.0
|
259,900,000
|
250,500,000
|
| PEO Name |
Mr. McHugh
|
|
Mr. Nunes
|
Mr. Nunes
|
Mr. Nunes
|
| Measure:: 1 |
|
|
|
|
|
| Pay vs Performance Disclosure |
|
|
|
|
|
| Name |
Adjusted EBITDA
|
|
|
|
|
| Non-GAAP Measure Description |
Adjusted EBITDA is defined as earnings before interest, taxes, depreciation, depletion, amortization, the non-cash cost of land and improved development, non-operating expense and income, income from operations of discontinued operations, gain on sale of discontinued operations, costs related to the merger with PotlatchDeltic, asset impairment charges, restructuring charges, costs related to disposition initiatives and Large Dispositions.
|
|
|
|
|
| Measure:: 2 |
|
|
|
|
|
| Pay vs Performance Disclosure |
|
|
|
|
|
| Name |
Relative Total Shareholder Return
|
|
|
|
|
| McHugh [Member] |
|
|
|
|
|
| Pay vs Performance Disclosure |
|
|
|
|
|
| PEO Total Compensation Amount |
$ 5,457,716
|
$ 4,751,207
|
|
|
|
| PEO Actually Paid Compensation Amount |
4,170,523
|
$ 3,205,374
|
|
|
|
| PEO Name |
|
Mr. McHugh
|
|
|
|
| Nunes [Member] |
|
|
|
|
|
| Pay vs Performance Disclosure |
|
|
|
|
|
| PEO Total Compensation Amount |
|
$ 3,357,889
|
$ 6,285,716
|
$ 5,751,241
|
$ 5,316,481
|
| PEO Actually Paid Compensation Amount |
|
$ 331,928
|
5,746,248
|
4,677,297
|
9,416,465
|
| PEO Name |
|
Mr. Nunes
|
|
|
|
| PEO | McHugh [Member] | Aggregate Pension Adjustments Service Cost |
|
|
|
|
|
| Pay vs Performance Disclosure |
|
|
|
|
|
| Adjustment to Compensation, Amount |
0
|
$ 0
|
|
|
|
| PEO | McHugh [Member] | Aggregate Grant Date Fair Value of Equity Award Amounts Reported in Summary Compensation Table |
|
|
|
|
|
| Pay vs Performance Disclosure |
|
|
|
|
|
| Adjustment to Compensation, Amount |
(3,058,120)
|
(2,911,666)
|
|
|
|
| PEO | McHugh [Member] | Year-end Fair Value of Equity Awards Granted in Covered Year that are Outstanding and Unvested |
|
|
|
|
|
| Pay vs Performance Disclosure |
|
|
|
|
|
| Adjustment to Compensation, Amount |
2,129,585
|
1,974,564
|
|
|
|
| PEO | McHugh [Member] | Year-over-Year Change in Fair Value of Equity Awards Granted in Prior Years That are Outstanding and Unvested |
|
|
|
|
|
| Pay vs Performance Disclosure |
|
|
|
|
|
| Adjustment to Compensation, Amount |
(802,609)
|
(852,510)
|
|
|
|
| PEO | McHugh [Member] | Change in Fair Value as of Vesting Date of Prior Year Equity Awards Vested in Covered Year |
|
|
|
|
|
| Pay vs Performance Disclosure |
|
|
|
|
|
| Adjustment to Compensation, Amount |
75,167
|
165,040
|
|
|
|
| PEO | McHugh [Member] | Dividends or Other Earnings Paid on Equity Awards not Otherwise Reflected in Total Compensation for Covered Year |
|
|
|
|
|
| Pay vs Performance Disclosure |
|
|
|
|
|
| Adjustment to Compensation, Amount |
368,784
|
78,739
|
|
|
|
| PEO | Nunes [Member] | Aggregate Pension Adjustments Service Cost |
|
|
|
|
|
| Pay vs Performance Disclosure |
|
|
|
|
|
| Adjustment to Compensation, Amount |
|
0
|
0
|
0
|
0
|
| PEO | Nunes [Member] | Aggregate Grant Date Fair Value of Equity Award Amounts Reported in Summary Compensation Table |
|
|
|
|
|
| Pay vs Performance Disclosure |
|
|
|
|
|
| Adjustment to Compensation, Amount |
|
(1,970,264)
|
(3,786,040)
|
(3,337,902)
|
(2,735,312)
|
| PEO | Nunes [Member] | Year-end Fair Value of Equity Awards Granted in Covered Year that are Outstanding and Unvested |
|
|
|
|
|
| Pay vs Performance Disclosure |
|
|
|
|
|
| Adjustment to Compensation, Amount |
|
666,238
|
3,709,528
|
2,727,867
|
3,377,761
|
| PEO | Nunes [Member] | Year-over-Year Change in Fair Value of Equity Awards Granted in Prior Years That are Outstanding and Unvested |
|
|
|
|
|
| Pay vs Performance Disclosure |
|
|
|
|
|
| Adjustment to Compensation, Amount |
|
(2,309,005)
|
176,590
|
(1,270,246)
|
3,284,367
|
| PEO | Nunes [Member] | Change in Fair Value as of Vesting Date of Prior Year Equity Awards Vested in Covered Year |
|
|
|
|
|
| Pay vs Performance Disclosure |
|
|
|
|
|
| Adjustment to Compensation, Amount |
|
461,701
|
(801,783)
|
649,325
|
32,246
|
| PEO | Nunes [Member] | Dividends or Other Earnings Paid on Equity Awards not Otherwise Reflected in Total Compensation for Covered Year |
|
|
|
|
|
| Pay vs Performance Disclosure |
|
|
|
|
|
| Adjustment to Compensation, Amount |
|
125,369
|
162,237
|
157,012
|
140,922
|
| Non-PEO NEO | Aggregate Pension Adjustments Service Cost |
|
|
|
|
|
| Pay vs Performance Disclosure |
|
|
|
|
|
| Adjustment to Compensation, Amount |
0
|
0
|
(93,329)
|
0
|
0
|
| Non-PEO NEO | Aggregate Grant Date Fair Value of Equity Award Amounts Reported in Summary Compensation Table |
|
|
|
|
|
| Pay vs Performance Disclosure |
|
|
|
|
|
| Adjustment to Compensation, Amount |
(844,223)
|
(778,060)
|
(893,213)
|
(743,195)
|
(587,060)
|
| Non-PEO NEO | Year-end Fair Value of Equity Awards Granted in Covered Year that are Outstanding and Unvested |
|
|
|
|
|
| Pay vs Performance Disclosure |
|
|
|
|
|
| Adjustment to Compensation, Amount |
587,892
|
527,646
|
875,162
|
607,369
|
724,944
|
| Non-PEO NEO | Year-over-Year Change in Fair Value of Equity Awards Granted in Prior Years That are Outstanding and Unvested |
|
|
|
|
|
| Pay vs Performance Disclosure |
|
|
|
|
|
| Adjustment to Compensation, Amount |
(261,564)
|
(355,417)
|
37,866
|
(268,765)
|
685,016
|
| Non-PEO NEO | Change in Fair Value as of Vesting Date of Prior Year Equity Awards Vested in Covered Year |
|
|
|
|
|
| Pay vs Performance Disclosure |
|
|
|
|
|
| Adjustment to Compensation, Amount |
26,541
|
63,702
|
(172,494)
|
131,238
|
6,725
|
| Non-PEO NEO | Dividends or Other Earnings Paid on Equity Awards not Otherwise Reflected in Total Compensation for Covered Year |
|
|
|
|
|
| Pay vs Performance Disclosure |
|
|
|
|
|
| Adjustment to Compensation, Amount |
$ 113,424
|
$ 26,800
|
$ 35,825
|
$ 33,192
|
$ 28,876
|