Shareholder Report
|
12 Months Ended |
|
Jan. 31, 2026
USD ($)
Holding
|
Jan. 31, 2025 |
| Shareholder Report [Line Items] |
|
|
| Document Type |
N-CSR
|
|
| Amendment Flag |
false
|
|
| Registrant Name |
AMERICAN BEACON FUNDS
|
|
| Entity Central Index Key |
0000809593
|
|
| Entity Investment Company Type |
N-1A
|
|
| Document Period End Date |
Jan. 31, 2026
|
|
| Shareholder Report Annual or Semi-Annual |
Annual Shareholder Report
|
|
| C000136710 |
|
|
| Shareholder Report [Line Items] |
|
|
| Fund Name |
Developing World Income Fund
|
|
| Class Name |
A
|
|
| Trading Symbol |
AGUAX
|
|
| Annual or Semi-Annual Statement [Text Block] |
This annual shareholder report contains important information about American Beacon Developing World Income Fund for the period of February 1, 2025 to January 31, 2026.
|
|
| Additional Information [Text Block] |
You can find additional information about the Fund at www.americanbeaconfunds.com/fund-resources/. You can request this information by contacting us at 800-658-5811.
|
|
| Material Fund Change Notice [Text Block] |
This report describes material changes to the Fund that occurred during the reporting period.
|
|
| Additional Information Phone Number |
800-658-5811
|
|
| Additional Information Website |
www.americanbeaconfunds.com/fund-resources/
|
|
| Expenses [Text Block] |
What were the Fund costs for the last year?(based on a hypothetical $10,000 investment)
Table Summary
Class Name |
Costs of a $10,000 investment |
Costs paid as a percentage of a $10,000 investment |
Class A |
$147 |
1.34% | |
|
| Expenses Paid, Amount |
$ 147
|
|
| Expense Ratio, Percent |
1.34%
|
|
| Factors Affecting Performance [Text Block] |
How did the Fund perform and what affected its performance? The A Class of the Fund returned 13.77% (with sales charges) and 19.46% (without sales charges) for the twelve months ended January 31, 2026, compared to the Bloomberg Global-Aggregate Total Return Index Value Hedged USD return of 4.71% and the JPMorgan EMBI Global Diversified Index return of 13.45%. • Developing market debt benefited from easing global monetary conditions over the period, supported by U.S. dollar weakness and the Federal Reserve’s resumption of rate cuts in the second half, while geopolitical and trade‑policy risks were largely concentrated in developed markets. • The Fund’s diversified strategy across local‑ and hard‑currency developing market debt, informed by a combination of top‑down macro views and bottom‑up country analysis, was strong during the period. • Positive absolute contribution to performance was driven by country exposures, with positions in Zambia, Egypt, Nigeria, Ghana, and Kenya among the largest contributors, while exposure to Senegal detracted during the period. |
|
| Performance Past Does Not Indicate Future [Text] |
Performance shown is historical and is not indicative of future returns.
|
|
| Line Graph [Table Text Block] |
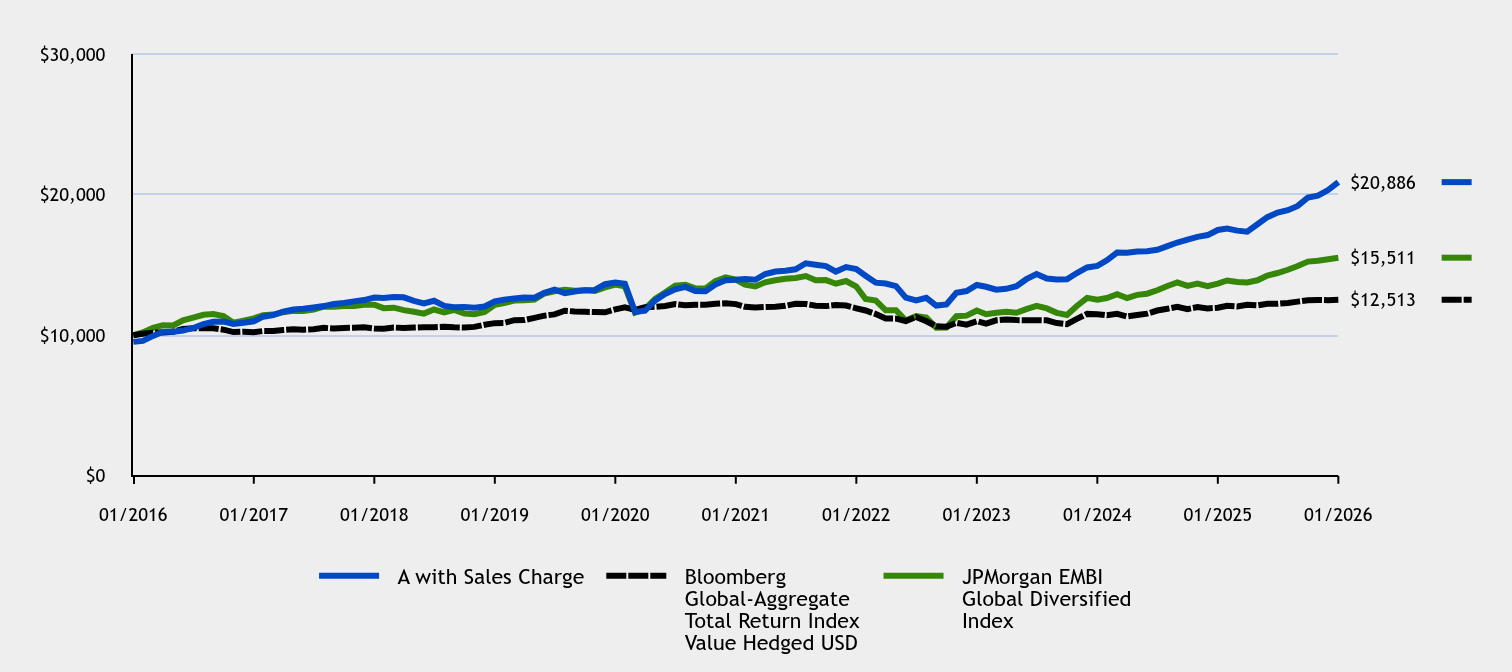
Table Summary
|
A with Sales Charge |
Bloomberg Global-Aggregate Total Return Index Value Hedged USD |
JPMorgan EMBI Global Diversified Index |
01/2016 |
$9,523 |
$10,000 |
$10,000 |
02/2016 |
$9,594 |
$10,096 |
$10,191 |
03/2016 |
$9,947 |
$10,179 |
$10,523 |
04/2016 |
$10,244 |
$10,197 |
$10,710 |
05/2016 |
$10,246 |
$10,240 |
$10,691 |
06/2016 |
$10,328 |
$10,435 |
$11,051 |
07/2016 |
$10,513 |
$10,497 |
$11,250 |
08/2016 |
$10,781 |
$10,492 |
$11,452 |
09/2016 |
$10,950 |
$10,490 |
$11,498 |
10/2016 |
$10,970 |
$10,389 |
$11,355 |
11/2016 |
$10,802 |
$10,217 |
$10,891 |
12/2016 |
$10,883 |
$10,245 |
$11,035 |
01/2017 |
$10,985 |
$10,208 |
$11,195 |
02/2017 |
$11,315 |
$10,295 |
$11,419 |
03/2017 |
$11,433 |
$10,290 |
$11,462 |
04/2017 |
$11,678 |
$10,360 |
$11,633 |
05/2017 |
$11,818 |
$10,421 |
$11,736 |
06/2017 |
$11,873 |
$10,391 |
$11,719 |
07/2017 |
$11,971 |
$10,426 |
$11,817 |
08/2017 |
$12,070 |
$10,521 |
$12,026 |
09/2017 |
$12,222 |
$10,472 |
$12,028 |
10/2017 |
$12,291 |
$10,516 |
$12,072 |
11/2017 |
$12,403 |
$10,532 |
$12,078 |
12/2017 |
$12,496 |
$10,556 |
$12,167 |
01/2018 |
$12,676 |
$10,481 |
$12,162 |
02/2018 |
$12,642 |
$10,457 |
$11,920 |
03/2018 |
$12,712 |
$10,544 |
$11,955 |
04/2018 |
$12,690 |
$10,504 |
$11,781 |
05/2018 |
$12,442 |
$10,544 |
$11,670 |
06/2018 |
$12,264 |
$10,563 |
$11,531 |
07/2018 |
$12,448 |
$10,566 |
$11,826 |
08/2018 |
$12,082 |
$10,599 |
$11,621 |
09/2018 |
$11,991 |
$10,558 |
$11,797 |
10/2018 |
$12,011 |
$10,538 |
$11,543 |
11/2018 |
$11,957 |
$10,589 |
$11,494 |
12/2018 |
$12,038 |
$10,742 |
$11,649 |
01/2019 |
$12,411 |
$10,856 |
$12,163 |
02/2019 |
$12,528 |
$10,869 |
$12,284 |
03/2019 |
$12,601 |
$11,064 |
$12,459 |
04/2019 |
$12,675 |
$11,070 |
$12,489 |
05/2019 |
$12,666 |
$11,229 |
$12,540 |
06/2019 |
$13,017 |
$11,387 |
$12,967 |
07/2019 |
$13,233 |
$11,477 |
$13,124 |
08/2019 |
$12,985 |
$11,737 |
$13,222 |
09/2019 |
$13,105 |
$11,682 |
$13,162 |
10/2019 |
$13,203 |
$11,662 |
$13,199 |
11/2019 |
$13,216 |
$11,649 |
$13,136 |
12/2019 |
$13,623 |
$11,625 |
$13,400 |
01/2020 |
$13,747 |
$11,834 |
$13,604 |
02/2020 |
$13,662 |
$11,979 |
$13,473 |
03/2020 |
$11,647 |
$11,793 |
$11,607 |
04/2020 |
$11,736 |
$11,984 |
$11,868 |
05/2020 |
$12,475 |
$12,018 |
$12,588 |
06/2020 |
$12,931 |
$12,078 |
$13,030 |
07/2020 |
$13,263 |
$12,210 |
$13,514 |
08/2020 |
$13,430 |
$12,121 |
$13,583 |
09/2020 |
$13,139 |
$12,165 |
$13,332 |
10/2020 |
$13,130 |
$12,166 |
$13,328 |
11/2020 |
$13,596 |
$12,236 |
$13,842 |
12/2020 |
$13,903 |
$12,273 |
$14,105 |
01/2021 |
$13,936 |
$12,208 |
$13,952 |
02/2021 |
$13,997 |
$12,018 |
$13,596 |
03/2021 |
$13,938 |
$11,970 |
$13,465 |
04/2021 |
$14,353 |
$12,002 |
$13,763 |
05/2021 |
$14,531 |
$12,028 |
$13,909 |
06/2021 |
$14,589 |
$12,087 |
$14,011 |
07/2021 |
$14,682 |
$12,237 |
$14,070 |
08/2021 |
$15,115 |
$12,213 |
$14,208 |
09/2021 |
$15,011 |
$12,097 |
$13,913 |
10/2021 |
$14,914 |
$12,066 |
$13,916 |
11/2021 |
$14,524 |
$12,152 |
$13,660 |
12/2021 |
$14,840 |
$12,103 |
$13,852 |
01/2022 |
$14,696 |
$11,912 |
$13,458 |
02/2022 |
$14,229 |
$11,754 |
$12,577 |
03/2022 |
$13,735 |
$11,501 |
$12,464 |
04/2022 |
$13,673 |
$11,192 |
$11,767 |
05/2022 |
$13,490 |
$11,176 |
$11,770 |
06/2022 |
$12,671 |
$11,007 |
$11,038 |
07/2022 |
$12,466 |
$11,287 |
$11,358 |
08/2022 |
$12,657 |
$10,992 |
$11,250 |
09/2022 |
$12,106 |
$10,639 |
$10,534 |
10/2022 |
$12,181 |
$10,603 |
$10,550 |
11/2022 |
$13,010 |
$10,873 |
$11,351 |
12/2022 |
$13,137 |
$10,745 |
$11,388 |
01/2023 |
$13,569 |
$10,992 |
$11,749 |
02/2023 |
$13,444 |
$10,817 |
$11,490 |
03/2023 |
$13,237 |
$11,057 |
$11,600 |
04/2023 |
$13,299 |
$11,114 |
$11,662 |
05/2023 |
$13,489 |
$11,070 |
$11,595 |
06/2023 |
$13,981 |
$11,063 |
$11,854 |
07/2023 |
$14,350 |
$11,067 |
$12,081 |
08/2023 |
$14,034 |
$11,053 |
$11,899 |
09/2023 |
$13,952 |
$10,862 |
$11,589 |
10/2023 |
$13,968 |
$10,785 |
$11,432 |
11/2023 |
$14,420 |
$11,156 |
$12,080 |
12/2023 |
$14,815 |
$11,513 |
$12,651 |
01/2024 |
$14,923 |
$11,490 |
$12,522 |
02/2024 |
$15,321 |
$11,411 |
$12,645 |
03/2024 |
$15,871 |
$11,514 |
$12,909 |
04/2024 |
$15,857 |
$11,329 |
$12,641 |
05/2024 |
$15,953 |
$11,429 |
$12,869 |
06/2024 |
$15,963 |
$11,528 |
$12,948 |
07/2024 |
$16,069 |
$11,751 |
$13,190 |
08/2024 |
$16,336 |
$11,880 |
$13,496 |
09/2024 |
$16,588 |
$12,017 |
$13,745 |
10/2024 |
$16,789 |
$11,855 |
$13,509 |
11/2024 |
$16,994 |
$11,996 |
$13,670 |
12/2024 |
$17,119 |
$11,904 |
$13,478 |
01/2025 |
$17,483 |
$11,950 |
$13,672 |
02/2025 |
$17,584 |
$12,094 |
$13,887 |
03/2025 |
$17,435 |
$12,043 |
$13,781 |
04/2025 |
$17,363 |
$12,162 |
$13,750 |
05/2025 |
$17,886 |
$12,122 |
$13,904 |
06/2025 |
$18,392 |
$12,238 |
$14,239 |
07/2025 |
$18,720 |
$12,228 |
$14,420 |
08/2025 |
$18,888 |
$12,295 |
$14,654 |
09/2025 |
$19,194 |
$12,385 |
$14,915 |
10/2025 |
$19,791 |
$12,483 |
$15,233 |
11/2025 |
$19,928 |
$12,509 |
$15,296 |
12/2025 |
$20,322 |
$12,483 |
$15,406 |
01/2026 |
$20,886 |
$12,513 |
$15,511 |
|
|
| Average Annual Return [Table Text Block] |
Table Summary
Average Annual Total Returns (%) |
1 Year |
5 Years |
10 Years |
Class A without Sales ChargeFootnote Reference1 |
19.46% |
8.43% |
8.17% |
Class A with Maximum Sales Charge - 4.75%Footnote Reference1 |
13.77% |
7.37% |
7.64% |
Bloomberg Global-Aggregate Total Return Index Value Hedged USD |
4.71% |
0.50% |
2.27% |
JPMorgan EMBI Global Diversified Index |
13.45% |
2.14% |
4.49% | |
|
| No Deduction of Taxes [Text Block] |
The graph and table do not reflect the deduction of taxes that a shareholder would pay on fund distributions or redemption of fund shares.
|
|
| Material Change Date |
|
Jan. 31, 2025
|
| AssetsNet |
$ 1,689,197,853
|
|
| Holdings Count | Holding |
365
|
|
| Advisory Fees Paid, Amount |
$ 8,775,118
|
|
| InvestmentCompanyPortfolioTurnover |
34.00%
|
|
| Additional Fund Statistics [Text Block] |
Table Summary
Total Net Assets |
$1,689,197,853 |
# of Portfolio Holdings |
365 |
Portfolio Turnover Rate |
34% |
Total Management Fees Paid |
$8,775,118 | |
|
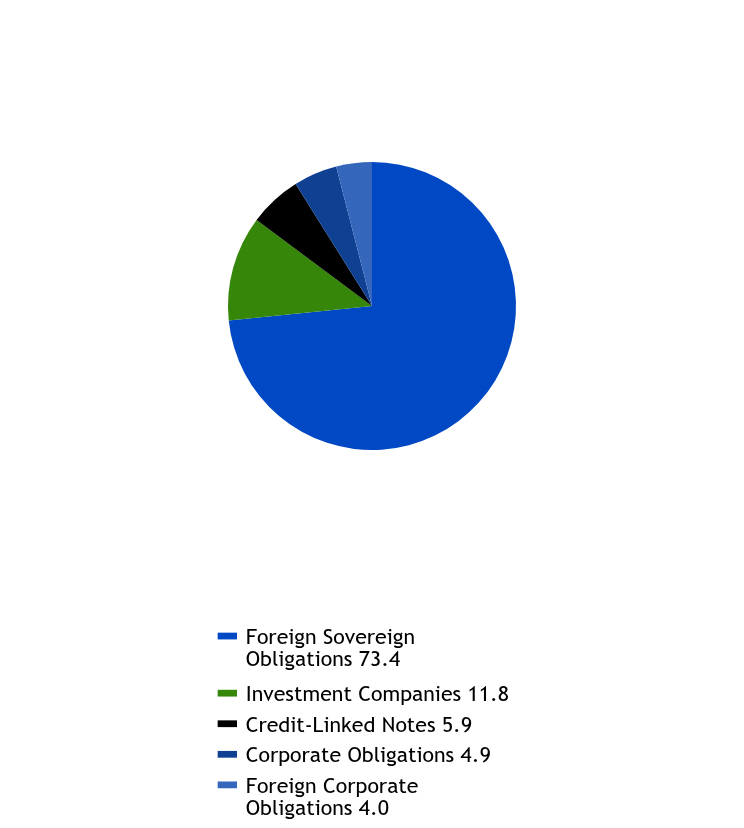
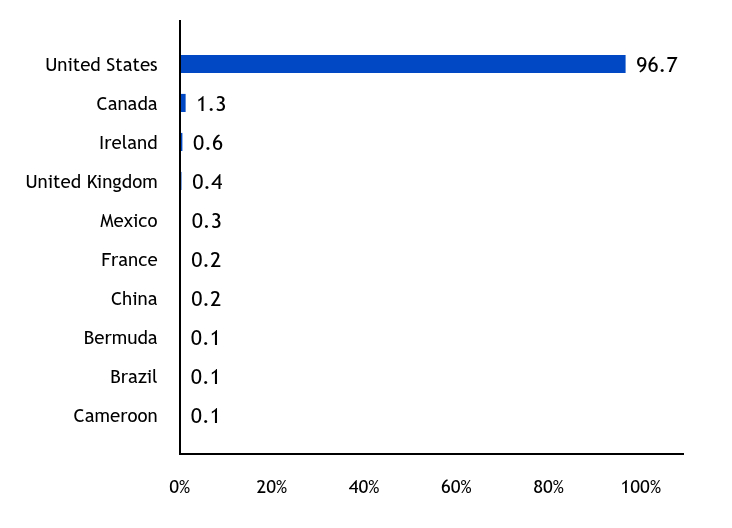
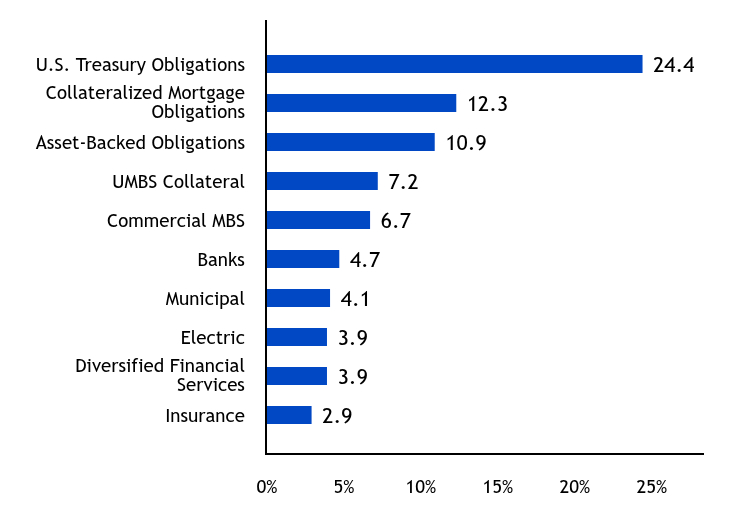
| Holdings [Text Block] |
Asset Allocation - % Investments
Table Summary
Value |
Value |
Foreign Sovereign Obligations |
73.4 |
Investment Companies |
11.8 |
Credit-Linked Notes |
5.9 |
Corporate Obligations |
4.9 |
Foreign Corporate Obligations |
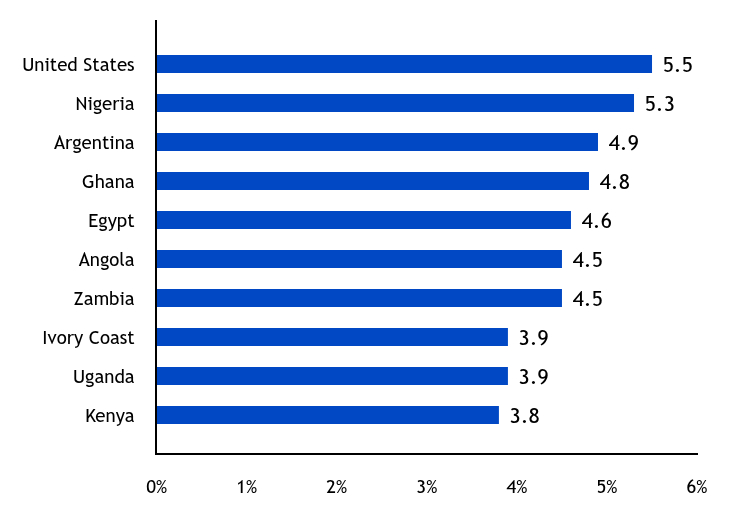
4.0 | Excludes foreign currency derivatives. Top Ten Country Exposure - % Fixed Income
Table Summary
Value |
Value |
Kenya |
3.8 |
Uganda |
3.9 |
Ivory Coast |
3.9 |
Zambia |
4.5 |
Angola |
4.5 |
Egypt |
4.6 |
Ghana |
4.8 |
Argentina |
4.9 |
Nigeria |
5.3 |
United States |
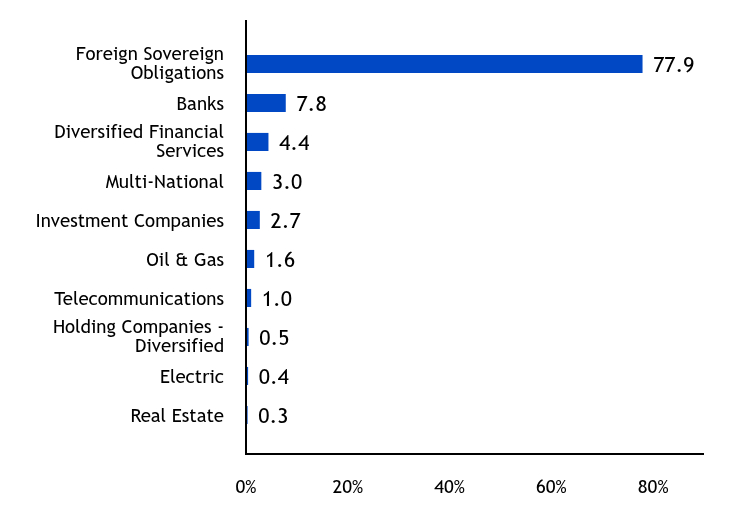
5.5 | Top Ten Industry Allocations - % Fixed Income
Table Summary
Value |
Value |
Real Estate |
0.3 |
Electric |
0.4 |
Holding Companies - Diversified |
0.5 |
Telecommunications |
1.0 |
Oil & Gas |
1.6 |
Investment Companies |
2.7 |
Multi-National |
3.0 |
Diversified Financial Services |
4.4 |
Banks |
7.8 |
Foreign Sovereign Obligations |
77.9 | |
|
| Largest Holdings [Text Block] |
Top Ten Holdings - % Net Assets
Table Summary
Suriname Government International Bonds, 8.500%, Due 11/6/2035 |
1.8 |
Ghana Government International Bonds, 5.000%, Due 7/3/2035 |
1.7 |
Argentina Republic Government International Bonds, 4.125%, Due 7/9/2035 |
1.7 |
Republic of Kenya Infrastructure Bonds, 18.461%, Due 8/9/2032 |
1.5 |
Congolese International Bonds, 9.875%, Due 11/7/2032 |
1.3 |
Kyrgyz Republic International Bonds, 7.750%, Due 6/3/2030 |
1.3 |
Ecuador Government International Bonds, 5.000%, Due 7/31/2040 |
1.3 |
Argentina Republic Government International Bonds, 0.750%, Due 7/9/2030 |
1.3 |
Mozambique International Bonds, 9.000%, Due 9/15/2031 |
1.3 |
Ecuador Government International Bonds, 8.750%, Due 1/29/2034 |
1.2 | Excludes cash equivalents. |
|
| Material Fund Change [Text Block] |
This is a summary of certain changes to the Fund since January 31, 2025. For more complete information, you may review the Fund's next prospectus, which we expect to be available by June 1, 2026 at www.americanbeaconfunds.com/fund-resources/ or upon request at 800-658-5811. The Board of Trustees (“Board”) of the American Beacon Funds (the “Trust”), upon the recommendation of American Beacon Advisors, Inc. (“AmBeacon”), has approved the appointment of Ninety One North America, Inc. (“Ninety One NA”) as an additional sub-advisor to the American Beacon Developing World Income Fund (the “Fund”) and a new investment advisory agreement among AmBeacon, Ninety One NA and the Trust, on behalf of the Fund. Ninety One NA is appointed as a sub-advisor to the Fund effective November 12, 2025. AmBeacon currently expects to commence the allocation of a portion of the assets of the Fund to Ninety One NA on or about February 2, 2026. |
|
| Material Fund Change Adviser [Text Block] |
The Board of Trustees (“Board”) of the American Beacon Funds (the “Trust”), upon the recommendation of American Beacon Advisors, Inc. (“AmBeacon”), has approved the appointment of Ninety One North America, Inc. (“Ninety One NA”) as an additional sub-advisor to the American Beacon Developing World Income Fund (the “Fund”) and a new investment advisory agreement among AmBeacon, Ninety One NA and the Trust, on behalf of the Fund. Ninety One NA is appointed as a sub-advisor to the Fund effective November 12, 2025. AmBeacon currently expects to commence the allocation of a portion of the assets of the Fund to Ninety One NA on or about February 2, 2026.
|
|
| Summary of Change Legend [Text Block] |
This is a summary of certain changes to the Fund since January 31, 2025. For more complete information, you may review the Fund's next prospectus, which we expect to be available by June 1, 2026 at www.americanbeaconfunds.com/fund-resources/ or upon request at 800-658-5811.
|
This is a summary of certain changes to the Fund since January 31, 2025.
|
| C000136711 |
|
|
| Shareholder Report [Line Items] |
|
|
| Fund Name |
Developing World Income Fund
|
|
| Class Name |
C
|
|
| Trading Symbol |
AGECX
|
|
| Annual or Semi-Annual Statement [Text Block] |
This annual shareholder report contains important information about American Beacon Developing World Income Fund for the period of February 1, 2025 to January 31, 2026.
|
|
| Additional Information [Text Block] |
You can find additional information about the Fund at www.americanbeaconfunds.com/fund-resources/. You can request this information by contacting us at 800-658-5811.
|
|
| Material Fund Change Notice [Text Block] |
This report describes material changes to the Fund that occurred during the reporting period.
|
|
| Additional Information Phone Number |
800-658-5811
|
|
| Additional Information Website |
www.americanbeaconfunds.com/fund-resources/
|
|
| Expenses [Text Block] |
What were the Fund costs for the last year?(based on a hypothetical $10,000 investment)
Table Summary
Class Name |
Costs of a $10,000 investment |
Costs paid as a percentage of a $10,000 investment |
Class C |
$226 |
2.07% | |
|
| Expenses Paid, Amount |
$ 226
|
|
| Expense Ratio, Percent |
2.07%
|
|
| Factors Affecting Performance [Text Block] |
How did the Fund perform and what affected its performance? The C Class of the Fund returned 17.58% (with sales charges) and 18.58% (without sales charges) for the twelve months ended January 31, 2026, compared to the Bloomberg Global-Aggregate Total Return Index Value Hedged USD return of 4.71% and the JPMorgan EMBI Global Diversified Index return of 13.45%. • Developing market debt benefited from easing global monetary conditions over the period, supported by U.S. dollar weakness and the Federal Reserve’s resumption of rate cuts in the second half, while geopolitical and trade‑policy risks were largely concentrated in developed markets. • The Fund’s diversified strategy across local‑ and hard‑currency developing market debt, informed by a combination of top‑down macro views and bottom‑up country analysis, was strong during the period. • Positive absolute contribution to performance was driven by country exposures, with positions in Zambia, Egypt, Nigeria, Ghana, and Kenya among the largest contributors, while exposure to Senegal detracted during the period. |
|
| Performance Past Does Not Indicate Future [Text] |
Performance shown is historical and is not indicative of future returns.
|
|
| Line Graph [Table Text Block] |
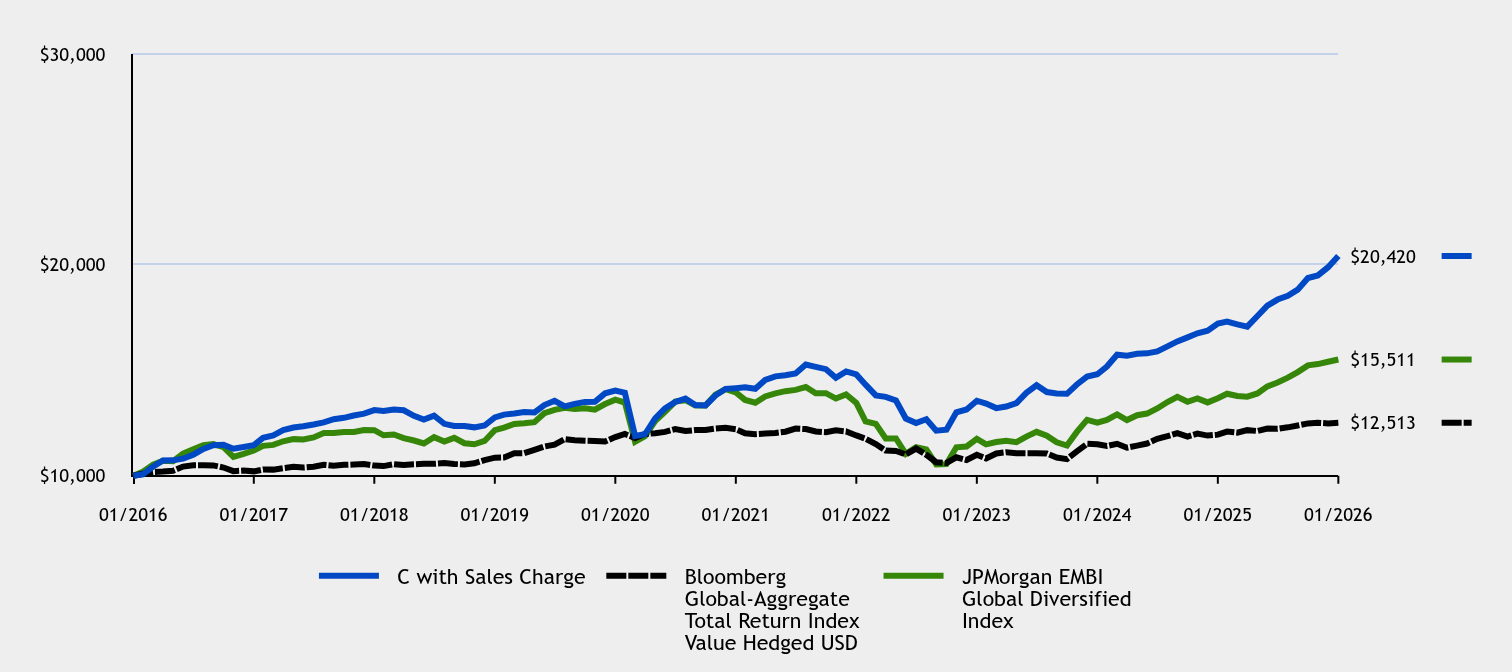
Table Summary
|
C with Sales Charge |
Bloomberg Global-Aggregate Total Return Index Value Hedged USD |
JPMorgan EMBI Global Diversified Index |
01/2016 |
$10,000 |
$10,000 |
$10,000 |
02/2016 |
$10,069 |
$10,096 |
$10,191 |
03/2016 |
$10,428 |
$10,179 |
$10,523 |
04/2016 |
$10,721 |
$10,197 |
$10,710 |
05/2016 |
$10,729 |
$10,240 |
$10,691 |
06/2016 |
$10,808 |
$10,435 |
$11,051 |
07/2016 |
$10,997 |
$10,497 |
$11,250 |
08/2016 |
$11,273 |
$10,492 |
$11,452 |
09/2016 |
$11,448 |
$10,490 |
$11,498 |
10/2016 |
$11,465 |
$10,389 |
$11,355 |
11/2016 |
$11,281 |
$10,217 |
$10,891 |
12/2016 |
$11,364 |
$10,245 |
$11,035 |
01/2017 |
$11,449 |
$10,208 |
$11,195 |
02/2017 |
$11,797 |
$10,295 |
$11,419 |
03/2017 |
$11,914 |
$10,290 |
$11,462 |
04/2017 |
$12,163 |
$10,360 |
$11,633 |
05/2017 |
$12,287 |
$10,421 |
$11,736 |
06/2017 |
$12,350 |
$10,391 |
$11,719 |
07/2017 |
$12,433 |
$10,426 |
$11,817 |
08/2017 |
$12,528 |
$10,521 |
$12,026 |
09/2017 |
$12,679 |
$10,472 |
$12,028 |
10/2017 |
$12,746 |
$10,516 |
$12,072 |
11/2017 |
$12,857 |
$10,532 |
$12,078 |
12/2017 |
$12,947 |
$10,556 |
$12,167 |
01/2018 |
$13,113 |
$10,481 |
$12,162 |
02/2018 |
$13,070 |
$10,457 |
$11,920 |
03/2018 |
$13,136 |
$10,544 |
$11,955 |
04/2018 |
$13,105 |
$10,504 |
$11,781 |
05/2018 |
$12,840 |
$10,544 |
$11,670 |
06/2018 |
$12,663 |
$10,563 |
$11,531 |
07/2018 |
$12,847 |
$10,566 |
$11,826 |
08/2018 |
$12,462 |
$10,599 |
$11,621 |
09/2018 |
$12,360 |
$10,558 |
$11,797 |
10/2018 |
$12,360 |
$10,538 |
$11,543 |
11/2018 |
$12,295 |
$10,589 |
$11,494 |
12/2018 |
$12,383 |
$10,742 |
$11,649 |
01/2019 |
$12,768 |
$10,856 |
$12,163 |
02/2019 |
$12,898 |
$10,869 |
$12,284 |
03/2019 |
$12,951 |
$11,064 |
$12,459 |
04/2019 |
$13,019 |
$11,070 |
$12,489 |
05/2019 |
$13,002 |
$11,229 |
$12,540 |
06/2019 |
$13,351 |
$11,387 |
$12,967 |
07/2019 |
$13,552 |
$11,477 |
$13,124 |
08/2019 |
$13,292 |
$11,737 |
$13,222 |
09/2019 |
$13,406 |
$11,682 |
$13,162 |
10/2019 |
$13,501 |
$11,662 |
$13,199 |
11/2019 |
$13,509 |
$11,649 |
$13,136 |
12/2019 |
$13,909 |
$11,625 |
$13,400 |
01/2020 |
$14,037 |
$11,834 |
$13,604 |
02/2020 |
$13,937 |
$11,979 |
$13,473 |
03/2020 |
$11,882 |
$11,793 |
$11,607 |
04/2020 |
$11,966 |
$11,984 |
$11,868 |
05/2020 |
$12,715 |
$12,018 |
$12,588 |
06/2020 |
$13,192 |
$12,078 |
$13,030 |
07/2020 |
$13,496 |
$12,210 |
$13,514 |
08/2020 |
$13,656 |
$12,121 |
$13,583 |
09/2020 |
$13,350 |
$12,165 |
$13,332 |
10/2020 |
$13,335 |
$12,166 |
$13,328 |
11/2020 |
$13,804 |
$12,236 |
$13,842 |
12/2020 |
$14,120 |
$12,273 |
$14,105 |
01/2021 |
$14,154 |
$12,208 |
$13,952 |
02/2021 |
$14,194 |
$12,018 |
$13,596 |
03/2021 |
$14,126 |
$11,970 |
$13,465 |
04/2021 |
$14,541 |
$12,002 |
$13,763 |
05/2021 |
$14,713 |
$12,028 |
$13,909 |
06/2021 |
$14,763 |
$12,087 |
$14,011 |
07/2021 |
$14,847 |
$12,237 |
$14,070 |
08/2021 |
$15,277 |
$12,213 |
$14,208 |
09/2021 |
$15,162 |
$12,097 |
$13,913 |
10/2021 |
$15,054 |
$12,066 |
$13,916 |
11/2021 |
$14,648 |
$12,152 |
$13,660 |
12/2021 |
$14,948 |
$12,103 |
$13,852 |
01/2022 |
$14,802 |
$11,912 |
$13,458 |
02/2022 |
$14,320 |
$11,754 |
$12,577 |
03/2022 |
$13,812 |
$11,501 |
$12,464 |
04/2022 |
$13,741 |
$11,192 |
$11,767 |
05/2022 |
$13,566 |
$11,176 |
$11,770 |
06/2022 |
$12,712 |
$11,007 |
$11,038 |
07/2022 |
$12,496 |
$11,287 |
$11,358 |
08/2022 |
$12,681 |
$10,992 |
$11,250 |
09/2022 |
$12,136 |
$10,639 |
$10,534 |
10/2022 |
$12,185 |
$10,603 |
$10,550 |
11/2022 |
$13,011 |
$10,873 |
$11,351 |
12/2022 |
$13,144 |
$10,745 |
$11,388 |
01/2023 |
$13,557 |
$10,992 |
$11,749 |
02/2023 |
$13,424 |
$10,817 |
$11,490 |
03/2023 |
$13,208 |
$11,057 |
$11,600 |
04/2023 |
$13,282 |
$11,114 |
$11,662 |
05/2023 |
$13,445 |
$11,070 |
$11,595 |
06/2023 |
$13,930 |
$11,063 |
$11,854 |
07/2023 |
$14,292 |
$11,067 |
$12,081 |
08/2023 |
$13,967 |
$11,053 |
$11,899 |
09/2023 |
$13,898 |
$10,862 |
$11,589 |
10/2023 |
$13,884 |
$10,785 |
$11,432 |
11/2023 |
$14,327 |
$11,156 |
$12,080 |
12/2023 |
$14,705 |
$11,513 |
$12,651 |
01/2024 |
$14,813 |
$11,490 |
$12,522 |
02/2024 |
$15,179 |
$11,411 |
$12,645 |
03/2024 |
$15,740 |
$11,514 |
$12,909 |
04/2024 |
$15,695 |
$11,329 |
$12,641 |
05/2024 |
$15,781 |
$11,429 |
$12,869 |
06/2024 |
$15,804 |
$11,528 |
$12,948 |
07/2024 |
$15,899 |
$11,751 |
$13,190 |
08/2024 |
$16,132 |
$11,880 |
$13,496 |
09/2024 |
$16,372 |
$12,017 |
$13,745 |
10/2024 |
$16,561 |
$11,855 |
$13,509 |
11/2024 |
$16,755 |
$11,996 |
$13,670 |
12/2024 |
$16,882 |
$11,904 |
$13,478 |
01/2025 |
$17,219 |
$11,950 |
$13,672 |
02/2025 |
$17,308 |
$12,094 |
$13,887 |
03/2025 |
$17,175 |
$12,043 |
$13,781 |
04/2025 |
$17,070 |
$12,162 |
$13,750 |
05/2025 |
$17,576 |
$12,122 |
$13,904 |
06/2025 |
$18,066 |
$12,238 |
$14,239 |
07/2025 |
$18,355 |
$12,228 |
$14,420 |
08/2025 |
$18,535 |
$12,295 |
$14,654 |
09/2025 |
$18,826 |
$12,385 |
$14,915 |
10/2025 |
$19,377 |
$12,483 |
$15,233 |
11/2025 |
$19,500 |
$12,509 |
$15,296 |
12/2025 |
$19,890 |
$12,483 |
$15,406 |
01/2026 |
$20,420 |
$12,513 |
$15,511 |
|
|
| Average Annual Return [Table Text Block] |
Table Summary
Average Annual Total Returns (%) |
1 Year |
5 Years |
10 Years |
Class C without Deferred Sales ChargeFootnote Reference1 |
18.58% |
7.61% |
7.40% |
Class C with Maximum Deferred Sales Charge -1.00%Footnote Reference1 |
17.58% |
7.61% |
7.40% |
Bloomberg Global-Aggregate Total Return Index Value Hedged USD |
4.71% |
0.50% |
2.27% |
JPMorgan EMBI Global Diversified Index |
13.45% |
2.14% |
4.49% | |
|
| No Deduction of Taxes [Text Block] |
The graph and table do not reflect the deduction of taxes that a shareholder would pay on fund distributions or redemption of fund shares.
|
|
| Material Change Date |
|
Jan. 31, 2025
|
| AssetsNet |
$ 1,689,197,853
|
|
| Holdings Count | Holding |
365
|
|
| Advisory Fees Paid, Amount |
$ 8,775,118
|
|
| InvestmentCompanyPortfolioTurnover |
34.00%
|
|
| Additional Fund Statistics [Text Block] |
Table Summary
Total Net Assets |
$1,689,197,853 |
# of Portfolio Holdings |
365 |
Portfolio Turnover Rate |
34% |
Total Management Fees Paid |
$8,775,118 | |
|
| Holdings [Text Block] |
Asset Allocation - % Investments
Table Summary
Value |
Value |
Foreign Sovereign Obligations |
73.4 |
Investment Companies |
11.8 |
Credit-Linked Notes |
5.9 |
Corporate Obligations |
4.9 |
Foreign Corporate Obligations |
4.0 | Excludes foreign currency derivatives. Top Ten Country Exposure - % Fixed Income
Table Summary
Value |
Value |
Kenya |
3.8 |
Uganda |
3.9 |
Ivory Coast |
3.9 |
Zambia |
4.5 |
Angola |
4.5 |
Egypt |
4.6 |
Ghana |
4.8 |
Argentina |
4.9 |
Nigeria |
5.3 |
United States |
5.5 | Top Ten Industry Allocations - % Fixed Income
Table Summary
Value |
Value |
Real Estate |
0.3 |
Electric |
0.4 |
Holding Companies - Diversified |
0.5 |
Telecommunications |
1.0 |
Oil & Gas |
1.6 |
Investment Companies |
2.7 |
Multi-National |
3.0 |
Diversified Financial Services |
4.4 |
Banks |
7.8 |
Foreign Sovereign Obligations |
77.9 | |
|
| Largest Holdings [Text Block] |
Top Ten Holdings - % Net Assets
Table Summary
Suriname Government International Bonds, 8.500%, Due 11/6/2035 |
1.8 |
Ghana Government International Bonds, 5.000%, Due 7/3/2035 |
1.7 |
Argentina Republic Government International Bonds, 4.125%, Due 7/9/2035 |
1.7 |
Republic of Kenya Infrastructure Bonds, 18.461%, Due 8/9/2032 |
1.5 |
Congolese International Bonds, 9.875%, Due 11/7/2032 |
1.3 |
Kyrgyz Republic International Bonds, 7.750%, Due 6/3/2030 |
1.3 |
Ecuador Government International Bonds, 5.000%, Due 7/31/2040 |
1.3 |
Argentina Republic Government International Bonds, 0.750%, Due 7/9/2030 |
1.3 |
Mozambique International Bonds, 9.000%, Due 9/15/2031 |
1.3 |
Ecuador Government International Bonds, 8.750%, Due 1/29/2034 |
1.2 | Excludes cash equivalents. |
|
| Material Fund Change [Text Block] |
This is a summary of certain changes to the Fund since January 31, 2025. For more complete information, you may review the Fund's next prospectus, which we expect to be available by June 1, 2026 at www.americanbeaconfunds.com/fund-resources/ or upon request at 800-658-5811. The Board of Trustees (“Board”) of the American Beacon Funds (the “Trust”), upon the recommendation of American Beacon Advisors, Inc. (“AmBeacon”), has approved the appointment of Ninety One North America, Inc. (“Ninety One NA”) as an additional sub-advisor to the American Beacon Developing World Income Fund (the “Fund”) and a new investment advisory agreement among AmBeacon, Ninety One NA and the Trust, on behalf of the Fund. Ninety One NA is appointed as a sub-advisor to the Fund effective November 12, 2025. AmBeacon currently expects to commence the allocation of a portion of the assets of the Fund to Ninety One NA on or about February 2, 2026. |
|
| Material Fund Change Adviser [Text Block] |
The Board of Trustees (“Board”) of the American Beacon Funds (the “Trust”), upon the recommendation of American Beacon Advisors, Inc. (“AmBeacon”), has approved the appointment of Ninety One North America, Inc. (“Ninety One NA”) as an additional sub-advisor to the American Beacon Developing World Income Fund (the “Fund”) and a new investment advisory agreement among AmBeacon, Ninety One NA and the Trust, on behalf of the Fund. Ninety One NA is appointed as a sub-advisor to the Fund effective November 12, 2025. AmBeacon currently expects to commence the allocation of a portion of the assets of the Fund to Ninety One NA on or about February 2, 2026.
|
|
| Summary of Change Legend [Text Block] |
This is a summary of certain changes to the Fund since January 31, 2025. For more complete information, you may review the Fund's next prospectus, which we expect to be available by June 1, 2026 at www.americanbeaconfunds.com/fund-resources/ or upon request at 800-658-5811.
|
This is a summary of certain changes to the Fund since January 31, 2025.
|
| C000136713 |
|
|
| Shareholder Report [Line Items] |
|
|
| Fund Name |
Developing World Income Fund
|
|
| Class Name |
Investor
|
|
| Trading Symbol |
AGEPX
|
|
| Annual or Semi-Annual Statement [Text Block] |
This annual shareholder report contains important information about American Beacon Developing World Income Fund for the period of February 1, 2025 to January 31, 2026.
|
|
| Additional Information [Text Block] |
You can find additional information about the Fund at www.americanbeaconfunds.com/fund-resources/. You can request this information by contacting us at 800-658-5811.
|
|
| Material Fund Change Notice [Text Block] |
This report describes material changes to the Fund that occurred during the reporting period.
|
|
| Additional Information Phone Number |
800-658-5811
|
|
| Additional Information Website |
www.americanbeaconfunds.com/fund-resources/
|
|
| Expenses [Text Block] |
What were the Fund costs for the last year?(based on a hypothetical $10,000 investment)
Table Summary
Class Name |
Costs of a $10,000 investment |
Costs paid as a percentage of a $10,000 investment |
Investor |
$143 |
1.31% | |
|
| Expenses Paid, Amount |
$ 143
|
|
| Expense Ratio, Percent |
1.31%
|
|
| Factors Affecting Performance [Text Block] |
How did the Fund perform and what affected its performance? The Investor Class of the Fund returned 19.52% for the twelve months ended January 31, 2026, compared to the Bloomberg Global-Aggregate Total Return Index Value Hedged USD return of 4.71% and the JPMorgan EMBI Global Diversified Index return of 13.45%. • Developing market debt benefited from easing global monetary conditions over the period, supported by U.S. dollar weakness and the Federal Reserve’s resumption of rate cuts in the second half, while geopolitical and trade‑policy risks were largely concentrated in developed markets. • The Fund’s diversified strategy across local‑ and hard‑currency developing market debt, informed by a combination of top‑down macro views and bottom‑up country analysis, was strong during the period. • Positive absolute contribution to performance was driven by country exposures, with positions in Zambia, Egypt, Nigeria, Ghana, and Kenya among the largest contributors, while exposure to Senegal detracted during the period. |
|
| Performance Past Does Not Indicate Future [Text] |
Performance shown is historical and is not indicative of future returns.
|
|
| Line Graph [Table Text Block] |
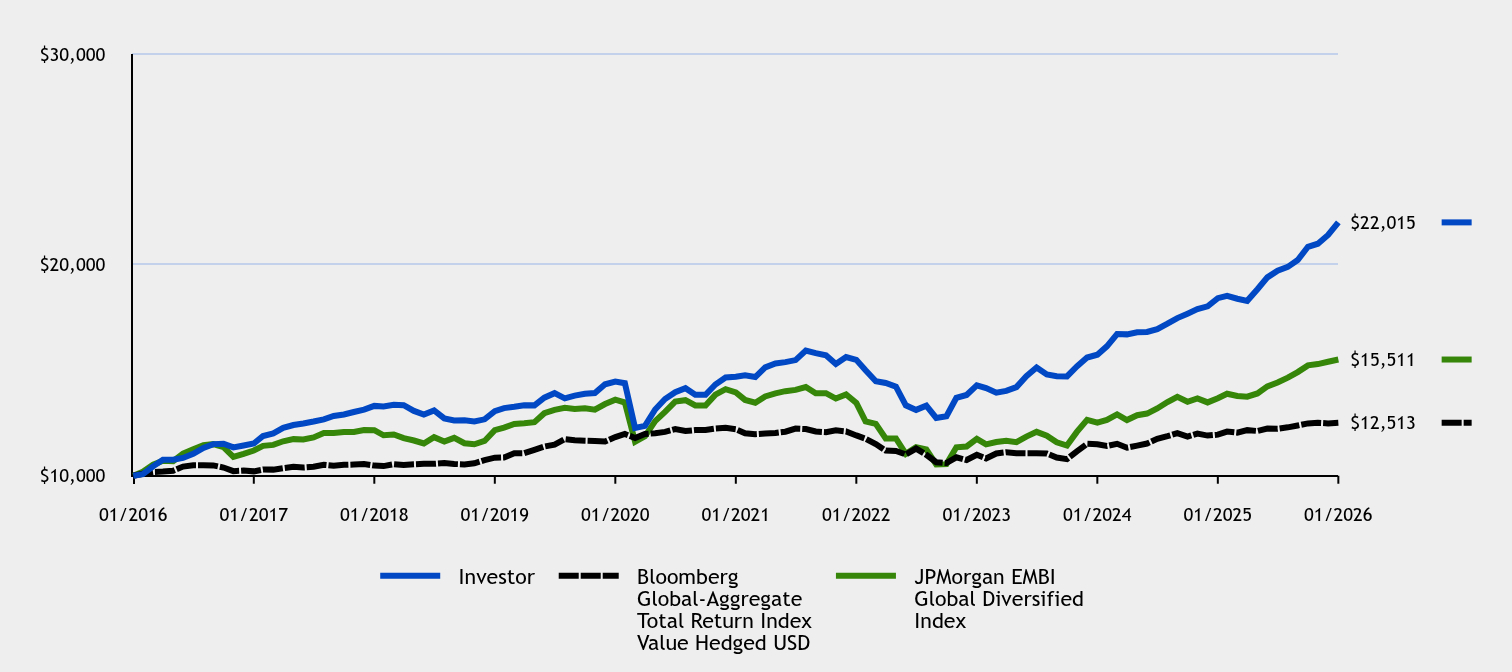
Table Summary
|
Investor |
Bloomberg Global-Aggregate Total Return Index Value Hedged USD |
JPMorgan EMBI Global Diversified Index |
01/2016 |
$10,000 |
$10,000 |
$10,000 |
02/2016 |
$10,075 |
$10,096 |
$10,191 |
03/2016 |
$10,446 |
$10,179 |
$10,523 |
04/2016 |
$10,758 |
$10,197 |
$10,710 |
05/2016 |
$10,760 |
$10,240 |
$10,691 |
06/2016 |
$10,845 |
$10,435 |
$11,051 |
07/2016 |
$11,040 |
$10,497 |
$11,250 |
08/2016 |
$11,322 |
$10,492 |
$11,452 |
09/2016 |
$11,500 |
$10,490 |
$11,498 |
10/2016 |
$11,521 |
$10,389 |
$11,355 |
11/2016 |
$11,345 |
$10,217 |
$10,891 |
12/2016 |
$11,435 |
$10,245 |
$11,035 |
01/2017 |
$11,528 |
$10,208 |
$11,195 |
02/2017 |
$11,886 |
$10,295 |
$11,419 |
03/2017 |
$12,011 |
$10,290 |
$11,462 |
04/2017 |
$12,271 |
$10,360 |
$11,633 |
05/2017 |
$12,406 |
$10,421 |
$11,736 |
06/2017 |
$12,478 |
$10,391 |
$11,719 |
07/2017 |
$12,571 |
$10,426 |
$11,817 |
08/2017 |
$12,676 |
$10,521 |
$12,026 |
09/2017 |
$12,833 |
$10,472 |
$12,028 |
10/2017 |
$12,905 |
$10,516 |
$12,072 |
11/2017 |
$13,023 |
$10,532 |
$12,078 |
12/2017 |
$13,137 |
$10,556 |
$12,167 |
01/2018 |
$13,312 |
$10,481 |
$12,162 |
02/2018 |
$13,289 |
$10,457 |
$11,920 |
03/2018 |
$13,365 |
$10,544 |
$11,955 |
04/2018 |
$13,345 |
$10,504 |
$11,781 |
05/2018 |
$13,073 |
$10,544 |
$11,670 |
06/2018 |
$12,903 |
$10,563 |
$11,531 |
07/2018 |
$13,099 |
$10,566 |
$11,826 |
08/2018 |
$12,716 |
$10,599 |
$11,621 |
09/2018 |
$12,622 |
$10,558 |
$11,797 |
10/2018 |
$12,630 |
$10,538 |
$11,543 |
11/2018 |
$12,574 |
$10,589 |
$11,494 |
12/2018 |
$12,675 |
$10,742 |
$11,649 |
01/2019 |
$13,067 |
$10,856 |
$12,163 |
02/2019 |
$13,207 |
$10,869 |
$12,284 |
03/2019 |
$13,269 |
$11,064 |
$12,459 |
04/2019 |
$13,346 |
$11,070 |
$12,489 |
05/2019 |
$13,337 |
$11,229 |
$12,540 |
06/2019 |
$13,702 |
$11,387 |
$12,967 |
07/2019 |
$13,915 |
$11,477 |
$13,124 |
08/2019 |
$13,671 |
$11,737 |
$13,222 |
09/2019 |
$13,798 |
$11,682 |
$13,162 |
10/2019 |
$13,890 |
$11,662 |
$13,199 |
11/2019 |
$13,923 |
$11,649 |
$13,136 |
12/2019 |
$14,335 |
$11,625 |
$13,400 |
01/2020 |
$14,466 |
$11,834 |
$13,604 |
02/2020 |
$14,389 |
$11,979 |
$13,473 |
03/2020 |
$12,267 |
$11,793 |
$11,607 |
04/2020 |
$12,362 |
$11,984 |
$11,868 |
05/2020 |
$13,141 |
$12,018 |
$12,588 |
06/2020 |
$13,639 |
$12,078 |
$13,030 |
07/2020 |
$13,961 |
$12,210 |
$13,514 |
08/2020 |
$14,151 |
$12,121 |
$13,583 |
09/2020 |
$13,843 |
$12,165 |
$13,332 |
10/2020 |
$13,836 |
$12,166 |
$13,328 |
11/2020 |
$14,330 |
$12,236 |
$13,842 |
12/2020 |
$14,657 |
$12,273 |
$14,105 |
01/2021 |
$14,692 |
$12,208 |
$13,952 |
02/2021 |
$14,760 |
$12,018 |
$13,596 |
03/2021 |
$14,681 |
$11,970 |
$13,465 |
04/2021 |
$15,138 |
$12,002 |
$13,763 |
05/2021 |
$15,326 |
$12,028 |
$13,909 |
06/2021 |
$15,387 |
$12,087 |
$14,011 |
07/2021 |
$15,484 |
$12,237 |
$14,070 |
08/2021 |
$15,940 |
$12,213 |
$14,208 |
09/2021 |
$15,812 |
$12,097 |
$13,913 |
10/2021 |
$15,709 |
$12,066 |
$13,916 |
11/2021 |
$15,297 |
$12,152 |
$13,660 |
12/2021 |
$15,629 |
$12,103 |
$13,852 |
01/2022 |
$15,496 |
$11,912 |
$13,458 |
02/2022 |
$15,003 |
$11,754 |
$12,577 |
03/2022 |
$14,482 |
$11,501 |
$12,464 |
04/2022 |
$14,397 |
$11,192 |
$11,767 |
05/2022 |
$14,223 |
$11,176 |
$11,770 |
06/2022 |
$13,340 |
$11,007 |
$11,038 |
07/2022 |
$13,123 |
$11,287 |
$11,358 |
08/2022 |
$13,325 |
$10,992 |
$11,250 |
09/2022 |
$12,743 |
$10,639 |
$10,534 |
10/2022 |
$12,822 |
$10,603 |
$10,550 |
11/2022 |
$13,696 |
$10,873 |
$11,351 |
12/2022 |
$13,831 |
$10,745 |
$11,388 |
01/2023 |
$14,286 |
$10,992 |
$11,749 |
02/2023 |
$14,155 |
$10,817 |
$11,490 |
03/2023 |
$13,936 |
$11,057 |
$11,600 |
04/2023 |
$14,022 |
$11,114 |
$11,662 |
05/2023 |
$14,203 |
$11,070 |
$11,595 |
06/2023 |
$14,723 |
$11,063 |
$11,854 |
07/2023 |
$15,134 |
$11,067 |
$12,081 |
08/2023 |
$14,802 |
$11,053 |
$11,899 |
09/2023 |
$14,716 |
$10,862 |
$11,589 |
10/2023 |
$14,711 |
$10,785 |
$11,432 |
11/2023 |
$15,187 |
$11,156 |
$12,080 |
12/2023 |
$15,605 |
$11,513 |
$12,651 |
01/2024 |
$15,741 |
$11,490 |
$12,522 |
02/2024 |
$16,138 |
$11,411 |
$12,645 |
03/2024 |
$16,718 |
$11,514 |
$12,909 |
04/2024 |
$16,704 |
$11,329 |
$12,641 |
05/2024 |
$16,805 |
$11,429 |
$12,869 |
06/2024 |
$16,816 |
$11,528 |
$12,948 |
07/2024 |
$16,951 |
$11,751 |
$13,190 |
08/2024 |
$17,210 |
$11,880 |
$13,496 |
09/2024 |
$17,475 |
$12,017 |
$13,745 |
10/2024 |
$17,687 |
$11,855 |
$13,509 |
11/2024 |
$17,903 |
$11,996 |
$13,670 |
12/2024 |
$18,036 |
$11,904 |
$13,478 |
01/2025 |
$18,420 |
$11,950 |
$13,672 |
02/2025 |
$18,526 |
$12,094 |
$13,887 |
03/2025 |
$18,395 |
$12,043 |
$13,781 |
04/2025 |
$18,294 |
$12,162 |
$13,750 |
05/2025 |
$18,845 |
$12,122 |
$13,904 |
06/2025 |
$19,407 |
$12,238 |
$14,239 |
07/2025 |
$19,727 |
$12,228 |
$14,420 |
08/2025 |
$19,905 |
$12,295 |
$14,654 |
09/2025 |
$20,228 |
$12,385 |
$14,915 |
10/2025 |
$20,858 |
$12,483 |
$15,233 |
11/2025 |
$21,004 |
$12,509 |
$15,296 |
12/2025 |
$21,419 |
$12,483 |
$15,406 |
01/2026 |
$22,015 |
$12,513 |
$15,511 |
|
|
| Average Annual Return [Table Text Block] |
Table Summary
Average Annual Total Returns (%) |
1 Year |
5 Years |
10 Years |
Investor ClassFootnote Reference1 |
19.52% |
8.42% |
8.21% |
Bloomberg Global-Aggregate Total Return Index Value Hedged USD |
4.71% |
0.50% |
2.27% |
JPMorgan EMBI Global Diversified Index |
13.45% |
2.14% |
4.49% | |
|
| No Deduction of Taxes [Text Block] |
The graph and table do not reflect the deduction of taxes that a shareholder would pay on fund distributions or redemption of fund shares.
|
|
| Material Change Date |
|
Jan. 31, 2025
|
| AssetsNet |
$ 1,689,197,853
|
|
| Holdings Count | Holding |
365
|
|
| Advisory Fees Paid, Amount |
$ 8,775,118
|
|
| InvestmentCompanyPortfolioTurnover |
34.00%
|
|
| Additional Fund Statistics [Text Block] |
Table Summary
Total Net Assets |
$1,689,197,853 |
# of Portfolio Holdings |
365 |
Portfolio Turnover Rate |
34% |
Total Management Fees Paid |
$8,775,118 | |
|
| Holdings [Text Block] |
Asset Allocation - % Investments
Table Summary
Value |
Value |
Foreign Sovereign Obligations |
73.4 |
Investment Companies |
11.8 |
Credit-Linked Notes |
5.9 |
Corporate Obligations |
4.9 |
Foreign Corporate Obligations |
4.0 | Excludes foreign currency derivatives. Top Ten Country Exposure - % Fixed Income
Table Summary
Value |
Value |
Kenya |
3.8 |
Uganda |
3.9 |
Ivory Coast |
3.9 |
Zambia |
4.5 |
Angola |
4.5 |
Egypt |
4.6 |
Ghana |
4.8 |
Argentina |
4.9 |
Nigeria |
5.3 |
United States |
5.5 | Top Ten Industry Allocations - % Fixed Income
Table Summary
Value |
Value |
Real Estate |
0.3 |
Electric |
0.4 |
Holding Companies - Diversified |
0.5 |
Telecommunications |
1.0 |
Oil & Gas |
1.6 |
Investment Companies |
2.7 |
Multi-National |
3.0 |
Diversified Financial Services |
4.4 |
Banks |
7.8 |
Foreign Sovereign Obligations |
77.9 | |
|
| Largest Holdings [Text Block] |
Top Ten Holdings - % Net Assets
Table Summary
Suriname Government International Bonds, 8.500%, Due 11/6/2035 |
1.8 |
Ghana Government International Bonds, 5.000%, Due 7/3/2035 |
1.7 |
Argentina Republic Government International Bonds, 4.125%, Due 7/9/2035 |
1.7 |
Republic of Kenya Infrastructure Bonds, 18.461%, Due 8/9/2032 |
1.5 |
Congolese International Bonds, 9.875%, Due 11/7/2032 |
1.3 |
Kyrgyz Republic International Bonds, 7.750%, Due 6/3/2030 |
1.3 |
Ecuador Government International Bonds, 5.000%, Due 7/31/2040 |
1.3 |
Argentina Republic Government International Bonds, 0.750%, Due 7/9/2030 |
1.3 |
Mozambique International Bonds, 9.000%, Due 9/15/2031 |
1.3 |
Ecuador Government International Bonds, 8.750%, Due 1/29/2034 |
1.2 | Excludes cash equivalents. |
|
| Material Fund Change [Text Block] |
This is a summary of certain changes to the Fund since January 31, 2025. For more complete information, you may review the Fund's next prospectus, which we expect to be available by June 1, 2026 at www.americanbeaconfunds.com/fund-resources/ or upon request at 800-658-5811. The Board of Trustees (“Board”) of the American Beacon Funds (the “Trust”), upon the recommendation of American Beacon Advisors, Inc. (“AmBeacon”), has approved the appointment of Ninety One North America, Inc. (“Ninety One NA”) as an additional sub-advisor to the American Beacon Developing World Income Fund (the “Fund”) and a new investment advisory agreement among AmBeacon, Ninety One NA and the Trust, on behalf of the Fund. Ninety One NA is appointed as a sub-advisor to the Fund effective November 12, 2025. AmBeacon currently expects to commence the allocation of a portion of the assets of the Fund to Ninety One NA on or about February 2, 2026. |
|
| Material Fund Change Adviser [Text Block] |
The Board of Trustees (“Board”) of the American Beacon Funds (the “Trust”), upon the recommendation of American Beacon Advisors, Inc. (“AmBeacon”), has approved the appointment of Ninety One North America, Inc. (“Ninety One NA”) as an additional sub-advisor to the American Beacon Developing World Income Fund (the “Fund”) and a new investment advisory agreement among AmBeacon, Ninety One NA and the Trust, on behalf of the Fund. Ninety One NA is appointed as a sub-advisor to the Fund effective November 12, 2025. AmBeacon currently expects to commence the allocation of a portion of the assets of the Fund to Ninety One NA on or about February 2, 2026.
|
|
| Summary of Change Legend [Text Block] |
This is a summary of certain changes to the Fund since January 31, 2025. For more complete information, you may review the Fund's next prospectus, which we expect to be available by June 1, 2026 at www.americanbeaconfunds.com/fund-resources/ or upon request at 800-658-5811.
|
This is a summary of certain changes to the Fund since January 31, 2025.
|
| C000136712 |
|
|
| Shareholder Report [Line Items] |
|
|
| Fund Name |
Developing World Income Fund
|
|
| Class Name |
R5
|
|
| Trading Symbol |
AGEIX
|
|
| Annual or Semi-Annual Statement [Text Block] |
This annual shareholder report contains important information about American Beacon Developing World Income Fund for the period of February 1, 2025 to January 31, 2026.
|
|
| Additional Information [Text Block] |
You can find additional information about the Fund at www.americanbeaconfunds.com/fund-resources/. You can request this information by contacting us at 800-658-5811.
|
|
| Material Fund Change Notice [Text Block] |
This report describes material changes to the Fund that occurred during the reporting period.
|
|
| Additional Information Phone Number |
800-658-5811
|
|
| Additional Information Website |
www.americanbeaconfunds.com/fund-resources/
|
|
| Expenses [Text Block] |
What were the Fund costs for the last year?(based on a hypothetical $10,000 investment)
Table Summary
Class Name |
Costs of a $10,000 investment |
Costs paid as a percentage of a $10,000 investment |
R5 |
$115 |
1.05% | |
|
| Expenses Paid, Amount |
$ 115
|
|
| Expense Ratio, Percent |
1.05%
|
|
| Factors Affecting Performance [Text Block] |
How did the Fund perform and what affected its performance? The R5 Class of the Fund returned 19.94% for the twelve months ended January 31, 2026, compared to the Bloomberg Global-Aggregate Total Return Index Value Hedged USD return of 4.71% and the JPMorgan EMBI Global Diversified Index return of 13.45%. • Developing market debt benefited from easing global monetary conditions over the period, supported by U.S. dollar weakness and the Federal Reserve’s resumption of rate cuts in the second half, while geopolitical and trade‑policy risks were largely concentrated in developed markets. • The Fund’s diversified strategy across local‑ and hard‑currency developing market debt, informed by a combination of top‑down macro views and bottom‑up country analysis, was strong during the period. • Positive absolute contribution to performance was driven by country exposures, with positions in Zambia, Egypt, Nigeria, Ghana, and Kenya among the largest contributors, while exposure to Senegal detracted during the period. |
|
| Performance Past Does Not Indicate Future [Text] |
Performance shown is historical and is not indicative of future returns.
|
|
| Line Graph [Table Text Block] |
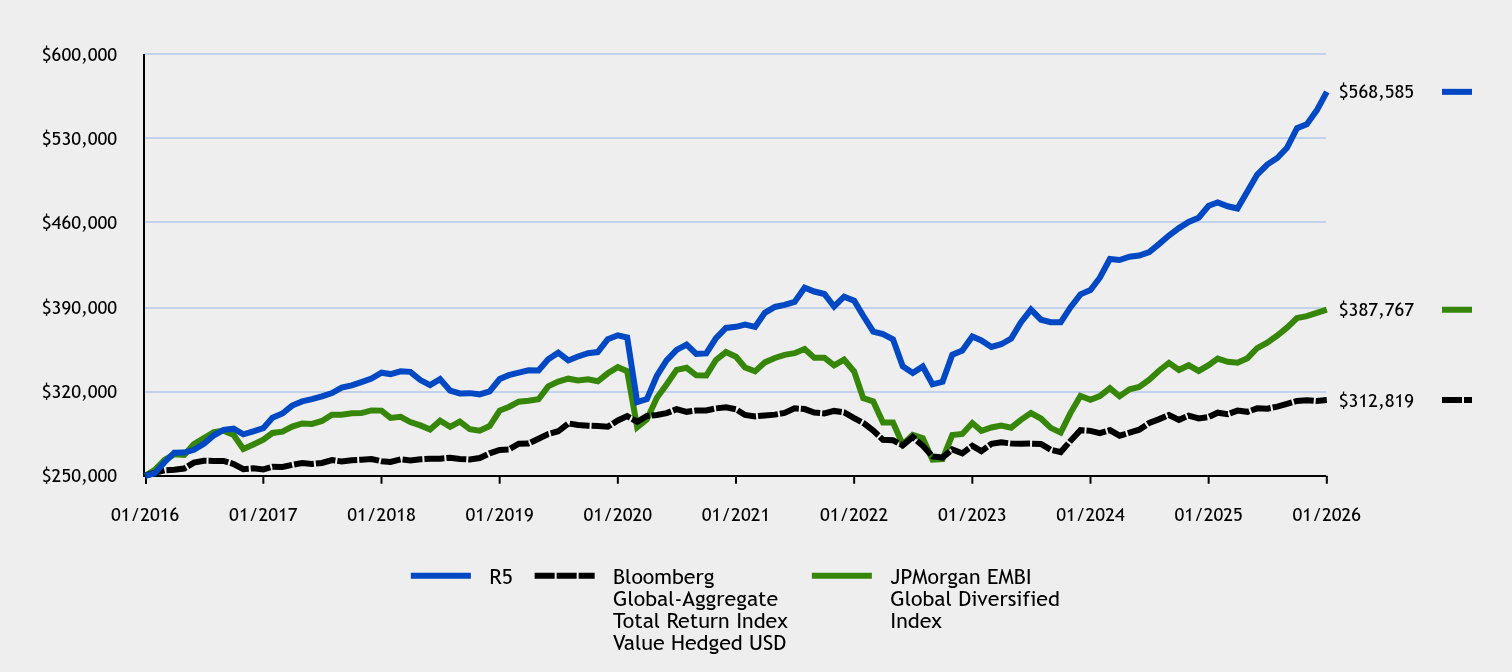
Table Summary
|
R5 |
Bloomberg Global-Aggregate Total Return Index Value Hedged USD |
JPMorgan EMBI Global Diversified Index |
01/2016 |
$250,000 |
$250,000 |
$250,000 |
02/2016 |
$251,942 |
$252,403 |
$254,766 |
03/2016 |
$261,218 |
$254,481 |
$263,086 |
04/2016 |
$269,110 |
$254,913 |
$267,745 |
05/2016 |
$269,257 |
$255,991 |
$267,267 |
06/2016 |
$271,494 |
$260,864 |
$276,281 |
07/2016 |
$276,433 |
$262,422 |
$281,256 |
08/2016 |
$283,567 |
$262,289 |
$286,291 |
09/2016 |
$288,119 |
$262,257 |
$287,446 |
10/2016 |
$289,048 |
$259,714 |
$283,878 |
11/2016 |
$284,419 |
$255,425 |
$272,263 |
12/2016 |
$286,738 |
$256,125 |
$275,884 |
01/2017 |
$289,454 |
$255,192 |
$279,864 |
02/2017 |
$298,128 |
$257,377 |
$285,473 |
03/2017 |
$301,646 |
$257,258 |
$286,550 |
04/2017 |
$308,221 |
$259,002 |
$290,820 |
05/2017 |
$311,672 |
$260,514 |
$293,389 |
06/2017 |
$313,547 |
$259,785 |
$292,974 |
07/2017 |
$315,943 |
$260,639 |
$295,430 |
08/2017 |
$318,649 |
$263,014 |
$300,660 |
09/2017 |
$323,110 |
$261,800 |
$300,692 |
10/2017 |
$325,022 |
$262,904 |
$301,808 |
11/2017 |
$327,749 |
$263,311 |
$301,960 |
12/2017 |
$330,665 |
$263,900 |
$304,178 |
01/2018 |
$335,539 |
$262,016 |
$304,047 |
02/2018 |
$334,364 |
$261,425 |
$297,999 |
03/2018 |
$336,670 |
$263,593 |
$298,870 |
04/2018 |
$336,198 |
$262,612 |
$294,523 |
05/2018 |
$329,381 |
$263,593 |
$291,755 |
06/2018 |
$325,159 |
$264,084 |
$288,279 |
07/2018 |
$330,150 |
$264,157 |
$295,646 |
08/2018 |
$320,589 |
$264,969 |
$290,529 |
09/2018 |
$318,272 |
$263,955 |
$294,923 |
10/2018 |
$318,545 |
$263,439 |
$288,563 |
11/2018 |
$317,557 |
$264,728 |
$287,344 |
12/2018 |
$319,963 |
$268,552 |
$291,220 |
01/2019 |
$330,235 |
$271,397 |
$304,069 |
02/2019 |
$333,490 |
$271,723 |
$307,102 |
03/2019 |
$335,523 |
$276,589 |
$311,467 |
04/2019 |
$337,568 |
$276,754 |
$312,225 |
05/2019 |
$337,382 |
$280,737 |
$313,508 |
06/2019 |
$346,692 |
$284,673 |
$324,163 |
07/2019 |
$352,158 |
$286,913 |
$328,100 |
08/2019 |
$345,693 |
$293,420 |
$330,548 |
09/2019 |
$348,996 |
$292,060 |
$329,042 |
10/2019 |
$351,710 |
$291,556 |
$329,967 |
11/2019 |
$352,628 |
$291,214 |
$328,397 |
12/2019 |
$363,254 |
$290,617 |
$335,006 |
01/2020 |
$366,575 |
$295,861 |
$340,112 |
02/2020 |
$364,725 |
$299,482 |
$336,824 |
03/2020 |
$311,083 |
$294,821 |
$290,178 |
04/2020 |
$313,583 |
$299,594 |
$296,695 |
05/2020 |
$332,984 |
$300,443 |
$314,699 |
06/2020 |
$345,722 |
$301,943 |
$325,758 |
07/2020 |
$354,395 |
$305,243 |
$337,851 |
08/2020 |
$358,851 |
$303,030 |
$339,587 |
09/2020 |
$351,162 |
$304,137 |
$333,301 |
10/2020 |
$351,518 |
$304,159 |
$333,202 |
11/2020 |
$364,148 |
$305,895 |
$346,054 |
12/2020 |
$372,661 |
$306,835 |
$352,624 |
01/2021 |
$373,557 |
$305,189 |
$348,797 |
02/2021 |
$375,397 |
$300,442 |
$339,892 |
03/2021 |
$373,489 |
$299,258 |
$336,618 |
04/2021 |
$385,201 |
$300,040 |
$344,077 |
05/2021 |
$390,077 |
$300,710 |
$347,727 |
06/2021 |
$391,739 |
$302,176 |
$350,278 |
07/2021 |
$394,299 |
$305,932 |
$351,738 |
08/2021 |
$406,022 |
$305,320 |
$355,189 |
09/2021 |
$402,870 |
$302,437 |
$347,826 |
10/2021 |
$400,813 |
$301,646 |
$347,911 |
11/2021 |
$390,445 |
$303,798 |
$341,511 |
12/2021 |
$398,620 |
$302,566 |
$346,291 |
01/2022 |
$395,230 |
$297,812 |
$336,441 |
02/2022 |
$382,785 |
$293,851 |
$314,415 |
03/2022 |
$369,593 |
$287,516 |
$311,588 |
04/2022 |
$367,546 |
$279,789 |
$294,168 |
05/2022 |
$363,209 |
$279,404 |
$294,246 |
06/2022 |
$340,771 |
$275,163 |
$275,962 |
07/2022 |
$335,350 |
$282,172 |
$283,939 |
08/2022 |
$340,569 |
$274,806 |
$281,256 |
09/2022 |
$325,810 |
$265,984 |
$263,359 |
10/2022 |
$327,935 |
$265,074 |
$263,759 |
11/2022 |
$350,324 |
$271,829 |
$283,783 |
12/2022 |
$353,957 |
$268,620 |
$284,711 |
01/2023 |
$365,580 |
$274,808 |
$293,729 |
02/2023 |
$362,337 |
$270,424 |
$287,245 |
03/2023 |
$356,835 |
$276,421 |
$290,012 |
04/2023 |
$359,127 |
$277,844 |
$291,553 |
05/2023 |
$363,837 |
$276,750 |
$289,881 |
06/2023 |
$377,234 |
$276,585 |
$296,351 |
07/2023 |
$387,864 |
$276,674 |
$302,013 |
08/2023 |
$379,467 |
$276,327 |
$297,471 |
09/2023 |
$377,373 |
$271,561 |
$289,732 |
10/2023 |
$377,359 |
$269,633 |
$285,809 |
11/2023 |
$389,678 |
$278,904 |
$301,996 |
12/2023 |
$400,546 |
$287,817 |
$316,286 |
01/2024 |
$404,045 |
$287,253 |
$313,055 |
02/2024 |
$414,335 |
$285,282 |
$316,116 |
03/2024 |
$429,896 |
$287,855 |
$322,724 |
04/2024 |
$429,050 |
$283,220 |
$316,024 |
05/2024 |
$431,742 |
$285,726 |
$321,722 |
06/2024 |
$432,730 |
$288,206 |
$323,702 |
07/2024 |
$435,696 |
$293,773 |
$329,751 |
08/2024 |
$442,446 |
$296,990 |
$337,394 |
09/2024 |
$449,381 |
$300,437 |
$343,623 |
10/2024 |
$455,527 |
$296,371 |
$337,720 |
11/2024 |
$460,574 |
$299,892 |
$341,738 |
12/2024 |
$464,171 |
$297,591 |
$336,962 |
01/2025 |
$474,047 |
$298,744 |
$341,806 |
02/2025 |
$476,892 |
$302,341 |
$347,167 |
03/2025 |
$473,624 |
$301,079 |
$344,520 |
04/2025 |
$471,803 |
$304,043 |
$343,754 |
05/2025 |
$486,098 |
$303,038 |
$347,588 |
06/2025 |
$499,939 |
$305,940 |
$355,976 |
07/2025 |
$508,281 |
$305,695 |
$360,490 |
08/2025 |
$513,657 |
$307,371 |
$366,361 |
09/2025 |
$522,113 |
$309,635 |
$372,885 |
10/2025 |
$538,430 |
$312,079 |
$380,818 |
11/2025 |
$541,594 |
$312,735 |
$382,392 |
12/2025 |
$553,237 |
$312,065 |
$385,145 |
01/2026 |
$568,585 |
$312,819 |
$387,767 |
|
|
| Average Annual Return [Table Text Block] |
Table Summary
Average Annual Total Returns (%) |
1 Year |
5 Years |
10 Years |
Class R5Footnote Reference1 |
19.94% |
8.76% |
8.56% |
Bloomberg Global-Aggregate Total Return Index Value Hedged USD |
4.71% |
0.50% |
2.27% |
JPMorgan EMBI Global Diversified Index |
13.45% |
2.14% |
4.49% | |
|
| No Deduction of Taxes [Text Block] |
The graph and table do not reflect the deduction of taxes that a shareholder would pay on fund distributions or redemption of fund shares.
|
|
| Material Change Date |
|
Jan. 31, 2025
|
| AssetsNet |
$ 1,689,197,853
|
|
| Holdings Count | Holding |
365
|
|
| Advisory Fees Paid, Amount |
$ 8,775,118
|
|
| InvestmentCompanyPortfolioTurnover |
34.00%
|
|
| Additional Fund Statistics [Text Block] |
Table Summary
Total Net Assets |
$1,689,197,853 |
# of Portfolio Holdings |
365 |
Portfolio Turnover Rate |
34% |
Total Management Fees Paid |
$8,775,118 | |
|
| Holdings [Text Block] |
Asset Allocation - % Investments
Table Summary
Value |
Value |
Foreign Sovereign Obligations |
73.4 |
Investment Companies |
11.8 |
Credit-Linked Notes |
5.9 |
Corporate Obligations |
4.9 |
Foreign Corporate Obligations |
4.0 | Excludes foreign currency derivatives. Top Ten Country Exposure - % Fixed Income
Table Summary
Value |
Value |
Kenya |
3.8 |
Uganda |
3.9 |
Ivory Coast |
3.9 |
Zambia |
4.5 |
Angola |
4.5 |
Egypt |
4.6 |
Ghana |
4.8 |
Argentina |
4.9 |
Nigeria |
5.3 |
United States |
5.5 | Top Ten Industry Allocations - % Fixed Income
Table Summary
Value |
Value |
Real Estate |
0.3 |
Electric |
0.4 |
Holding Companies - Diversified |
0.5 |
Telecommunications |
1.0 |
Oil & Gas |
1.6 |
Investment Companies |
2.7 |
Multi-National |
3.0 |
Diversified Financial Services |
4.4 |
Banks |
7.8 |
Foreign Sovereign Obligations |
77.9 | |
|
| Largest Holdings [Text Block] |
Top Ten Holdings - % Net Assets
Table Summary
Suriname Government International Bonds, 8.500%, Due 11/6/2035 |
1.8 |
Ghana Government International Bonds, 5.000%, Due 7/3/2035 |
1.7 |
Argentina Republic Government International Bonds, 4.125%, Due 7/9/2035 |
1.7 |
Republic of Kenya Infrastructure Bonds, 18.461%, Due 8/9/2032 |
1.5 |
Congolese International Bonds, 9.875%, Due 11/7/2032 |
1.3 |
Kyrgyz Republic International Bonds, 7.750%, Due 6/3/2030 |
1.3 |
Ecuador Government International Bonds, 5.000%, Due 7/31/2040 |
1.3 |
Argentina Republic Government International Bonds, 0.750%, Due 7/9/2030 |
1.3 |
Mozambique International Bonds, 9.000%, Due 9/15/2031 |
1.3 |
Ecuador Government International Bonds, 8.750%, Due 1/29/2034 |
1.2 | Excludes cash equivalents. |
|
| Material Fund Change [Text Block] |
This is a summary of certain changes to the Fund since January 31, 2025. For more complete information, you may review the Fund's next prospectus, which we expect to be available by June 1, 2026 at www.americanbeaconfunds.com/fund-resources/ or upon request at 800-658-5811. The Board of Trustees (“Board”) of the American Beacon Funds (the “Trust”), upon the recommendation of American Beacon Advisors, Inc. (“AmBeacon”), has approved the appointment of Ninety One North America, Inc. (“Ninety One NA”) as an additional sub-advisor to the American Beacon Developing World Income Fund (the “Fund”) and a new investment advisory agreement among AmBeacon, Ninety One NA and the Trust, on behalf of the Fund. Ninety One NA is appointed as a sub-advisor to the Fund effective November 12, 2025. AmBeacon currently expects to commence the allocation of a portion of the assets of the Fund to Ninety One NA on or about February 2, 2026. |
|
| Material Fund Change Adviser [Text Block] |
The Board of Trustees (“Board”) of the American Beacon Funds (the “Trust”), upon the recommendation of American Beacon Advisors, Inc. (“AmBeacon”), has approved the appointment of Ninety One North America, Inc. (“Ninety One NA”) as an additional sub-advisor to the American Beacon Developing World Income Fund (the “Fund”) and a new investment advisory agreement among AmBeacon, Ninety One NA and the Trust, on behalf of the Fund. Ninety One NA is appointed as a sub-advisor to the Fund effective November 12, 2025. AmBeacon currently expects to commence the allocation of a portion of the assets of the Fund to Ninety One NA on or about February 2, 2026.
|
|
| Summary of Change Legend [Text Block] |
This is a summary of certain changes to the Fund since January 31, 2025. For more complete information, you may review the Fund's next prospectus, which we expect to be available by June 1, 2026 at www.americanbeaconfunds.com/fund-resources/ or upon request at 800-658-5811.
|
This is a summary of certain changes to the Fund since January 31, 2025.
|
| C000136714 |
|
|
| Shareholder Report [Line Items] |
|
|
| Fund Name |
Developing World Income Fund
|
|
| Class Name |
Y
|
|
| Trading Symbol |
AGEYX
|
|
| Annual or Semi-Annual Statement [Text Block] |
This annual shareholder report contains important information about American Beacon Developing World Income Fund for the period of February 1, 2025 to January 31, 2026.
|
|
| Additional Information [Text Block] |
You can find additional information about the Fund at www.americanbeaconfunds.com/fund-resources/. You can request this information by contacting us at 800-658-5811.
|
|
| Material Fund Change Notice [Text Block] |
This report describes material changes to the Fund that occurred during the reporting period.
|
|
| Additional Information Phone Number |
800-658-5811
|
|
| Additional Information Website |
www.americanbeaconfunds.com/fund-resources/
|
|
| Expenses [Text Block] |
What were the Fund costs for the last year?(based on a hypothetical $10,000 investment)
Table Summary
Class Name |
Costs of a $10,000 investment |
Costs paid as a percentage of a $10,000 investment |
Y |
$118 |
1.08% | |
|
| Expenses Paid, Amount |
$ 118
|
|
| Expense Ratio, Percent |
1.08%
|
|
| Factors Affecting Performance [Text Block] |
How did the Fund perform and what affected its performance? The Y Class of the Fund returned 19.75% for the twelve months ended January 31, 2026, compared to the Bloomberg Global-Aggregate Total Return Index Value Hedged USD return of 4.71% and the JPMorgan EMBI Global Diversified Index return of 13.45%. • Developing market debt benefited from easing global monetary conditions over the period, supported by U.S. dollar weakness and the Federal Reserve’s resumption of rate cuts in the second half, while geopolitical and trade‑policy risks were largely concentrated in developed markets. • The Fund’s diversified strategy across local‑ and hard‑currency developing market debt, informed by a combination of top‑down macro views and bottom‑up country analysis, was strong during the period. • Positive absolute contribution to performance was driven by country exposures, with positions in Zambia, Egypt, Nigeria, Ghana, and Kenya among the largest contributors, while exposure to Senegal detracted during the period. |
|
| Performance Past Does Not Indicate Future [Text] |
Performance shown is historical and is not indicative of future returns.
|
|
| Line Graph [Table Text Block] |
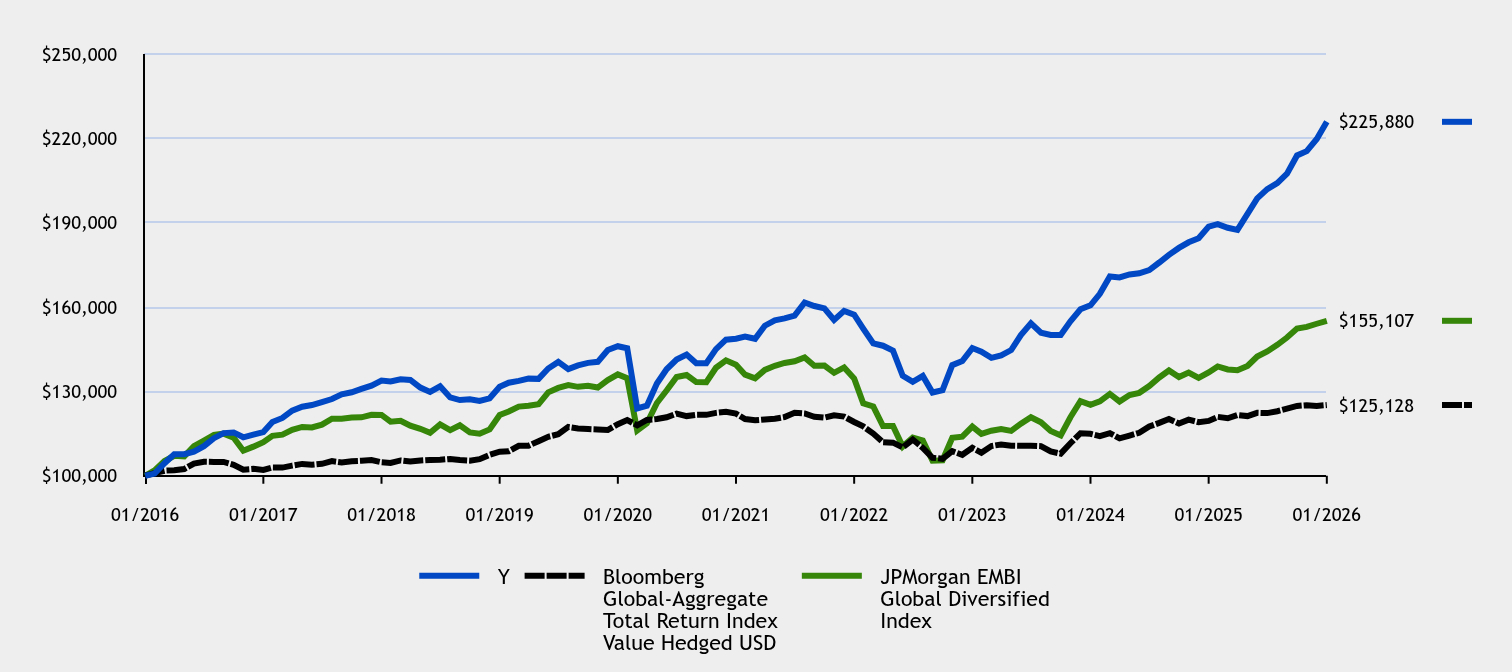
Table Summary
#ERROR:A result could not be returned because the conditional could not be evaluated to a True/False value (#ERROR:Invalid Formula (#!=""), 'Multiple values from an iterator cannot be used in a formula unless they are aggregrated.') |
Y |
Bloomberg Global-Aggregate Total Return Index Value Hedged USD |
JPMorgan EMBI Global Diversified Index |
01/2016 |
$100,000 |
$100,000 |
$100,000 |
02/2016 |
$100,765 |
$100,961 |
$101,906 |
03/2016 |
$104,471 |
$101,792 |
$105,234 |
04/2016 |
$107,614 |
$101,965 |
$107,098 |
05/2016 |
$107,663 |
$102,396 |
$106,907 |
06/2016 |
$108,550 |
$104,346 |
$110,513 |
07/2016 |
$110,516 |
$104,969 |
$112,502 |
08/2016 |
$113,354 |
$104,915 |
$114,517 |
09/2016 |
$115,165 |
$104,903 |
$114,979 |
10/2016 |
$115,400 |
$103,886 |
$113,551 |
11/2016 |
$113,670 |
$102,170 |
$108,905 |
12/2016 |
$114,594 |
$102,450 |
$110,354 |
01/2017 |
$115,548 |
$102,077 |
$111,945 |
02/2017 |
$119,140 |
$102,951 |
$114,189 |
03/2017 |
$120,543 |
$102,903 |
$114,620 |
04/2017 |
$123,158 |
$103,601 |
$116,328 |
05/2017 |
$124,532 |
$104,206 |
$117,356 |
06/2017 |
$125,142 |
$103,914 |
$117,190 |
07/2017 |
$126,218 |
$104,255 |
$118,172 |
08/2017 |
$127,287 |
$105,206 |
$120,264 |
09/2017 |
$128,928 |
$104,720 |
$120,277 |
10/2017 |
$129,682 |
$105,162 |
$120,723 |
11/2017 |
$130,896 |
$105,325 |
$120,784 |
12/2017 |
$132,055 |
$105,560 |
$121,671 |
01/2018 |
$133,853 |
$104,807 |
$121,619 |
02/2018 |
$133,515 |
$104,570 |
$119,199 |
03/2018 |
$134,292 |
$105,437 |
$119,548 |
04/2018 |
$134,093 |
$105,045 |
$117,809 |
05/2018 |
$131,370 |
$105,437 |
$116,702 |
06/2018 |
$129,831 |
$105,634 |
$115,312 |
07/2018 |
$131,816 |
$105,663 |
$118,258 |
08/2018 |
$127,851 |
$105,987 |
$116,212 |
09/2018 |
$126,919 |
$105,582 |
$117,969 |
10/2018 |
$127,168 |
$105,376 |
$115,425 |
11/2018 |
$126,616 |
$105,891 |
$114,937 |
12/2018 |
$127,545 |
$107,421 |
$116,488 |
01/2019 |
$131,640 |
$108,559 |
$121,627 |
02/2019 |
$133,081 |
$108,689 |
$122,841 |
03/2019 |
$133,732 |
$110,636 |
$124,587 |
04/2019 |
$134,539 |
$110,702 |
$124,890 |
05/2019 |
$134,453 |
$112,295 |
$125,403 |
06/2019 |
$138,154 |
$113,869 |
$129,665 |
07/2019 |
$140,491 |
$114,765 |
$131,240 |
08/2019 |
$137,923 |
$117,368 |
$132,219 |
09/2019 |
$139,240 |
$116,824 |
$131,617 |
10/2019 |
$140,156 |
$116,622 |
$131,987 |
11/2019 |
$140,518 |
$116,485 |
$131,359 |
12/2019 |
$144,734 |
$116,247 |
$134,002 |
01/2020 |
$146,057 |
$118,344 |
$136,045 |
02/2020 |
$145,309 |
$119,793 |
$134,729 |
03/2020 |
$123,935 |
$117,929 |
$116,071 |
04/2020 |
$124,924 |
$119,838 |
$118,678 |
05/2020 |
$132,812 |
$120,177 |
$125,879 |
06/2020 |
$137,879 |
$120,777 |
$130,303 |
07/2020 |
$141,330 |
$122,097 |
$135,140 |
08/2020 |
$143,111 |
$121,212 |
$135,835 |
09/2020 |
$140,046 |
$121,655 |
$133,321 |
10/2020 |
$140,007 |
$121,664 |
$133,281 |
11/2020 |
$145,026 |
$122,358 |
$138,422 |
12/2020 |
$148,397 |
$122,734 |
$141,049 |
01/2021 |
$148,754 |
$122,076 |
$139,519 |
02/2021 |
$149,478 |
$120,177 |
$135,957 |
03/2021 |
$148,708 |
$119,703 |
$134,647 |
04/2021 |
$153,362 |
$120,016 |
$137,631 |
05/2021 |
$155,294 |
$120,284 |
$139,091 |
06/2021 |
$155,948 |
$120,871 |
$140,111 |
07/2021 |
$156,958 |
$122,373 |
$140,695 |
08/2021 |
$161,617 |
$122,128 |
$142,076 |
09/2021 |
$160,355 |
$120,975 |
$139,130 |
10/2021 |
$159,529 |
$120,658 |
$139,164 |
11/2021 |
$155,393 |
$121,519 |
$136,605 |
12/2021 |
$158,631 |
$121,026 |
$138,517 |
01/2022 |
$157,282 |
$119,125 |
$134,576 |
02/2022 |
$152,322 |
$117,540 |
$125,766 |
03/2022 |
$147,065 |
$115,006 |
$124,635 |
04/2022 |
$146,245 |
$111,916 |
$117,667 |
05/2022 |
$144,513 |
$111,761 |
$117,699 |
06/2022 |
$135,578 |
$110,065 |
$110,385 |
07/2022 |
$133,418 |
$112,869 |
$113,575 |
08/2022 |
$135,488 |
$109,922 |
$112,502 |
09/2022 |
$129,610 |
$106,394 |
$105,343 |
10/2022 |
$130,450 |
$106,029 |
$105,504 |
11/2022 |
$139,352 |
$108,731 |
$113,513 |
12/2022 |
$140,787 |
$107,448 |
$113,884 |
01/2023 |
$145,410 |
$109,923 |
$117,492 |
02/2023 |
$144,112 |
$108,170 |
$114,898 |
03/2023 |
$141,917 |
$110,568 |
$116,005 |
04/2023 |
$142,824 |
$111,138 |
$116,621 |
05/2023 |
$144,693 |
$110,700 |
$115,952 |
06/2023 |
$150,012 |
$110,634 |
$118,540 |
07/2023 |
$154,230 |
$110,670 |
$120,805 |
08/2023 |
$150,884 |
$110,531 |
$118,988 |
09/2023 |
$150,043 |
$108,625 |
$115,893 |
10/2023 |
$150,028 |
$107,853 |
$114,324 |
11/2023 |
$154,917 |
$111,562 |
$120,798 |
12/2023 |
$159,226 |
$115,127 |
$126,514 |
01/2024 |
$160,617 |
$114,901 |
$125,222 |
02/2024 |
$164,698 |
$114,113 |
$126,446 |
03/2024 |
$170,874 |
$115,142 |
$129,090 |
04/2024 |
$170,528 |
$113,288 |
$126,410 |
05/2024 |
$171,596 |
$114,290 |
$128,689 |
06/2024 |
$171,989 |
$115,282 |
$129,481 |
07/2024 |
$173,163 |
$117,509 |
$131,900 |
08/2024 |
$175,838 |
$118,796 |
$134,958 |
09/2024 |
$178,586 |
$120,175 |
$137,449 |
10/2024 |
$181,032 |
$118,549 |
$135,088 |
11/2024 |
$183,026 |
$119,957 |
$136,695 |
12/2024 |
$184,448 |
$119,036 |
$134,785 |
01/2025 |
$188,634 |
$119,497 |
$136,722 |
02/2025 |
$189,495 |
$120,936 |
$138,867 |
03/2025 |
$188,191 |
$120,432 |
$137,808 |
04/2025 |
$187,460 |
$121,617 |
$137,502 |
05/2025 |
$193,134 |
$121,215 |
$139,035 |
06/2025 |
$198,636 |
$122,376 |
$142,390 |
07/2025 |
$201,945 |
$122,278 |
$144,196 |
08/2025 |
$204,081 |
$122,948 |
$146,544 |
09/2025 |
$207,435 |
$123,854 |
$149,154 |
10/2025 |
$213,918 |
$124,832 |
$152,327 |
11/2025 |
$215,457 |
$125,094 |
$152,957 |
12/2025 |
$219,783 |
$124,826 |
$154,058 |
01/2026 |
$225,880 |
$125,128 |
$155,107 |
|
|
| Average Annual Return [Table Text Block] |
Table Summary
Average Annual Total Returns (%) |
1 Year |
5 Years |
10 Years |
Class YFootnote Reference1 |
19.75% |
8.71% |
8.49% |
Bloomberg Global-Aggregate Total Return Index Value Hedged USD |
4.71% |
0.50% |
2.27% |
JPMorgan EMBI Global Diversified Index |
13.45% |
2.14% |
4.49% | |
|
| No Deduction of Taxes [Text Block] |
The graph and table do not reflect the deduction of taxes that a shareholder would pay on fund distributions or redemption of fund shares.
|
|
| Material Change Date |
|
Jan. 31, 2025
|
| AssetsNet |
$ 1,689,197,853
|
|
| Holdings Count | Holding |
365
|
|
| Advisory Fees Paid, Amount |
$ 8,775,118
|
|
| InvestmentCompanyPortfolioTurnover |
34.00%
|
|
| Additional Fund Statistics [Text Block] |
Table Summary
Total Net Assets |
$1,689,197,853 |
# of Portfolio Holdings |
365 |
Portfolio Turnover Rate |
34% |
Total Management Fees Paid |
$8,775,118 | |
|
| Holdings [Text Block] |
Asset Allocation - % Investments
Table Summary
Value |
Value |
Foreign Sovereign Obligations |
73.4 |
Investment Companies |
11.8 |
Credit-Linked Notes |
5.9 |
Corporate Obligations |
4.9 |
Foreign Corporate Obligations |
4.0 | Excludes foreign currency derivatives. Top Ten Country Exposure - % Fixed Income
Table Summary
Value |
Value |
Kenya |
3.8 |
Uganda |
3.9 |
Ivory Coast |
3.9 |
Zambia |
4.5 |
Angola |
4.5 |
Egypt |
4.6 |
Ghana |
4.8 |
Argentina |
4.9 |
Nigeria |
5.3 |
United States |
5.5 | Top Ten Industry Allocations - % Fixed Income
Table Summary
Value |
Value |
Real Estate |
0.3 |
Electric |
0.4 |
Holding Companies - Diversified |
0.5 |
Telecommunications |
1.0 |
Oil & Gas |
1.6 |
Investment Companies |
2.7 |
Multi-National |
3.0 |
Diversified Financial Services |
4.4 |
Banks |
7.8 |
Foreign Sovereign Obligations |
77.9 | |
|
| Largest Holdings [Text Block] |
Top Ten Holdings - % Net Assets
Table Summary
Suriname Government International Bonds, 8.500%, Due 11/6/2035 |
1.8 |
Ghana Government International Bonds, 5.000%, Due 7/3/2035 |
1.7 |
Argentina Republic Government International Bonds, 4.125%, Due 7/9/2035 |
1.7 |
Republic of Kenya Infrastructure Bonds, 18.461%, Due 8/9/2032 |
1.5 |
Congolese International Bonds, 9.875%, Due 11/7/2032 |
1.3 |
Kyrgyz Republic International Bonds, 7.750%, Due 6/3/2030 |
1.3 |
Ecuador Government International Bonds, 5.000%, Due 7/31/2040 |
1.3 |
Argentina Republic Government International Bonds, 0.750%, Due 7/9/2030 |
1.3 |
Mozambique International Bonds, 9.000%, Due 9/15/2031 |
1.3 |
Ecuador Government International Bonds, 8.750%, Due 1/29/2034 |
1.2 | Excludes cash equivalents. |
|
| Material Fund Change [Text Block] |
This is a summary of certain changes to the Fund since January 31, 2025. For more complete information, you may review the Fund's next prospectus, which we expect to be available by June 1, 2026 at www.americanbeaconfunds.com/fund-resources/ or upon request at 800-658-5811. The Board of Trustees (“Board”) of the American Beacon Funds (the “Trust”), upon the recommendation of American Beacon Advisors, Inc. (“AmBeacon”), has approved the appointment of Ninety One North America, Inc. (“Ninety One NA”) as an additional sub-advisor to the American Beacon Developing World Income Fund (the “Fund”) and a new investment advisory agreement among AmBeacon, Ninety One NA and the Trust, on behalf of the Fund. Ninety One NA is appointed as a sub-advisor to the Fund effective November 12, 2025. AmBeacon currently expects to commence the allocation of a portion of the assets of the Fund to Ninety One NA on or about February 2, 2026. |
|
| Material Fund Change Adviser [Text Block] |
The Board of Trustees (“Board”) of the American Beacon Funds (the “Trust”), upon the recommendation of American Beacon Advisors, Inc. (“AmBeacon”), has approved the appointment of Ninety One North America, Inc. (“Ninety One NA”) as an additional sub-advisor to the American Beacon Developing World Income Fund (the “Fund”) and a new investment advisory agreement among AmBeacon, Ninety One NA and the Trust, on behalf of the Fund. Ninety One NA is appointed as a sub-advisor to the Fund effective November 12, 2025. AmBeacon currently expects to commence the allocation of a portion of the assets of the Fund to Ninety One NA on or about February 2, 2026.
|
|
| Summary of Change Legend [Text Block] |
This is a summary of certain changes to the Fund since January 31, 2025. For more complete information, you may review the Fund's next prospectus, which we expect to be available by June 1, 2026 at www.americanbeaconfunds.com/fund-resources/ or upon request at 800-658-5811.
|
This is a summary of certain changes to the Fund since January 31, 2025.
|
| C000221417 |
|
|
| Shareholder Report [Line Items] |
|
|
| Fund Name |
NIS Core Plus Bond Fund
|
|
| Class Name |
A
|
|
| Trading Symbol |
NISAX
|
|
| Annual or Semi-Annual Statement [Text Block] |
This annual shareholder report contains important information about American Beacon NIS Core Plus Bond Fund for the period of February 1, 2025 to January 31, 2026.
|
|
| Additional Information [Text Block] |
You can find additional information about the Fund at www.americanbeaconfunds.com/fund-resources/. You can request this information by contacting us at 800-658-5811.
|
|
| Additional Information Phone Number |
800-658-5811
|
|
| Additional Information Website |
www.americanbeaconfunds.com/fund-resources/
|
|
| Expenses [Text Block] |
What were the Fund costs for the last year?(based on a hypothetical $10,000 investment)
Table Summary
Class Name |
Costs of a $10,000 investment |
Costs paid as a percentage of a $10,000 investment |
Class A |
$81 |
0.79% | |
|
| Expenses Paid, Amount |
$ 81
|
|
| Expense Ratio, Percent |
0.79%
|
|
| Factors Affecting Performance [Text Block] |
How did the Fund perform and what affected its performance? The A Class of the Fund returned 2.69% (with sales charges) and 6.69% (without sales charges) for the twelve months ended January 31, 2026, compared to the Bloomberg U.S. Aggregate Bond Index return of 6.85%. • The investment strategy of the Fund’s sub-advisor utilizes both bottom-up and top-down inputs to select the best relative value securities available across a broad range of domestic fixed income sectors. • The period benefited from an improving policy and credit backdrop, as the Federal Reserve cut rates three times from September through December, supporting fixed income and credit assets overall, despite a rocky market environment in early April surrounding Liberation Day. • Corporate Bonds were the largest positive contributors to performance, followed by U.S. Treasuries, Mortgage‑Backed Securities, and Asset‑Backed Securities, reflecting broad strength across fixed income sectors during the period. |
|
| Performance Past Does Not Indicate Future [Text] |
Performance shown is historical and is not indicative of future returns.
|
|
| Line Graph [Table Text Block] |
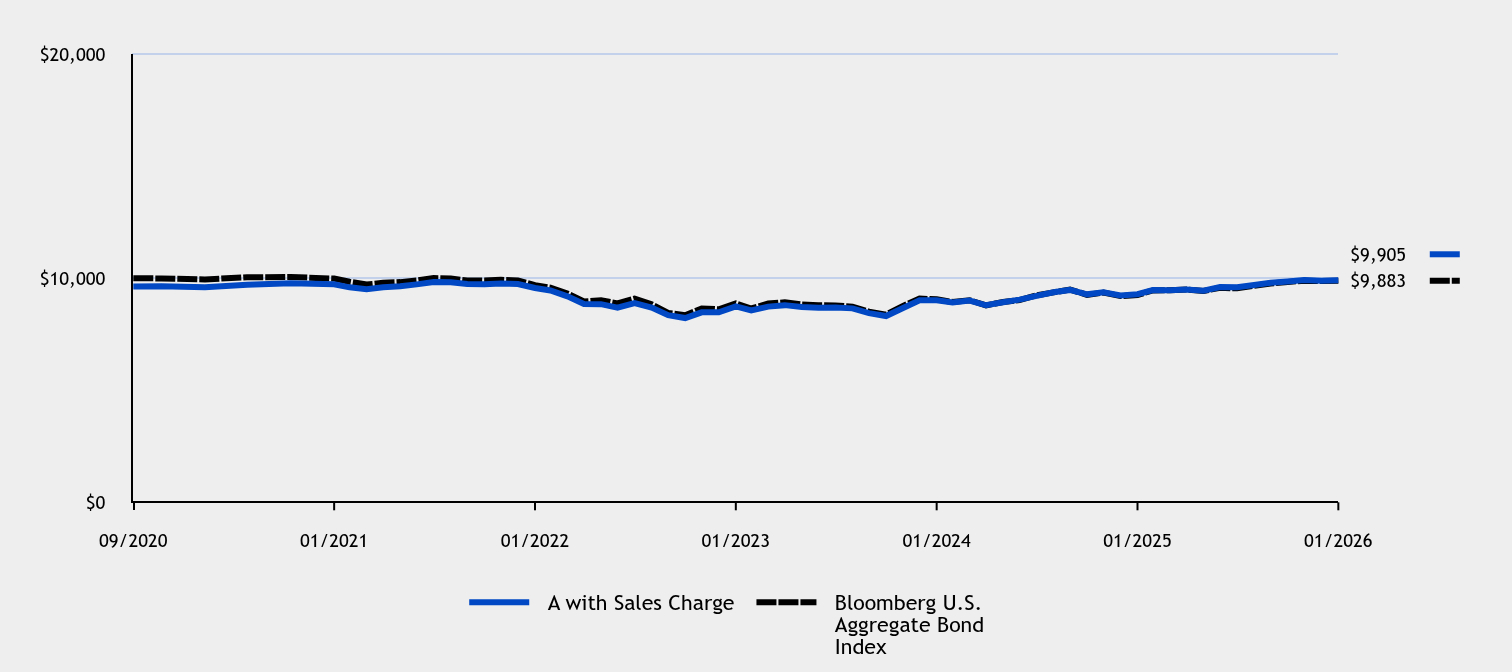
Table Summary
|
A with Sales Charge |
Bloomberg U.S. Aggregate Bond Index |
09/2020 |
$9,625 |
$10,000 |
09/2020 |
$9,636 |
$9,987 |
10/2020 |
$9,589 |
$9,942 |
11/2020 |
$9,707 |
$10,040 |
12/2020 |
$9,768 |
$10,053 |
01/2021 |
$9,723 |
$9,981 |
02/2021 |
$9,590 |
$9,837 |
03/2021 |
$9,508 |
$9,714 |
04/2021 |
$9,591 |
$9,791 |
05/2021 |
$9,636 |
$9,823 |
06/2021 |
$9,723 |
$9,892 |
07/2021 |
$9,823 |
$10,003 |
08/2021 |
$9,819 |
$9,984 |
09/2021 |
$9,735 |
$9,897 |
10/2021 |
$9,730 |
$9,895 |
11/2021 |
$9,764 |
$9,924 |
12/2021 |
$9,741 |
$9,898 |
01/2022 |
$9,560 |
$9,685 |
02/2022 |
$9,449 |
$9,577 |
03/2022 |
$9,189 |
$9,311 |
04/2022 |
$8,851 |
$8,958 |
05/2022 |
$8,841 |
$9,015 |
06/2022 |
$8,681 |
$8,874 |
07/2022 |
$8,890 |
$9,091 |
08/2022 |
$8,689 |
$8,834 |
09/2022 |
$8,349 |
$8,452 |
10/2022 |
$8,220 |
$8,343 |
11/2022 |
$8,474 |
$8,650 |
12/2022 |
$8,477 |
$8,611 |
01/2023 |
$8,744 |
$8,876 |
02/2023 |
$8,563 |
$8,646 |
03/2023 |
$8,731 |
$8,866 |
04/2023 |
$8,796 |
$8,919 |
05/2023 |
$8,709 |
$8,822 |
06/2023 |
$8,682 |
$8,791 |
07/2023 |
$8,687 |
$8,785 |
08/2023 |
$8,652 |
$8,729 |
09/2023 |
$8,440 |
$8,507 |
10/2023 |
$8,311 |
$8,373 |
11/2023 |
$8,660 |
$8,752 |
12/2023 |
$9,012 |
$9,087 |
01/2024 |
$9,009 |
$9,062 |
02/2024 |
$8,911 |
$8,934 |
03/2024 |
$9,003 |
$9,016 |
04/2024 |
$8,789 |
$8,788 |
05/2024 |
$8,925 |
$8,937 |
06/2024 |
$9,040 |
$9,022 |
07/2024 |
$9,210 |
$9,233 |
08/2024 |
$9,372 |
$9,365 |
09/2024 |
$9,475 |
$9,491 |
10/2024 |
$9,278 |
$9,256 |
11/2024 |
$9,374 |
$9,353 |
12/2024 |
$9,231 |
$9,200 |
01/2025 |
$9,284 |
$9,249 |
02/2025 |
$9,467 |
$9,453 |
03/2025 |
$9,463 |
$9,456 |
04/2025 |
$9,495 |
$9,493 |
05/2025 |
$9,440 |
$9,425 |
06/2025 |
$9,604 |
$9,570 |
07/2025 |
$9,592 |
$9,545 |
08/2025 |
$9,694 |
$9,659 |
09/2025 |
$9,792 |
$9,765 |
10/2025 |
$9,850 |
$9,826 |
11/2025 |
$9,914 |
$9,887 |
12/2025 |
$9,883 |
$9,872 |
01/2026 |
$9,905 |
$9,883 |
|
|
| Average Annual Return [Table Text Block] |
Table Summary
Average Annual Total Returns (%) |
1 Year |
5 Years |
Since Inception (9/10/20) |
Class A without Sales ChargeFootnote Reference1 |
6.69% |
0.37% |
0.53% |
Class A with Maximum Sales Charge - 3.75%Footnote Reference1 |
2.69% |
(0.39)% |
(0.18)% |
Bloomberg U.S. Aggregate Bond Index |
6.85% |
(0.20)% |
(0.20)% | |
|
| Performance Inception Date |
Sep. 10, 2020
|
|
| No Deduction of Taxes [Text Block] |
The graph and table do not reflect the deduction of taxes that a shareholder would pay on fund distributions or redemption of fund shares.
|
|
| AssetsNet |
$ 8,172,347
|
|
| Holdings Count | Holding |
427
|
|
| Advisory Fees Paid, Amount |
$ 0
|
|
| InvestmentCompanyPortfolioTurnover |
80.00%
|
|
| Additional Fund Statistics [Text Block] |
Table Summary
Total Net Assets |
$8,172,347 |
# of Portfolio Holdings |
427 |
Portfolio Turnover Rate |
80% |
Total Management Fees Paid |
$0 | |
|
| Holdings [Text Block] |
Asset Allocation - % Investments
Table Summary
Value |
Value |
Corporate Obligations |
30.5 |
U.S. Treasury Obligations |
24.4 |
Collateralized Mortgage Obligations |
12.3 |
Asset-Backed Obligations |
10.9 |
U.S. Agency Mortgage-Backed Obligations |
8.0 |
Commercial Mortgage-Backed Obligations |
6.7 |
Municipal Obligations |
4.1 |
Foreign Corporate Obligations |
2.8 |
Foreign Sovereign Obligations |
0.3 | Top Ten Country Exposure - % Investments
Table Summary
Value |
Value |
Cameroon |
0.1 |
Brazil |
0.1 |
Bermuda |
0.1 |
China |
0.2 |
France |
0.2 |
Mexico |
0.3 |
United Kingdom |
0.4 |
Ireland |
0.6 |
Canada |
1.3 |
United States |
96.7 | Top Ten Industry Allocations - % Investments
Table Summary
Value |
Value |
Insurance |
2.9 |
Diversified Financial Services |
3.9 |
Electric |
3.9 |
Municipal |
4.1 |
Banks |
4.7 |
Commercial MBS |
6.7 |
UMBS Collateral |
7.2 |
Asset-Backed Obligations |
10.9 |
Collateralized Mortgage Obligations |
12.3 |
U.S. Treasury Obligations |
24.4 | |
|
| Largest Holdings [Text Block] |
Top Ten Holdings - % Net Assets
Table Summary
U.S. Treasury Bonds, 3.375%, Due 11/15/2048 |
5.2 |
U.S. Treasury Notes, 4.250%, Due 8/15/2035 |
4.6 |
U.S. Treasury Notes, 4.500%, Due 11/15/2033 |
2.2 |
U.S. Treasury Notes, 4.000%, Due 11/15/2035 |
2.1 |
RCKT Mortgage Trust, Series 2023-CES1, 6.902%, Due 6/25/2043, Class M1 |
1.9 |
U.S. Treasury Bonds, 1.750%, Due 8/15/2041 |
1.8 |
U.S. Treasury Bonds, 4.875%, Due 8/15/2045 |
1.5 |
U.S. Treasury Bonds, 2.500%, Due 2/15/2045 |
1.4 |
U.S. Treasury Notes, 2.875%, Due 5/15/2032 |
1.3 |
U.S. Treasury Bonds, 4.750%, Due 2/15/2045 |
1.1 | |
|
| Material Fund Change [Text Block] |
|
|
| C000221418 |
|
|
| Shareholder Report [Line Items] |
|
|
| Fund Name |
NIS Core Plus Bond Fund
|
|
| Class Name |
C
|
|
| Trading Symbol |
NISCX
|
|
| Annual or Semi-Annual Statement [Text Block] |
This annual shareholder report contains important information about American Beacon NIS Core Plus Bond Fund for the period of February 1, 2025 to January 31, 2026.
|
|
| Additional Information [Text Block] |
You can find additional information about the Fund at www.americanbeaconfunds.com/fund-resources/. You can request this information by contacting us at 800-658-5811.
|
|
| Additional Information Phone Number |
800-658-5811
|
|
| Additional Information Website |
www.americanbeaconfunds.com/fund-resources/
|
|
| Expenses [Text Block] |
What were the Fund costs for the last year?(based on a hypothetical $10,000 investment)
Table Summary
Class Name |
Costs of a $10,000 investment |
Costs paid as a percentage of a $10,000 investment |
Class C |
$158 |
1.54% | |
|
| Expenses Paid, Amount |
$ 158
|
|
| Expense Ratio, Percent |
1.54%
|
|
| Factors Affecting Performance [Text Block] |
How did the Fund perform and what affected its performance? The C Class of the Fund returned 4.90% (with sales charges) and 5.90% (without sales charges) for the twelve months ended January 31, 2026, compared to the Bloomberg U.S. Aggregate Bond Index return of 6.85%. • The investment strategy of the Fund’s sub-advisor utilizes both bottom-up and top-down inputs to select the best relative value securities available across a broad range of domestic fixed income sectors. • The period benefited from an improving policy and credit backdrop, as the Federal Reserve cut rates three times from September through December, supporting fixed income and credit assets overall, despite a rocky market environment in early April surrounding Liberation Day. • Corporate Bonds were the largest positive contributors to performance, followed by U.S. Treasuries, Mortgage‑Backed Securities, and Asset‑Backed Securities, reflecting broad strength across fixed income sectors during the period. |
|
| Performance Past Does Not Indicate Future [Text] |
Performance shown is historical and is not indicative of future returns.
|
|
| Line Graph [Table Text Block] |
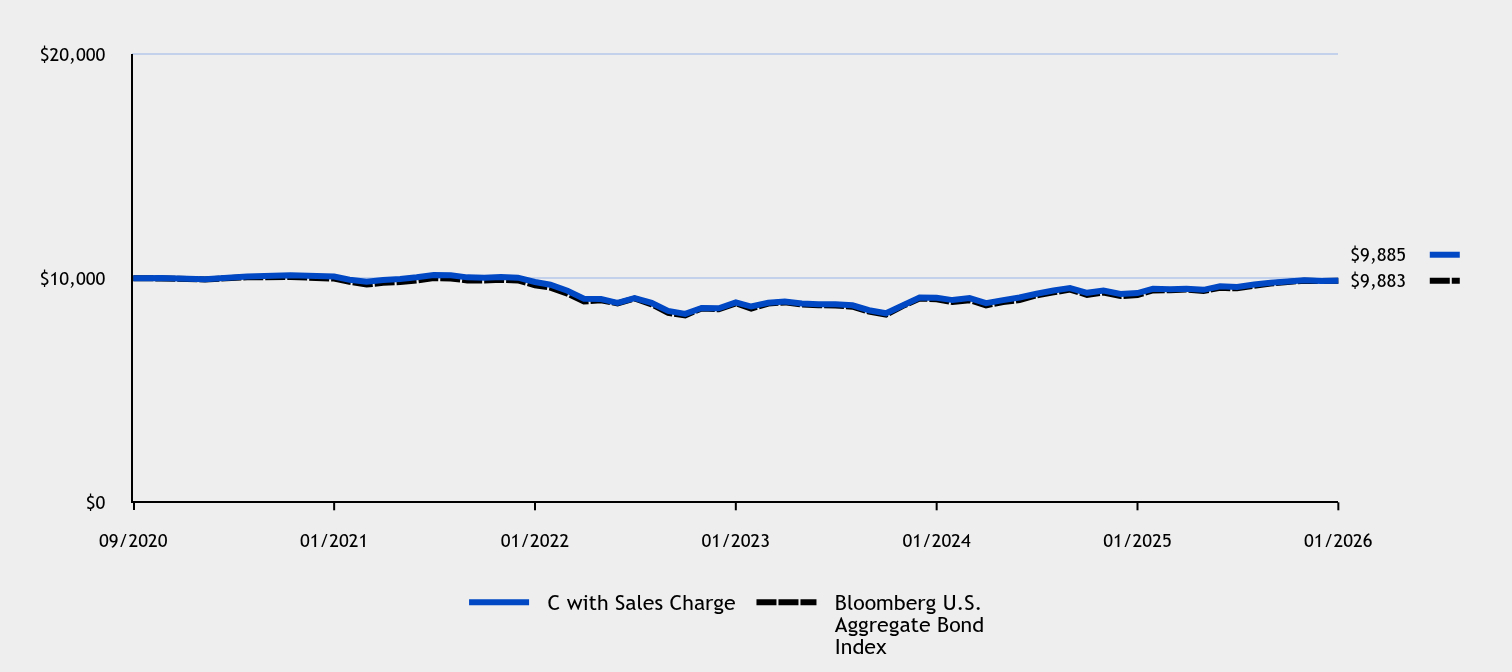
Table Summary
|
C with Sales Charge |
Bloomberg U.S. Aggregate Bond Index |
09/2020 |
$10,000 |
$10,000 |
09/2020 |
$10,010 |
$9,987 |
10/2020 |
$9,952 |
$9,942 |
11/2020 |
$10,069 |
$10,040 |
12/2020 |
$10,125 |
$10,053 |
01/2021 |
$10,072 |
$9,981 |
02/2021 |
$9,929 |
$9,837 |
03/2021 |
$9,837 |
$9,714 |
04/2021 |
$9,917 |
$9,791 |
05/2021 |
$9,958 |
$9,823 |
06/2021 |
$10,038 |
$9,892 |
07/2021 |
$10,139 |
$10,003 |
08/2021 |
$10,127 |
$9,984 |
09/2021 |
$10,035 |
$9,897 |
10/2021 |
$10,023 |
$9,895 |
11/2021 |
$10,053 |
$9,924 |
12/2021 |
$10,022 |
$9,898 |
01/2022 |
$9,830 |
$9,685 |
02/2022 |
$9,709 |
$9,577 |
03/2022 |
$9,437 |
$9,311 |
04/2022 |
$9,084 |
$8,958 |
05/2022 |
$9,068 |
$9,015 |
06/2022 |
$8,898 |
$8,874 |
07/2022 |
$9,107 |
$9,091 |
08/2022 |
$8,895 |
$8,834 |
09/2022 |
$8,541 |
$8,452 |
10/2022 |
$8,405 |
$8,343 |
11/2022 |
$8,669 |
$8,650 |
12/2022 |
$8,657 |
$8,611 |
01/2023 |
$8,923 |
$8,876 |
02/2023 |
$8,734 |
$8,646 |
03/2023 |
$8,899 |
$8,866 |
04/2023 |
$8,960 |
$8,919 |
05/2023 |
$8,865 |
$8,822 |
06/2023 |
$8,833 |
$8,791 |
07/2023 |
$8,833 |
$8,785 |
08/2023 |
$8,791 |
$8,729 |
09/2023 |
$8,570 |
$8,507 |
10/2023 |
$8,434 |
$8,373 |
11/2023 |
$8,783 |
$8,752 |
12/2023 |
$9,134 |
$9,087 |
01/2024 |
$9,126 |
$9,062 |
02/2024 |
$9,021 |
$8,934 |
03/2024 |
$9,109 |
$9,016 |
04/2024 |
$8,886 |
$8,788 |
05/2024 |
$9,018 |
$8,937 |
06/2024 |
$9,139 |
$9,022 |
07/2024 |
$9,305 |
$9,233 |
08/2024 |
$9,451 |
$9,365 |
09/2024 |
$9,561 |
$9,491 |
10/2024 |
$9,345 |
$9,256 |
11/2024 |
$9,447 |
$9,353 |
12/2024 |
$9,298 |
$9,200 |
01/2025 |
$9,334 |
$9,249 |
02/2025 |
$9,523 |
$9,453 |
03/2025 |
$9,503 |
$9,456 |
04/2025 |
$9,529 |
$9,493 |
05/2025 |
$9,479 |
$9,425 |
06/2025 |
$9,638 |
$9,570 |
07/2025 |
$9,608 |
$9,545 |
08/2025 |
$9,715 |
$9,659 |
09/2025 |
$9,797 |
$9,765 |
10/2025 |
$9,848 |
$9,826 |
11/2025 |
$9,907 |
$9,887 |
12/2025 |
$9,869 |
$9,872 |
01/2026 |
$9,885 |
$9,883 |
|
|
| Average Annual Return [Table Text Block] |
Table Summary
Average Annual Total Returns (%) |
1 Year |
5 Years |
Since Inception (9/10/20) |
Class C without Deferred Sales ChargeFootnote Reference1 |
5.90% |
(0.38)% |
(0.21)% |
Class C with Maximum Deferred Sales Charge -1.00%Footnote Reference1 |
4.90% |
(0.38)% |
(0.21)% |
Bloomberg U.S. Aggregate Bond Index |
6.85% |
(0.20)% |
(0.20)% | |
|
| Performance Inception Date |
Sep. 10, 2020
|
|
| No Deduction of Taxes [Text Block] |
The graph and table do not reflect the deduction of taxes that a shareholder would pay on fund distributions or redemption of fund shares.
|
|
| AssetsNet |
$ 8,172,347
|
|
| Holdings Count | Holding |
427
|
|
| Advisory Fees Paid, Amount |
$ 0
|
|
| InvestmentCompanyPortfolioTurnover |
80.00%
|
|
| Additional Fund Statistics [Text Block] |
Table Summary
Total Net Assets |
$8,172,347 |
# of Portfolio Holdings |
427 |
Portfolio Turnover Rate |
80% |
Total Management Fees Paid |
$0 | |
|
| Holdings [Text Block] |
Asset Allocation - % Investments
Table Summary
Value |
Value |
Corporate Obligations |
30.5 |
U.S. Treasury Obligations |
24.4 |
Collateralized Mortgage Obligations |
12.3 |
Asset-Backed Obligations |
10.9 |
U.S. Agency Mortgage-Backed Obligations |
8.0 |
Commercial Mortgage-Backed Obligations |
6.7 |
Municipal Obligations |
4.1 |
Foreign Corporate Obligations |
2.8 |
Foreign Sovereign Obligations |
0.3 | Top Ten Country Exposure - % Investments
Table Summary
Value |
Value |
Cameroon |
0.1 |
Brazil |
0.1 |
Bermuda |
0.1 |
China |
0.2 |
France |
0.2 |
Mexico |
0.3 |
United Kingdom |
0.4 |
Ireland |
0.6 |
Canada |
1.3 |
United States |
96.7 | Top Ten Industry Allocations - % Investments
Table Summary
Value |
Value |
Insurance |
2.9 |
Diversified Financial Services |
3.9 |
Electric |
3.9 |
Municipal |
4.1 |
Banks |
4.7 |
Commercial MBS |
6.7 |
UMBS Collateral |
7.2 |
Asset-Backed Obligations |
10.9 |
Collateralized Mortgage Obligations |
12.3 |
U.S. Treasury Obligations |
24.4 | |
|
| Largest Holdings [Text Block] |
Top Ten Holdings - % Net Assets
Table Summary
U.S. Treasury Bonds, 3.375%, Due 11/15/2048 |
5.2 |
U.S. Treasury Notes, 4.250%, Due 8/15/2035 |
4.6 |
U.S. Treasury Notes, 4.500%, Due 11/15/2033 |
2.2 |
U.S. Treasury Notes, 4.000%, Due 11/15/2035 |
2.1 |
RCKT Mortgage Trust, Series 2023-CES1, 6.902%, Due 6/25/2043, Class M1 |
1.9 |
U.S. Treasury Bonds, 1.750%, Due 8/15/2041 |
1.8 |
U.S. Treasury Bonds, 4.875%, Due 8/15/2045 |
1.5 |
U.S. Treasury Bonds, 2.500%, Due 2/15/2045 |
1.4 |
U.S. Treasury Notes, 2.875%, Due 5/15/2032 |
1.3 |
U.S. Treasury Bonds, 4.750%, Due 2/15/2045 |
1.1 | |
|
| Material Fund Change [Text Block] |
|
|
| C000221415 |
|
|
| Shareholder Report [Line Items] |
|
|
| Fund Name |
NIS Core Plus Bond Fund
|
|
| Class Name |
R6
|
|
| Trading Symbol |
NISRX
|
|
| Annual or Semi-Annual Statement [Text Block] |
This annual shareholder report contains important information about American Beacon NIS Core Plus Bond Fund for the period of February 1, 2025 to January 31, 2026.
|
|
| Additional Information [Text Block] |
You can find additional information about the Fund at www.americanbeaconfunds.com/fund-resources/. You can request this information by contacting us at 800-658-5811.
|
|
| Additional Information Phone Number |
800-658-5811
|
|
| Additional Information Website |
www.americanbeaconfunds.com/fund-resources/
|
|
| Expenses [Text Block] |
What were the Fund costs for the last year?(based on a hypothetical $10,000 investment)
Table Summary
Class Name |
Costs of a $10,000 investment |
Costs paid as a percentage of a $10,000 investment |
R6 |
$45 |
0.44% | |
|
| Expenses Paid, Amount |
$ 45
|
|
| Expense Ratio, Percent |
0.44%
|
|
| Factors Affecting Performance [Text Block] |
How did the Fund perform and what affected its performance? The R6 Class of the Fund returned 7.06% for the twelve months ended January 31, 2026, compared to the Bloomberg U.S. Aggregate Bond Index return of 6.85%. • The investment strategy of the Fund’s sub-advisor utilizes both bottom-up and top-down inputs to select the best relative value securities available across a broad range of domestic fixed income sectors. • The period benefited from an improving policy and credit backdrop, as the Federal Reserve cut rates three times from September through December, supporting fixed income and credit assets overall, despite a rocky market environment in early April surrounding Liberation Day. • Corporate Bonds were the largest positive contributors to performance, followed by U.S. Treasuries, Mortgage‑Backed Securities, and Asset‑Backed Securities, reflecting broad strength across fixed income sectors during the period. |
|
| Performance Past Does Not Indicate Future [Text] |
Performance shown is historical and is not indicative of future returns.
|
|
| Line Graph [Table Text Block] |
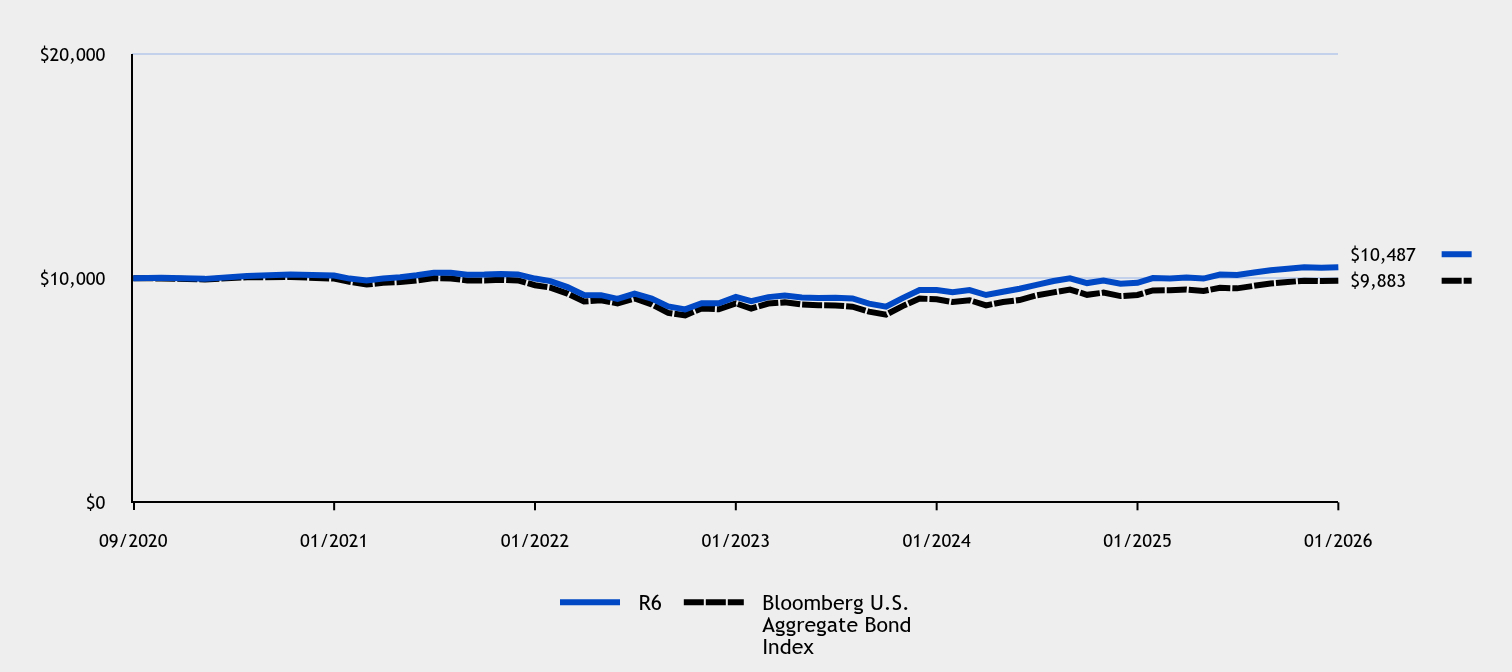
Table Summary
|
R6 |
Bloomberg U.S. Aggregate Bond Index |
09/2020 |
$10,000 |
$10,000 |
09/2020 |
$10,014 |
$9,987 |
10/2020 |
$9,968 |
$9,942 |
11/2020 |
$10,094 |
$10,040 |
12/2020 |
$10,160 |
$10,053 |
01/2021 |
$10,116 |
$9,981 |
02/2021 |
$9,980 |
$9,837 |
03/2021 |
$9,898 |
$9,714 |
04/2021 |
$9,987 |
$9,791 |
05/2021 |
$10,037 |
$9,823 |
06/2021 |
$10,127 |
$9,892 |
07/2021 |
$10,238 |
$10,003 |
08/2021 |
$10,236 |
$9,984 |
09/2021 |
$10,152 |
$9,897 |
10/2021 |
$10,160 |
$9,895 |
11/2021 |
$10,189 |
$9,924 |
12/2021 |
$10,167 |
$9,898 |
01/2022 |
$9,981 |
$9,685 |
02/2022 |
$9,868 |
$9,577 |
03/2022 |
$9,600 |
$9,311 |
04/2022 |
$9,249 |
$8,958 |
05/2022 |
$9,241 |
$9,015 |
06/2022 |
$9,077 |
$8,874 |
07/2022 |
$9,309 |
$9,091 |
08/2022 |
$9,090 |
$8,834 |
09/2022 |
$8,737 |
$8,452 |
10/2022 |
$8,605 |
$8,343 |
11/2022 |
$8,884 |
$8,650 |
12/2022 |
$8,879 |
$8,611 |
01/2023 |
$9,161 |
$8,876 |
02/2023 |
$8,974 |
$8,646 |
03/2023 |
$9,153 |
$8,866 |
04/2023 |
$9,223 |
$8,919 |
05/2023 |
$9,135 |
$8,822 |
06/2023 |
$9,120 |
$8,791 |
07/2023 |
$9,129 |
$8,785 |
08/2023 |
$9,094 |
$8,729 |
09/2023 |
$8,863 |
$8,507 |
10/2023 |
$8,731 |
$8,373 |
11/2023 |
$9,111 |
$8,752 |
12/2023 |
$9,472 |
$9,087 |
01/2024 |
$9,472 |
$9,062 |
02/2024 |
$9,371 |
$8,934 |
03/2024 |
$9,471 |
$9,016 |
04/2024 |
$9,248 |
$8,788 |
05/2024 |
$9,394 |
$8,937 |
06/2024 |
$9,530 |
$9,022 |
07/2024 |
$9,700 |
$9,233 |
08/2024 |
$9,873 |
$9,365 |
09/2024 |
$9,996 |
$9,491 |
10/2024 |
$9,780 |
$9,256 |
11/2024 |
$9,896 |
$9,353 |
12/2024 |
$9,748 |
$9,200 |
01/2025 |
$9,795 |
$9,249 |
02/2025 |
$10,002 |
$9,453 |
03/2025 |
$9,990 |
$9,456 |
04/2025 |
$10,026 |
$9,493 |
05/2025 |
$9,982 |
$9,425 |
06/2025 |
$10,158 |
$9,570 |
07/2025 |
$10,137 |
$9,545 |
08/2025 |
$10,248 |
$9,659 |
09/2025 |
$10,355 |
$9,765 |
10/2025 |
$10,419 |
$9,826 |
11/2025 |
$10,490 |
$9,887 |
12/2025 |
$10,461 |
$9,872 |
01/2026 |
$10,487 |
$9,883 |
|
|
| Average Annual Return [Table Text Block] |
Table Summary
Average Annual Total Returns (%) |
1 Year |
5 Years |
Since Inception (9/10/20) |
R6 ClassFootnote Reference1 |
7.06% |
0.72% |
0.89% |
Bloomberg U.S. Aggregate Bond Index |
6.85% |
(0.20)% |
(0.20)% | |
|
| Performance Inception Date |
Sep. 10, 2020
|
|
| No Deduction of Taxes [Text Block] |
The graph and table do not reflect the deduction of taxes that a shareholder would pay on fund distributions or redemption of fund shares.
|
|
| AssetsNet |
$ 8,172,347
|
|
| Holdings Count | Holding |
427
|
|
| Advisory Fees Paid, Amount |
$ 0
|
|
| InvestmentCompanyPortfolioTurnover |
80.00%
|
|
| Additional Fund Statistics [Text Block] |
Table Summary
Total Net Assets |
$8,172,347 |
# of Portfolio Holdings |
427 |
Portfolio Turnover Rate |
80% |
Total Management Fees Paid |
$0 | |
|
| Holdings [Text Block] |
Asset Allocation - % Investments
Table Summary
Value |
Value |
Corporate Obligations |
30.5 |
U.S. Treasury Obligations |
24.4 |
Collateralized Mortgage Obligations |
12.3 |
Asset-Backed Obligations |
10.9 |
U.S. Agency Mortgage-Backed Obligations |
8.0 |
Commercial Mortgage-Backed Obligations |
6.7 |
Municipal Obligations |
4.1 |
Foreign Corporate Obligations |
2.8 |
Foreign Sovereign Obligations |
0.3 | Top Ten Country Exposure - % Investments
Table Summary
Value |
Value |
Cameroon |
0.1 |
Brazil |
0.1 |
Bermuda |
0.1 |
China |
0.2 |
France |
0.2 |
Mexico |
0.3 |
United Kingdom |
0.4 |
Ireland |
0.6 |
Canada |
1.3 |
United States |
96.7 | Top Ten Industry Allocations - % Investments
Table Summary
Value |
Value |
Insurance |
2.9 |
Diversified Financial Services |
3.9 |
Electric |
3.9 |
Municipal |
4.1 |
Banks |
4.7 |
Commercial MBS |
6.7 |
UMBS Collateral |
7.2 |
Asset-Backed Obligations |
10.9 |
Collateralized Mortgage Obligations |
12.3 |
U.S. Treasury Obligations |
24.4 | |
|
| Largest Holdings [Text Block] |
Top Ten Holdings - % Net Assets
Table Summary
U.S. Treasury Bonds, 3.375%, Due 11/15/2048 |
5.2 |
U.S. Treasury Notes, 4.250%, Due 8/15/2035 |
4.6 |
U.S. Treasury Notes, 4.500%, Due 11/15/2033 |
2.2 |
U.S. Treasury Notes, 4.000%, Due 11/15/2035 |
2.1 |
RCKT Mortgage Trust, Series 2023-CES1, 6.902%, Due 6/25/2043, Class M1 |
1.9 |
U.S. Treasury Bonds, 1.750%, Due 8/15/2041 |
1.8 |
U.S. Treasury Bonds, 4.875%, Due 8/15/2045 |
1.5 |
U.S. Treasury Bonds, 2.500%, Due 2/15/2045 |
1.4 |
U.S. Treasury Notes, 2.875%, Due 5/15/2032 |
1.3 |
U.S. Treasury Bonds, 4.750%, Due 2/15/2045 |
1.1 | |
|
| Material Fund Change [Text Block] |
|
|
| C000221416 |
|
|
| Shareholder Report [Line Items] |
|
|
| Fund Name |
NIS Core Plus Bond Fund
|
|
| Class Name |
Y
|
|
| Trading Symbol |
NISYX
|
|
| Annual or Semi-Annual Statement [Text Block] |
This annual shareholder report contains important information about American Beacon NIS Core Plus Bond Fund for the period of February 1, 2025 to January 31, 2026.
|
|
| Additional Information [Text Block] |
You can find additional information about the Fund at www.americanbeaconfunds.com/fund-resources/. You can request this information by contacting us at 800-658-5811.
|
|
| Additional Information Phone Number |
800-658-5811
|
|
| Additional Information Website |
www.americanbeaconfunds.com/fund-resources/
|
|
| Expenses [Text Block] |
What were the Fund costs for the last year?(based on a hypothetical $10,000 investment)
Table Summary
Class Name |
Costs of a $10,000 investment |
Costs paid as a percentage of a $10,000 investment |
Y |
$56 |
0.54% | |
|
| Expenses Paid, Amount |
$ 56
|
|
| Expense Ratio, Percent |
0.54%
|
|
| Factors Affecting Performance [Text Block] |
How did the Fund perform and what affected its performance? The Y Class of the Fund returned 6.95% for the twelve months ended January 31, 2026, compared to the Bloomberg U.S. Aggregate Bond Index return of 6.85%. • The investment strategy of the Fund’s sub-advisor utilizes both bottom-up and top-down inputs to select the best relative value securities available across a broad range of domestic fixed income sectors. • The period benefited from an improving policy and credit backdrop, as the Federal Reserve cut rates three times from September through December, supporting fixed income and credit assets overall, despite a rocky market environment in early April surrounding Liberation Day. • Corporate Bonds were the largest positive contributors to performance, followed by U.S. Treasuries, Mortgage‑Backed Securities, and Asset‑Backed Securities, reflecting broad strength across fixed income sectors during the period. |
|
| Performance Past Does Not Indicate Future [Text] |
Performance shown is historical and is not indicative of future returns.
|
|
| Line Graph [Table Text Block] |
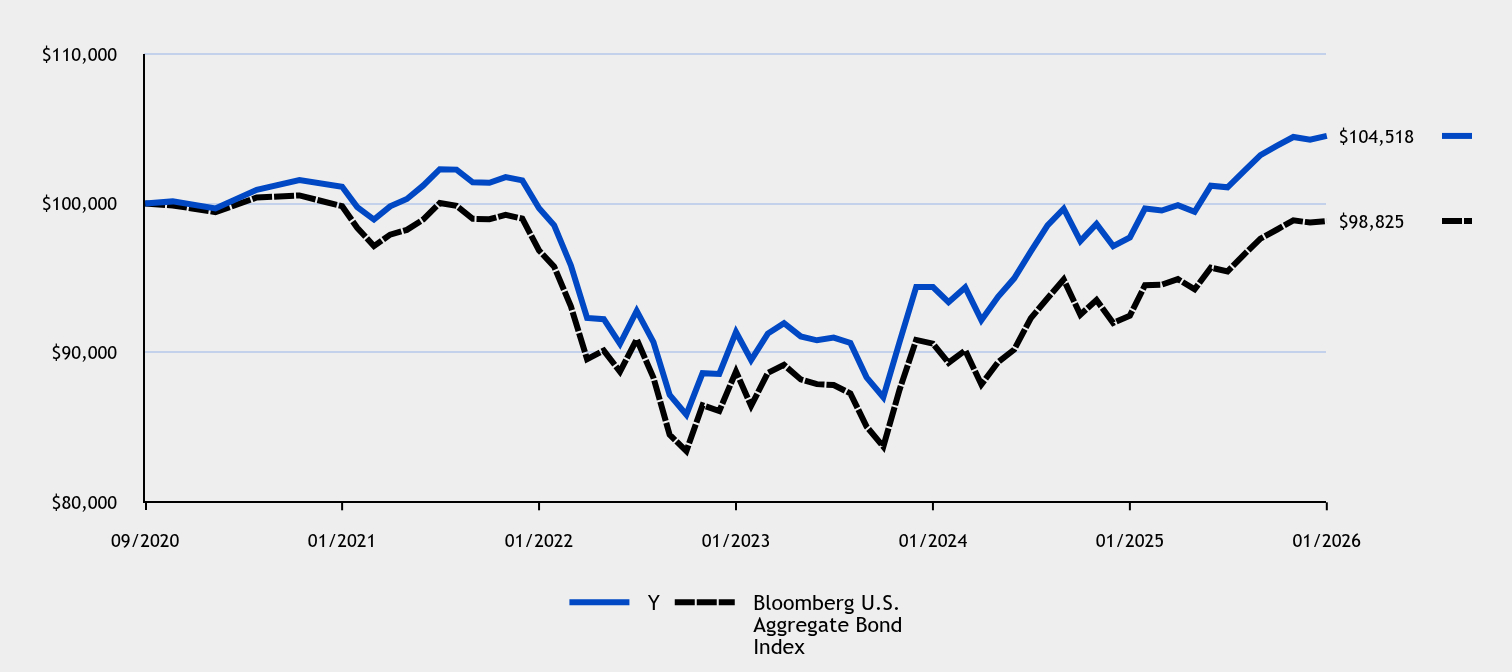
Table Summary
#ERROR:A result could not be returned because the conditional could not be evaluated to a True/False value (#ERROR:Invalid Formula (#!=""), 'Multiple values from an iterator cannot be used in a formula unless they are aggregrated.') |
Y |
Bloomberg U.S. Aggregate Bond Index |
09/2020 |
$100,000 |
$100,000 |
09/2020 |
$100,137 |
$99,866 |
10/2020 |
$99,663 |
$99,420 |
11/2020 |
$100,915 |
$100,396 |
12/2020 |
$101,565 |
$100,534 |
01/2021 |
$101,121 |
$99,814 |
02/2021 |
$99,753 |
$98,372 |
03/2021 |
$98,921 |
$97,144 |
04/2021 |
$99,808 |
$97,911 |
05/2021 |
$100,297 |
$98,231 |
06/2021 |
$101,189 |
$98,921 |
07/2021 |
$102,292 |
$100,027 |
08/2021 |
$102,263 |
$99,837 |
09/2021 |
$101,412 |
$98,973 |
10/2021 |
$101,380 |
$98,945 |
11/2021 |
$101,762 |
$99,238 |
12/2021 |
$101,541 |
$98,984 |
01/2022 |
$99,675 |
$96,852 |
02/2022 |
$98,531 |
$95,771 |
03/2022 |
$95,849 |
$93,110 |
04/2022 |
$92,340 |
$89,577 |
05/2022 |
$92,253 |
$90,155 |
06/2022 |
$90,603 |
$88,740 |
07/2022 |
$92,807 |
$90,909 |
08/2022 |
$90,724 |
$88,340 |
09/2022 |
$87,189 |
$84,523 |
10/2022 |
$85,867 |
$83,428 |
11/2022 |
$88,642 |
$86,496 |
12/2022 |
$88,587 |
$86,106 |
01/2023 |
$91,390 |
$88,755 |
02/2023 |
$89,520 |
$86,460 |
03/2023 |
$91,292 |
$88,657 |
04/2023 |
$91,991 |
$89,194 |
05/2023 |
$91,099 |
$88,223 |
06/2023 |
$90,841 |
$87,908 |
07/2023 |
$91,023 |
$87,847 |
08/2023 |
$90,668 |
$87,286 |
09/2023 |
$88,360 |
$85,068 |
10/2023 |
$87,033 |
$83,725 |
11/2023 |
$90,709 |
$87,517 |
12/2023 |
$94,408 |
$90,867 |
01/2024 |
$94,401 |
$90,617 |
02/2024 |
$93,388 |
$89,337 |
03/2024 |
$94,378 |
$90,162 |
04/2024 |
$92,188 |
$87,885 |
05/2024 |
$93,750 |
$89,375 |
06/2024 |
$94,987 |
$90,221 |
07/2024 |
$96,788 |
$92,328 |
08/2024 |
$98,533 |
$93,655 |
09/2024 |
$99,645 |
$94,909 |
10/2024 |
$97,483 |
$92,555 |
11/2024 |
$98,629 |
$93,534 |
12/2024 |
$97,143 |
$92,003 |
01/2025 |
$97,722 |
$92,491 |
02/2025 |
$99,659 |
$94,526 |
03/2025 |
$99,528 |
$94,561 |
04/2025 |
$99,883 |
$94,933 |
05/2025 |
$99,440 |
$94,253 |
06/2025 |
$101,186 |
$95,703 |
07/2025 |
$101,081 |
$95,450 |
08/2025 |
$102,177 |
$96,592 |
09/2025 |
$103,238 |
$97,646 |
10/2025 |
$103,867 |
$98,256 |
11/2025 |
$104,447 |
$98,866 |
12/2025 |
$104,262 |
$98,720 |
01/2026 |
$104,518 |
$98,825 |
|
|
| Average Annual Return [Table Text Block] |
Table Summary
Average Annual Total Returns (%) |
1 Year |
5 Years |
Since Inception (9/10/20) |
Class YFootnote Reference1 |
6.95% |
0.66% |
0.82% |
Bloomberg U.S. Aggregate Bond Index |
6.85% |
(0.20)% |
(0.20)% | |
|
| Performance Inception Date |
Sep. 10, 2020
|
|
| No Deduction of Taxes [Text Block] |
The graph and table do not reflect the deduction of taxes that a shareholder would pay on fund distributions or redemption of fund shares.
|
|
| AssetsNet |
$ 8,172,347
|
|
| Holdings Count | Holding |
427
|
|
| Advisory Fees Paid, Amount |
$ 0
|
|
| InvestmentCompanyPortfolioTurnover |
80.00%
|
|
| Additional Fund Statistics [Text Block] |
Table Summary
Total Net Assets |
$8,172,347 |
# of Portfolio Holdings |
427 |
Portfolio Turnover Rate |
80% |
Total Management Fees Paid |
$0 | |
|
| Holdings [Text Block] |
Asset Allocation - % Investments
Table Summary
Value |
Value |
Corporate Obligations |
30.5 |
U.S. Treasury Obligations |
24.4 |
Collateralized Mortgage Obligations |
12.3 |
Asset-Backed Obligations |
10.9 |
U.S. Agency Mortgage-Backed Obligations |
8.0 |
Commercial Mortgage-Backed Obligations |
6.7 |
Municipal Obligations |
4.1 |
Foreign Corporate Obligations |
2.8 |
Foreign Sovereign Obligations |
0.3 | Top Ten Country Exposure - % Investments
Table Summary
Value |
Value |
Cameroon |
0.1 |
Brazil |
0.1 |
Bermuda |
0.1 |
China |
0.2 |
France |
0.2 |
Mexico |
0.3 |
United Kingdom |
0.4 |
Ireland |
0.6 |
Canada |
1.3 |
United States |
96.7 | Top Ten Industry Allocations - % Investments
Table Summary
Value |
Value |
Insurance |
2.9 |
Diversified Financial Services |
3.9 |
Electric |
3.9 |
Municipal |
4.1 |
Banks |
4.7 |
Commercial MBS |
6.7 |
UMBS Collateral |
7.2 |
Asset-Backed Obligations |
10.9 |
Collateralized Mortgage Obligations |
12.3 |
U.S. Treasury Obligations |
24.4 | |
|
| Largest Holdings [Text Block] |
Top Ten Holdings - % Net Assets
Table Summary
U.S. Treasury Bonds, 3.375%, Due 11/15/2048 |
5.2 |
U.S. Treasury Notes, 4.250%, Due 8/15/2035 |
4.6 |
U.S. Treasury Notes, 4.500%, Due 11/15/2033 |
2.2 |
U.S. Treasury Notes, 4.000%, Due 11/15/2035 |
2.1 |
RCKT Mortgage Trust, Series 2023-CES1, 6.902%, Due 6/25/2043, Class M1 |
1.9 |
U.S. Treasury Bonds, 1.750%, Due 8/15/2041 |
1.8 |
U.S. Treasury Bonds, 4.875%, Due 8/15/2045 |
1.5 |
U.S. Treasury Bonds, 2.500%, Due 2/15/2045 |
1.4 |
U.S. Treasury Notes, 2.875%, Due 5/15/2032 |
1.3 |
U.S. Treasury Bonds, 4.750%, Due 2/15/2045 |
1.1 | |
|
| Material Fund Change [Text Block] |
|
|