Fiscal Year |
Summary Compensation Table Total for PEO1 ($) |
|
Compensation Actually Paid to PEO1,2,3 ($) |
|
Average Summary Compensation Table Total for Non-PEO NEOS1 ($) |
|
Average Compensation Actually Paid to Non-PEO NEOS1,2,3 ($) |
|
Value of Initial Fixed $100 Investment based on TSR4 |
|
Net Loss |
|
Company selected measures ($) |
|
||||||||||
|
|
|
|
|
|
|
|
|
Total Shareholder Return |
|
Peer Group Total Shareholder Return |
|
|
|
|
|
||||||||
2025 |
|
21,269,833 |
|
|
7,500,137 |
|
|
5,149,372 |
|
|
2,368,025 |
|
|
624.87 |
|
|
124.75 |
|
|
(359.6 |
) |
|
— |
|
2024 |
|
14,298,554 |
|
|
106,752,387 |
|
|
4,692,394 |
|
|
24,096,054 |
|
|
714.74 |
|
|
93.49 |
|
|
(110.0 |
) |
|
— |
|
2023 |
|
12,628,061 |
|
|
36,947,671 |
|
|
3,503,457 |
|
|
9,571,497 |
|
|
330.55 |
|
|
94.03 |
|
|
(85.9 |
) |
|
— |
|
2022 |
|
5,411,291 |
|
|
13,264,512 |
|
|
1,881,353 |
|
|
3,867,364 |
|
|
166.96 |
|
|
89.90 |
|
|
(68.9 |
) |
|
— |
|
2021 |
|
4,059,119 |
|
|
2,805,866 |
|
|
1,426,477 |
|
|
1,147,131 |
|
|
81.71 |
|
|
100.02 |
|
|
(55.0 |
) |
|
— |
|
1. For each of the fiscal years presented in the table above, Brian Lian was our only PEO. The individuals comprising the Non-PEO NEOs for each of the fiscal years presented in the table above are Marianne Mancini and Greg Zante.
2. Represents the amount of the CAP to our PEO or the Non-PEO NEOs, as computed in accordance with Item 402(v) of Regulation S-K, and does not reflect compensation actually earned, realized or received by our PEO or the Non-PEO NEOs during the applicable fiscal year. These amounts reflect the total amount of compensation for our NEOs reported in the Summary Compensation Table, with certain adjustments as described in footnote 3 below.
3. The following table summarizes the adjustments required to be made to the amounts reported in the Summary Compensation Table for the applicable fiscal year in accordance with Item 402(v) of Regulation S-K in order to determine the amounts shown in the table above as being the CAP. Equity values are calculated in accordance with FASB ASC Topic 718.
Fiscal Year |
Summary Compensation Table Total for PEO ($) |
|
Exclusion of Stock Awards and Option Awards for PEO ($)(a) |
|
Inclusion of Equity Values for PEO ($)(b) |
|
Compensation Actually Paid to PEO ($)(c) |
|
||||
2025 |
|
21,269,833 |
|
|
(20,224,833 |
) |
|
6,455,137 |
|
|
7,500,137 |
|
2024 |
|
14,298,554 |
|
|
(13,104,806 |
) |
|
105,558,639 |
|
|
106,752,387 |
|
2023 |
|
12,628,061 |
|
|
(11,640,961 |
) |
|
35,960,571 |
|
|
36,947,671 |
|
2022 |
|
5,411,291 |
|
|
(4,446,176 |
) |
|
12,299,397 |
|
|
13,264,512 |
|
2021 |
|
4,059,119 |
|
|
(3,187,119 |
) |
|
1,933,866 |
|
|
2,805,866 |
|
Fiscal Year |
Average Summary Compensation Table Total for Non-PEO NEOs ($) |
|
Average Exclusion of Stock Awards and Option Awards for Non-PEO NEOs ($)(d) |
|
Average Inclusion of Equity Values for Non-PEO NEOs ($)(e) |
|
Average Compensation Actually Paid to Non-PEO NEOs ($)(c) |
|
||||
2025 |
|
5,149,372 |
|
|
(4,397,872 |
) |
|
1,616,525 |
|
|
2,368,025 |
|
2024 |
|
4,692,394 |
|
|
(3,968,394 |
) |
|
23,372,054 |
|
|
24,096,054 |
|
2023 |
|
3,503,457 |
|
|
(2,840,957 |
) |
|
8,908,997 |
|
|
9,571,497 |
|
2022 |
|
1,881,353 |
|
|
(1,262,944 |
) |
|
3,248,955 |
|
|
3,867,364 |
|
2021 |
|
1,426,477 |
|
|
(886,977 |
) |
|
607,631 |
|
|
1,147,131 |
|
(a) Represents the aggregate amount of the “Stock Awards” and “Option Awards” columns for our PEO reported in the Summary Compensation Table for the applicable fiscal year.
(b) Amounts reported in this column are derived from the amounts set forth in the following table for the applicable fiscal year:
Fiscal Year |
Year-End Fair Value of Equity Awards Granted During the Year That Remained Unvested as of the Last Day of the Year for PEO ($) |
|
Change in Fair Value from the Last Day of the Prior Year to the Last Day of the Year of Unvested Equity Awards for PEO ($) |
|
Fair Value of Vested Awards Granted and Vested in Current Fiscal Year for PEO ($) |
|
Change in Fair Value from the Last Day of the Prior Year to the Vesting Date of Unvested Equity Awards that Vested During the Year for PEO ($) |
|
Total - Inclusion of |
|
|||||
2025 |
|
7,844,173 |
|
|
(8,908,143 |
) |
|
3,857,909 |
|
|
3,661,198 |
|
|
6,455,137 |
|
2024 |
|
36,416,127 |
|
|
26,094,769 |
|
|
10,004,146 |
|
|
33,043,597 |
|
|
105,558,639 |
|
2023 |
|
29,034,103 |
|
|
5,163,877 |
|
|
— |
|
|
1,762,591 |
|
|
35,960,571 |
|
2022 |
|
8,750,448 |
|
|
3,011,128 |
|
|
— |
|
|
537,821 |
|
|
12,299,397 |
|
2021 |
|
2,472,781 |
|
|
(633,970 |
) |
|
— |
|
|
95,055 |
|
|
1,933,866 |
|
(c) The following adjustments are not applicable and are therefore omitted: (i) the fair value as of the vesting date for awards that are granted and vest in the same year, (ii) the amount equal to the fair value at the end of the prior fiscal year for any awards granted in any prior fiscal year that fail to meet the applicable vesting conditions during the covered fiscal year and (iii) the
dollar value of any dividends or other earnings paid on stock or option awards in the covered fiscal year prior to the vesting date that are not otherwise included in the total compensation for the covered fiscal year.
(d) Represents the average of the aggregate amount of the “Stock Awards” and “Option Awards” columns for the Non-PEO NEOs reported in the Summary Compensation Table for the applicable fiscal year.
(e) Amounts reported in this column are derived from the amounts set forth in the following table for the applicable fiscal year:
Fiscal Year |
Average Year-End Fair Value of Equity Awards Granted During the Year That Remained Unvested as of the Last Day of the Year for Non-PEO NEOs ($) |
|
Average Change in Fair Value from the Last Day of the Prior Year to the Last Day of the Year of Unvested Equity Awards for Non-PEO NEOs ($) |
|
Average Fair Value of Vested Awards Granted and Vested in Current Fiscal Year for Non-PEO NEOs ($) |
|
Average Change in Fair Value from the Last Day of the Prior Year to the Vesting Date of Unvested Equity Awards that Vested During the Year for Non-PEO NEOs ($) |
|
Total - Average Inclusion of |
|
|||||
2025 |
|
2,908,265 |
|
|
(2,457,323 |
) |
|
611,963 |
|
|
553,620 |
|
|
1,616,525 |
|
2024 |
|
9,849,955 |
|
|
7,046,548 |
|
|
1,327,104 |
|
|
5,148,447 |
|
|
23,372,054 |
|
2023 |
|
6,618,575 |
|
|
1,996,417 |
|
|
— |
|
|
294,005 |
|
|
8,908,997 |
|
2022 |
|
2,508,346 |
|
|
667,006 |
|
|
— |
|
|
73,603 |
|
|
3,248,955 |
|
2021 |
|
693,542 |
|
|
(113,247 |
) |
|
— |
|
|
27,336 |
|
|
607,631 |
|
4. The TSR assumes $100 was invested in the Company for the period from the beginning of the measurement period through the end of the listed measurement period. The TSR is calculated by dividing (i) the difference between the stock price at the end of each measurement period shown and the beginning of the measurement period by (ii) the stock price at the beginning of the measurement period. Historical stock performance is not necessarily indicative of future stock performance.
5. At this time, given that we are a research and development company without revenue, we do not use any specific company-selected financial measures for purposes of determining “Compensation Actually Paid.” As is the case with many companies in the biotechnology industry, our annual incentive objectives are generally tied to our clinical, program and regulatory metrics rather than financial goals. Accordingly, we do not have a financial metric in our executive compensation program that would constitute the Company Selected Measure, as contemplated under the SEC Pay Versus Performance disclosure rules, particularly as the pay versus performance table includes our TSR performance which is linked to the value of the equity awards held by our NEOs.
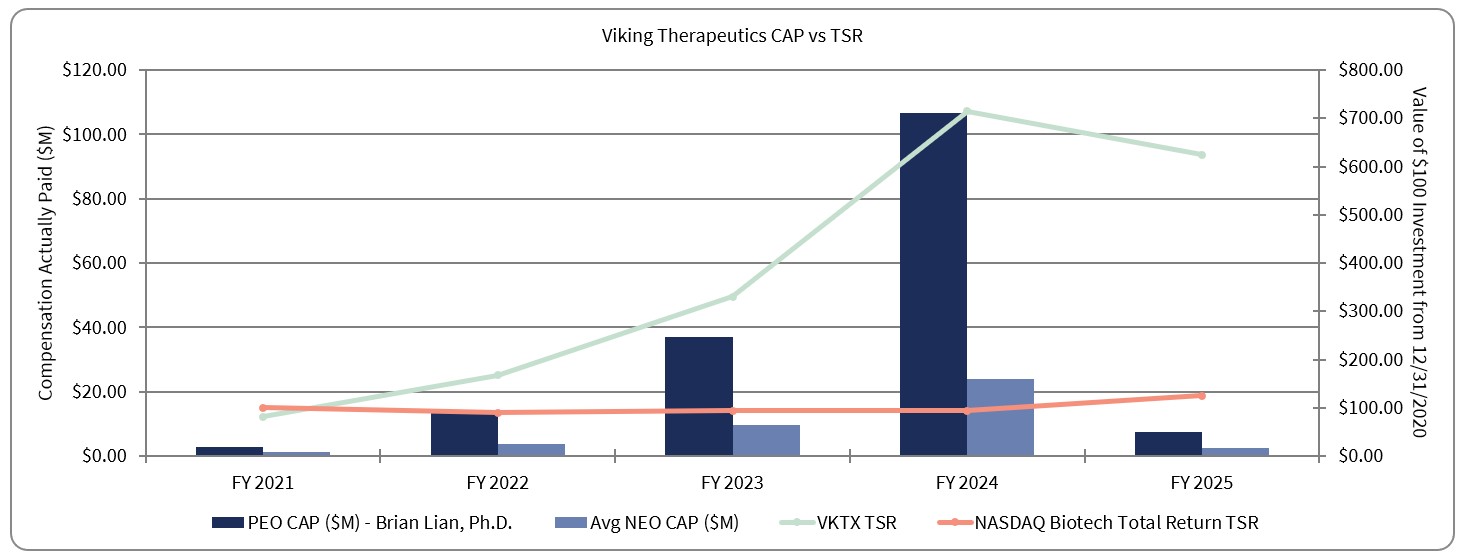
Description of Relationship Between the CAP to PEO and Non-PEO NEOs and the TSR
The following chart sets forth the relationship between the CAP to our PEO, the average of the CAP to our Non-PEO NEOs, and our cumulative TSR and Peer Group TSR over the five most recently completed fiscal years.
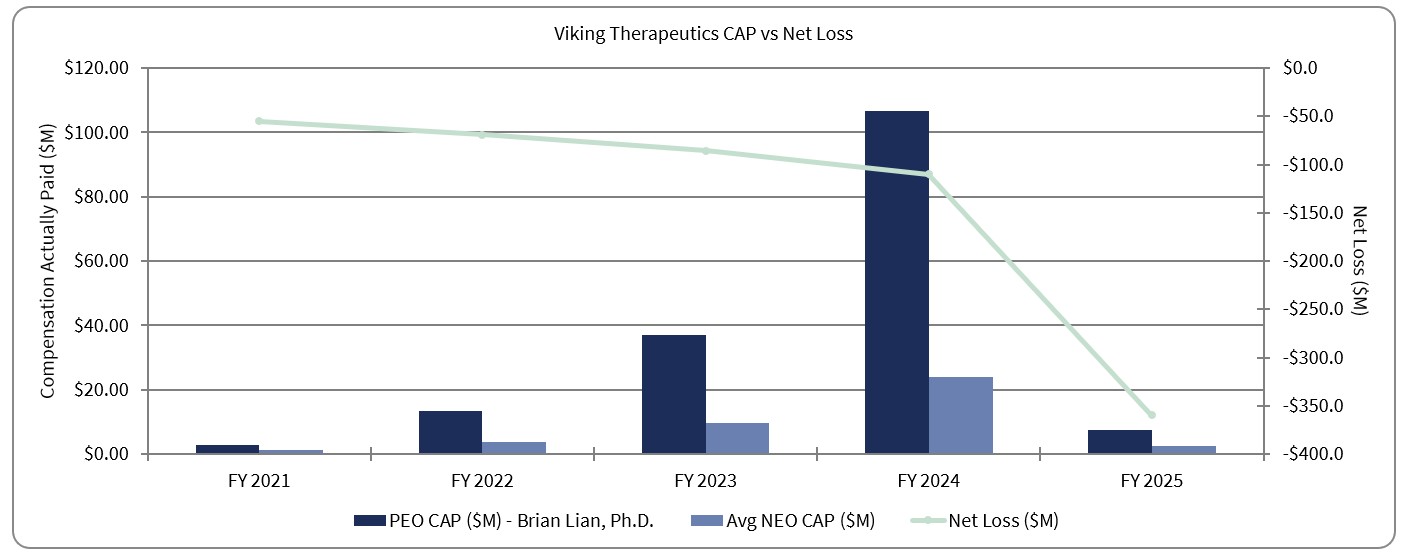
Description of Relationship Between the CAP to PEO and Non-PEO NEOs and Net Loss
The following chart sets forth the relationship between the CAP to our PEO, the average of the CAP to our Non-PEO NEOs, and our Net Loss during the five most recently completed fiscal years.
Tabular List of Most Important Financial Performance Measures
At this time, given that we are a research and development company without revenue, we do not use any specific company-selected financial measures for purposes of determining “Compensation Actually Paid.” As is the case with many companies in the biotechnology industry, our annual incentive objectives are generally tied to the Company’s clinical, program and regulatory metrics rather than financial goals. Accordingly, we have omitted the tabular list of financial performance measures. For further information regarding our compensation philosophy and how we seek to align executive compensation with our performance, see the “Executive Compensation” section of this proxy statement.
1. For each of the fiscal years presented in the table above, Brian Lian was our only PEO. The individuals comprising the Non-PEO NEOs for each of the fiscal years presented in the table above are Marianne Mancini and Greg Zante.
3. The following table summarizes the adjustments required to be made to the amounts reported in the Summary Compensation Table for the applicable fiscal year in accordance with Item 402(v) of Regulation S-K in order to determine the amounts shown in the table above as being the CAP. Equity values are calculated in accordance with FASB ASC Topic 718.
Fiscal Year |
Summary Compensation Table Total for PEO ($) |
|
Exclusion of Stock Awards and Option Awards for PEO ($)(a) |
|
Inclusion of Equity Values for PEO ($)(b) |
|
Compensation Actually Paid to PEO ($)(c) |
|
||||
2025 |
|
21,269,833 |
|
|
(20,224,833 |
) |
|
6,455,137 |
|
|
7,500,137 |
|
2024 |
|
14,298,554 |
|
|
(13,104,806 |
) |
|
105,558,639 |
|
|
106,752,387 |
|
2023 |
|
12,628,061 |
|
|
(11,640,961 |
) |
|
35,960,571 |
|
|
36,947,671 |
|
2022 |
|
5,411,291 |
|
|
(4,446,176 |
) |
|
12,299,397 |
|
|
13,264,512 |
|
2021 |
|
4,059,119 |
|
|
(3,187,119 |
) |
|
1,933,866 |
|
|
2,805,866 |
|
Fiscal Year |
Average Summary Compensation Table Total for Non-PEO NEOs ($) |
|
Average Exclusion of Stock Awards and Option Awards for Non-PEO NEOs ($)(d) |
|
Average Inclusion of Equity Values for Non-PEO NEOs ($)(e) |
|
Average Compensation Actually Paid to Non-PEO NEOs ($)(c) |
|
||||
2025 |
|
5,149,372 |
|
|
(4,397,872 |
) |
|
1,616,525 |
|
|
2,368,025 |
|
2024 |
|
4,692,394 |
|
|
(3,968,394 |
) |
|
23,372,054 |
|
|
24,096,054 |
|
2023 |
|
3,503,457 |
|
|
(2,840,957 |
) |
|
8,908,997 |
|
|
9,571,497 |
|
2022 |
|
1,881,353 |
|
|
(1,262,944 |
) |
|
3,248,955 |
|
|
3,867,364 |
|
2021 |
|
1,426,477 |
|
|
(886,977 |
) |
|
607,631 |
|
|
1,147,131 |
|
(b) Amounts reported in this column are derived from the amounts set forth in the following table for the applicable fiscal year:
Fiscal Year |
Year-End Fair Value of Equity Awards Granted During the Year That Remained Unvested as of the Last Day of the Year for PEO ($) |
|
Change in Fair Value from the Last Day of the Prior Year to the Last Day of the Year of Unvested Equity Awards for PEO ($) |
|
Fair Value of Vested Awards Granted and Vested in Current Fiscal Year for PEO ($) |
|
Change in Fair Value from the Last Day of the Prior Year to the Vesting Date of Unvested Equity Awards that Vested During the Year for PEO ($) |
|
Total - Inclusion of |
|
|||||
2025 |
|
7,844,173 |
|
|
(8,908,143 |
) |
|
3,857,909 |
|
|
3,661,198 |
|
|
6,455,137 |
|
2024 |
|
36,416,127 |
|
|
26,094,769 |
|
|
10,004,146 |
|
|
33,043,597 |
|
|
105,558,639 |
|
2023 |
|
29,034,103 |
|
|
5,163,877 |
|
|
— |
|
|
1,762,591 |
|
|
35,960,571 |
|
2022 |
|
8,750,448 |
|
|
3,011,128 |
|
|
— |
|
|
537,821 |
|
|
12,299,397 |
|
2021 |
|
2,472,781 |
|
|
(633,970 |
) |
|
— |
|
|
95,055 |
|
|
1,933,866 |
|
3. The following table summarizes the adjustments required to be made to the amounts reported in the Summary Compensation Table for the applicable fiscal year in accordance with Item 402(v) of Regulation S-K in order to determine the amounts shown in the table above as being the CAP. Equity values are calculated in accordance with FASB ASC Topic 718.
Fiscal Year |
Summary Compensation Table Total for PEO ($) |
|
Exclusion of Stock Awards and Option Awards for PEO ($)(a) |
|
Inclusion of Equity Values for PEO ($)(b) |
|
Compensation Actually Paid to PEO ($)(c) |
|
||||
2025 |
|
21,269,833 |
|
|
(20,224,833 |
) |
|
6,455,137 |
|
|
7,500,137 |
|
2024 |
|
14,298,554 |
|
|
(13,104,806 |
) |
|
105,558,639 |
|
|
106,752,387 |
|
2023 |
|
12,628,061 |
|
|
(11,640,961 |
) |
|
35,960,571 |
|
|
36,947,671 |
|
2022 |
|
5,411,291 |
|
|
(4,446,176 |
) |
|
12,299,397 |
|
|
13,264,512 |
|
2021 |
|
4,059,119 |
|
|
(3,187,119 |
) |
|
1,933,866 |
|
|
2,805,866 |
|
Fiscal Year |
Average Summary Compensation Table Total for Non-PEO NEOs ($) |
|
Average Exclusion of Stock Awards and Option Awards for Non-PEO NEOs ($)(d) |
|
Average Inclusion of Equity Values for Non-PEO NEOs ($)(e) |
|
Average Compensation Actually Paid to Non-PEO NEOs ($)(c) |
|
||||
2025 |
|
5,149,372 |
|
|
(4,397,872 |
) |
|
1,616,525 |
|
|
2,368,025 |
|
2024 |
|
4,692,394 |
|
|
(3,968,394 |
) |
|
23,372,054 |
|
|
24,096,054 |
|
2023 |
|
3,503,457 |
|
|
(2,840,957 |
) |
|
8,908,997 |
|
|
9,571,497 |
|
2022 |
|
1,881,353 |
|
|
(1,262,944 |
) |
|
3,248,955 |
|
|
3,867,364 |
|
2021 |
|
1,426,477 |
|
|
(886,977 |
) |
|
607,631 |
|
|
1,147,131 |
|
(c) The following adjustments are not applicable and are therefore omitted: (i) the fair value as of the vesting date for awards that are granted and vest in the same year, (ii) the amount equal to the fair value at the end of the prior fiscal year for any awards granted in any prior fiscal year that fail to meet the applicable vesting conditions during the covered fiscal year and (iii) the
dollar value of any dividends or other earnings paid on stock or option awards in the covered fiscal year prior to the vesting date that are not otherwise included in the total compensation for the covered fiscal year.
(d) Represents the average of the aggregate amount of the “Stock Awards” and “Option Awards” columns for the Non-PEO NEOs reported in the Summary Compensation Table for the applicable fiscal year.
(e) Amounts reported in this column are derived from the amounts set forth in the following table for the applicable fiscal year:
Fiscal Year |
Average Year-End Fair Value of Equity Awards Granted During the Year That Remained Unvested as of the Last Day of the Year for Non-PEO NEOs ($) |
|
Average Change in Fair Value from the Last Day of the Prior Year to the Last Day of the Year of Unvested Equity Awards for Non-PEO NEOs ($) |
|
Average Fair Value of Vested Awards Granted and Vested in Current Fiscal Year for Non-PEO NEOs ($) |
|
Average Change in Fair Value from the Last Day of the Prior Year to the Vesting Date of Unvested Equity Awards that Vested During the Year for Non-PEO NEOs ($) |
|
Total - Average Inclusion of |
|
|||||
2025 |
|
2,908,265 |
|
|
(2,457,323 |
) |
|
611,963 |
|
|
553,620 |
|
|
1,616,525 |
|
2024 |
|
9,849,955 |
|
|
7,046,548 |
|
|
1,327,104 |
|
|
5,148,447 |
|
|
23,372,054 |
|
2023 |
|
6,618,575 |
|
|
1,996,417 |
|
|
— |
|
|
294,005 |
|
|
8,908,997 |
|
2022 |
|
2,508,346 |
|
|
667,006 |
|
|
— |
|
|
73,603 |
|
|
3,248,955 |
|
2021 |
|
693,542 |
|
|
(113,247 |
) |
|
— |
|
|
27,336 |
|
|
607,631 |
|
The following chart sets forth the relationship between the CAP to our PEO, the average of the CAP to our Non-PEO NEOs, and our cumulative TSR and Peer Group TSR over the five most recently completed fiscal years.
The following chart sets forth the relationship between the CAP to our PEO, the average of the CAP to our Non-PEO NEOs, and our Net Loss during the five most recently completed fiscal years.
Tabular List of Most Important Financial Performance Measures
At this time, given that we are a research and development company without revenue, we do not use any specific company-selected financial measures for purposes of determining “Compensation Actually Paid.” As is the case with many companies in the biotechnology industry, our annual incentive objectives are generally tied to the Company’s clinical, program and regulatory metrics rather than financial goals. Accordingly, we have omitted the tabular list of financial performance measures. For further information regarding our compensation philosophy and how we seek to align executive compensation with our performance, see the “Executive Compensation” section of this proxy statement.