Pay vs Performance Disclosure - USD ($)
Dec. 31, 2025
Dec. 31, 2024
Dec. 31, 2023
Pay Versus Performance
The Company is providing the following information that shows the difference in the value of compensation paid to our NEOs at different points in time as required by the rules of the SEC.
Pay Versus Performance Table
Year | Summary Compensation Table Total for PEO ($)(1) | Compensation Actually Paid to PEO ($)(2) | Average Summary Compensation Table Total for Non-PEO NEOs ($)(1) | Average Compensation Actually Paid to Non-PEO NEOs ($)(2) | Value of Initial Fixed $100 Investment Based On Total Shareholder Return ($)(3) | Net Income ($) | ||||||||||||
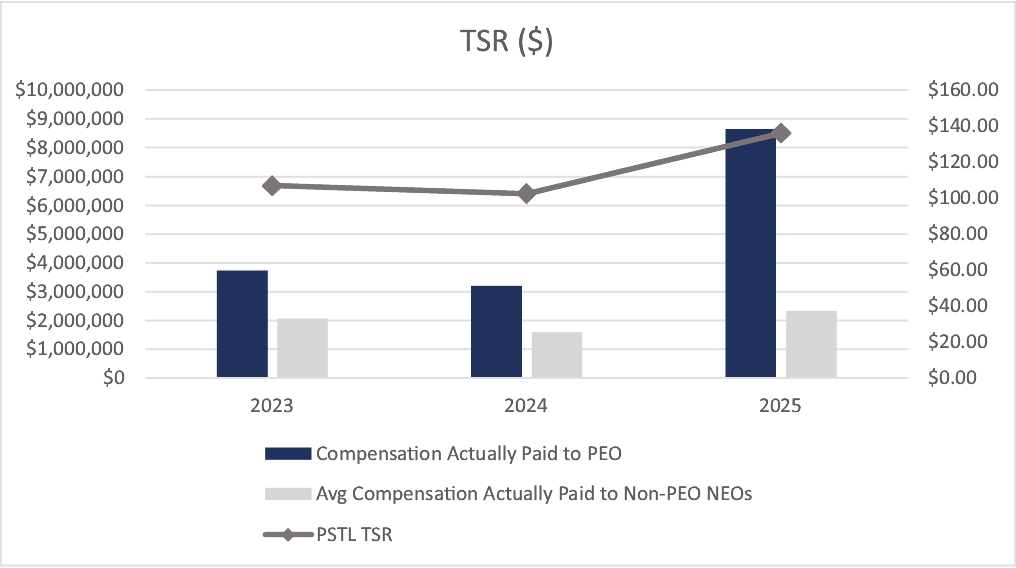
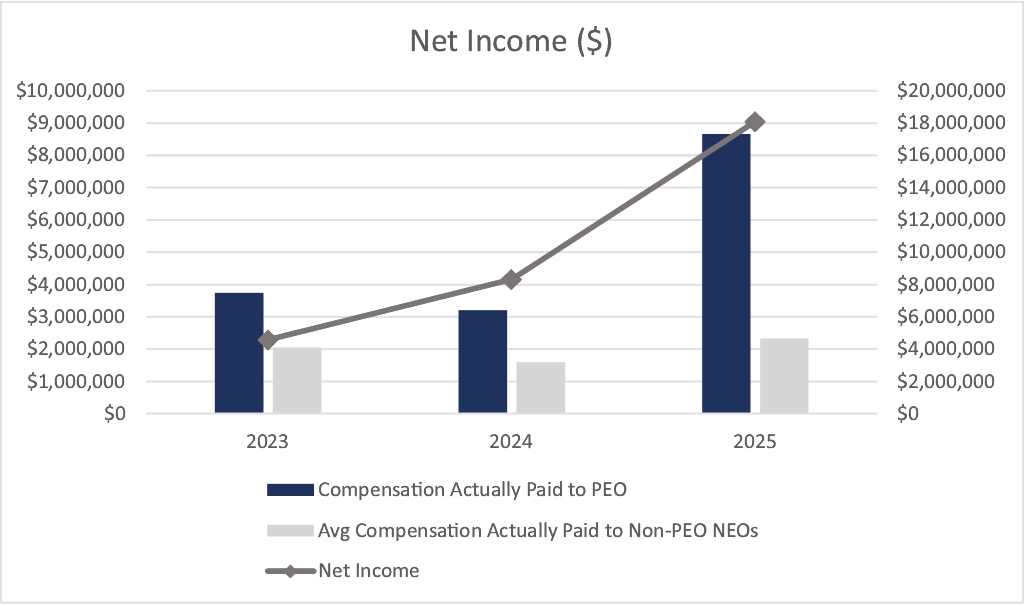
2025 | $3,692,254 | $8,659,600 | $1,670,950 | $2,327,218 | $136.17 | $18,098,000 | ||||||||||||
2024 | $3,282,812 | $3,186,389 | $1,576,958 | $1,592,114 | $102.55 | $8,321,000 | ||||||||||||
2023 | $2,586,144 | $3,727,592 | $1,504,998 | $2,051,469 | $106.94 | $4,583,000 | ||||||||||||
(1) | Reflects the total compensation of our current Chief Executive Officer, Andrew Spodek (“PEO”), who was our only Chief Executive Officer of the Company for the fiscal years ended December 31, 2025, December 31, 2024 and December 31, 2023 (the “Covered Years”). For the year ended December 31, 2025, our non-PEO NEOs include Jeremy Garber, our President, Treasurer and Secretary, Stephen M. Bakke, our current Chief Financial Officer and Robert Klein, our former Chief Financial Officer. For the years ended December 31, 2024 and December 31, 2023, our non-PEO NEOs include only Mr. Garber and Mr. Klein. Amounts shown in these columns are as calculated in the Summary Compensation Table for each of the years shown. |
(2) | For each Covered Year, in determining both the compensation actually paid for our PEO and the compensation actually paid for our Non-CEO NEOs for purposes of this Pay Versus Performance table, we deducted from or added back to the total amount of compensation reported in these columns for such Covered Year the following amounts: |
Item and Value Added (Deducted) For PEO: | 2025 | 2024 | 2023 | ||||||
Summary Compensation Table Total for PEO | $3,692,254 | $3,282,812 | $2,586,144 | ||||||
Deduction for summary compensation table “Stock Awards” column value | $(2,096,781) | $(1,925,860) | $(1,595,509) | ||||||
Increase for year-end fair value of outstanding equity awards granted in Covered Year that remain unvested as of year-end | $4,185,530 | $2,174,224 | $2,268,986 | ||||||
Increase (decrease) for change in fair value of outstanding equity awards granted in prior years | $2,181,317 | $(938,880) | $(9,508) | ||||||
Increase (decrease) for change in fair value of prior-year equity awards vested in Covered Year | $1,442 | $(15,775) | $365 | ||||||
Deduction for the fair value as of prior year end of awards forfeited or cancelled during the current year | $— | $— | $— | ||||||
Increase based on dividends or other earnings paid during the year prior to vesting date of award | $695,838 | $609,868 | $477,114 | ||||||
Compensation actually paid to PEO | $8,659,600 | $3,186,389 | $3,727,592 | ||||||
Item and Value Added (Deducted) Average for Non-PEO NEOs: | 2025 | 2024 | 2023 | ||||||
Average Summary Compensation Table Total for Non-PEO NEOs | $1,670,950 | $1,576,958 | $1,504,998 | ||||||
Deduction for summary compensation table “Stock Awards” column value | $(848,606) | $(690,625) | $(823,505) | ||||||
Increase for year-end fair value of outstanding equity awards granted in Covered Year | $1,516,636 | $896,683 | $1,182,775 | ||||||
Increase (decrease) for change in fair value of outstanding equity awards granted in prior years | $ 403,105 | $(424,493) | $(8,394) | ||||||
(Decrease) Increase for change in fair value of prior-year equity awards vested in Covered Year | $ 16,288 | $(9,695) | $223 | ||||||
Deduction for the fair value as of prior year end of awards forfeited or cancelled during the current year | $(601,250) | $— | $— | ||||||
Increase based on dividends or other earnings paid during the year prior to vesting date of award | $ 170,095 | $243,286 | $195,372 | ||||||
Average compensation actually paid to Non-PEO NEOs | $2,327,218 | $1,592,114 | $2,051,469 | ||||||
(3) | For each Covered Year, our total shareholder return (“TSR”) was calculated based on the percentage change in our cumulative TSR on our Class A common stock, measured as the quotient of (a) the difference between the closing market prices of our Class A common stock of (i) the last trading day before the earliest fiscal year in this Pay Versus Performance table and (ii) the last trading day of each Covered Year (the “Measurement Period”), divided by (b) the closing market price of our Class A common stock on the last trading day before the earliest fiscal year in this Pay Versus Performance table. Each of these percentage changes was then applied to a deemed fixed investment of $100 at the beginning of the Measurement Period to produce the Covered Year-end cumulative values of such investment as of the end of 2025, 2024 and 2023, as applicable. |
(1) | Reflects the total compensation of our current Chief Executive Officer, Andrew Spodek (“PEO”), who was our only Chief Executive Officer of the Company for the fiscal years ended December 31, 2025, December 31, 2024 and December 31, 2023 (the “Covered Years”). For the year ended December 31, 2025, our non-PEO NEOs include Jeremy Garber, our President, Treasurer and Secretary, Stephen M. Bakke, our current Chief Financial Officer and Robert Klein, our former Chief Financial Officer. For the years ended December 31, 2024 and December 31, 2023, our non-PEO NEOs include only Mr. Garber and Mr. Klein. Amounts shown in these columns are as calculated in the Summary Compensation Table for each of the years shown. |
(2) | For each Covered Year, in determining both the compensation actually paid for our PEO and the compensation actually paid for our Non-CEO NEOs for purposes of this Pay Versus Performance table, we deducted from or added back to the total amount of compensation reported in these columns for such Covered Year the following amounts: |
Item and Value Added (Deducted) For PEO: | 2025 | 2024 | 2023 | ||||||
Summary Compensation Table Total for PEO | $3,692,254 | $3,282,812 | $2,586,144 | ||||||
Deduction for summary compensation table “Stock Awards” column value | $(2,096,781) | $(1,925,860) | $(1,595,509) | ||||||
Increase for year-end fair value of outstanding equity awards granted in Covered Year that remain unvested as of year-end | $4,185,530 | $2,174,224 | $2,268,986 | ||||||
Increase (decrease) for change in fair value of outstanding equity awards granted in prior years | $2,181,317 | $(938,880) | $(9,508) | ||||||
Increase (decrease) for change in fair value of prior-year equity awards vested in Covered Year | $1,442 | $(15,775) | $365 | ||||||
Deduction for the fair value as of prior year end of awards forfeited or cancelled during the current year | $— | $— | $— | ||||||
Increase based on dividends or other earnings paid during the year prior to vesting date of award | $695,838 | $609,868 | $477,114 | ||||||
Compensation actually paid to PEO | $8,659,600 | $3,186,389 | $3,727,592 | ||||||
(2) | For each Covered Year, in determining both the compensation actually paid for our PEO and the compensation actually paid for our Non-CEO NEOs for purposes of this Pay Versus Performance table, we deducted from or added back to the total amount of compensation reported in these columns for such Covered Year the following amounts: |
Item and Value Added (Deducted) Average for Non-PEO NEOs: | 2025 | 2024 | 2023 | ||||||
Average Summary Compensation Table Total for Non-PEO NEOs | $1,670,950 | $1,576,958 | $1,504,998 | ||||||
Deduction for summary compensation table “Stock Awards” column value | $(848,606) | $(690,625) | $(823,505) | ||||||
Increase for year-end fair value of outstanding equity awards granted in Covered Year | $1,516,636 | $896,683 | $1,182,775 | ||||||
Increase (decrease) for change in fair value of outstanding equity awards granted in prior years | $ 403,105 | $(424,493) | $(8,394) | ||||||
(Decrease) Increase for change in fair value of prior-year equity awards vested in Covered Year | $ 16,288 | $(9,695) | $223 | ||||||
Deduction for the fair value as of prior year end of awards forfeited or cancelled during the current year | $(601,250) | $— | $— | ||||||
Increase based on dividends or other earnings paid during the year prior to vesting date of award | $ 170,095 | $243,286 | $195,372 | ||||||
Average compensation actually paid to Non-PEO NEOs | $2,327,218 | $1,592,114 | $2,051,469 | ||||||