Pay vs Performance Disclosure - USD ($)
Dec. 31, 2025
Dec. 31, 2024
Dec. 31, 2023
Dec. 31, 2022
Dec. 31, 2021
Dec. 31, 2020
| (a) | (b) | (b) | (c) | (c) | (d) | (e) | (f) | (g) | (h) | (i) | |||||||||||||||||||||||||
| Year | Average SCT Total for Non- PEO NEOs ($)(4) | Average CAP to Non-PEO NEOs ($)(5) | Value of Initial Fixed $100 Investment Based on: | Net Income (in thousands) ($)(8) | Adjusted Income from Continuing Operations (in thousands) ($)(9) | ||||||||||||||||||||||||||||||
SCT Total for PEO(1)(2) | CAP to PEO(3) | TSR ($)(6) | Peer Group TSR ($)(7) | ||||||||||||||||||||||||||||||||
| Kivisto ($) | Goodin ($) | Kivisto ($) | Goodin ($) | ||||||||||||||||||||||||||||||||
| 2025 | 4,812,252 | — | 5,813,967 | — | 1,580,722 | 1,822,955 | 225.11 | 162.61 | 190,395 | 191,571 | |||||||||||||||||||||||||
| 2024 | 5,628,905 | 753,667 | 8,384,701 | 1,662,433 | 1,734,826 | 1,884,371 | 201.42 | 158.07 | 281,108 | 188,189 | |||||||||||||||||||||||||
| 2023 | — | 7,100,593 | — | 4,987,034 | 2,113,640 | 1,648,546 | 119.82 | 136.67 | 414,707 | 153,269 | |||||||||||||||||||||||||
| 2022 | — | 5,257,288 | — | 5,644,274 | 1,901,639 | 1,998,863 | 122.13 | 123.89 | 367,489 | 117,252 | |||||||||||||||||||||||||
| 2021 | — | 5,210,467 | — | 7,143,972 | 1,810,584 | 2,273,834 | 120.37 | 126.68 | 378,131 | 126,684 | |||||||||||||||||||||||||
2021 | 2022-23* | 2024** | 2025*** | ||||||||
Alliant Energy Corporation | Alliant Energy Corporation | Alliant Energy Corporation | Alliant Energy Corporation | ||||||||
Ameren Corporation | Ameren Corporation | Ameren Corporation | Atmos Energy Corporation | ||||||||
Atmos Energy Corporation | Atmos Energy Corporation | APi Group Corporation | Avista Corporation | ||||||||
Black Hills Corporation | Black Hills Corporation | Atmos Energy Corporation | Black Hills Corporation | ||||||||
CMS Energy Corporation | CMS Energy Corporation | Avista Corporation | Chesapeake Utilities Corporation | ||||||||
Dycom Industries, Inc. | Dycom Industries, Inc. | Black Hills Corporation | IDACORP, Inc. | ||||||||
EMCOR Group, Inc. | EMCOR Group, Inc. | CMS Energy Corporation | MGE Energy, Inc. | ||||||||
Evergy, Inc. | Evergy, Inc. | Comfort Systems USA, Inc. | National Fuel Gas Company | ||||||||
Granite Construction Incorporated | Granite Construction Incorporated | Dycom Industries, Inc. | New Jersey Resources Corporation | ||||||||
Jacobs Engineering Group Inc. | KBR, Inc. | EMCOR Group, Inc. | NiSource Inc. | ||||||||
KBR, Inc. | Martin Marietta Materials, Inc. | Evergy, Inc. | Northwest Natural Holding Company | ||||||||
Martin Marietta Materials, Inc. | MasTec, Inc. | KBR, Inc. | Northwestern Energy Group Inc. | ||||||||
MasTec, Inc. | MYR Group Inc.* | MYR Group Inc. | OGE Energy Corp. | ||||||||
NiSource Inc. | NiSource Inc. | New Jersey Resources Corporation | ONE Gas, Inc. | ||||||||
Pinnacle West Capital Corporation | Pinnacle West Capital Corporation | NiSource Inc. | Otter Tail Corporation | ||||||||
Portland General Electric Company | Portland General Electric Company | OGE Energy Corp. | Pinnacle West Capital Corporation | ||||||||
Quanta Services, Inc. | Quanta Services, Inc. | Pinnacle West Capital Corporation | Portland General Electric Company | ||||||||
Southwest Gas Holdings, Inc. | Southwest Gas Holdings, Inc. | Portland General Electric Company | Southwest Gas Holdings, Inc. | ||||||||
Summit Materials, Inc. | Summit Materials, Inc. | Primoris Services Corporation | Spire Inc. | ||||||||
Vulcan Materials Company | Vulcan Materials Company | Southwest Gas Holdings, Inc. | TXMN Energy, Inc. | ||||||||
WEC Energy Group, Inc. | WEC Energy Group, Inc. | WEC Energy Group, Inc. | |||||||||
* Jacobs Engineering Group Inc. was replaced with MYR Group Inc. in 2022 because of its size relative to the Company.
** Following the completion of the Knife River spinoff, the Compensation Committee revised the peer group. Companies associated with the construction materials industry, including Granite Construction Incorporated, Martin Marietta Materials, Inc., Summit Materials, Inc., and Vulcan Materials Company, were removed. Other companies were removed because of their size relative to the Company following the spinoff, including MasTec, Inc. and Quanta Services, Inc. APi Group Corporation, Avista Corporation, Comfort Systems USA, Inc., New Jersey Resources Corporation, OGE Energy Corp., and Primoris Services Corporation were added to the peer group based on their industry and size relative to the Company.
*** Following the completion of the Everus spinoff, the Compensation Committee revised the peer group. Companies associated with the construction services industry, including APi Group Corporation, Comfort Systems USA, Inc., Dycom Industries, Inc., EMCOR Group, Inc., KBR, Inc., MYR Group Inc, and Primoris Services Corporation, were removed. Other companies were removed because of their size relative to the Company following the spinoff, including Ameren Corporation, CMS Energy Corporation, Evergy, Inc., and WEC Energy Group, Inc. Chesapeake Utilities Corporation, IDACORP, Inc., MGE Energy, Inc., National Fuel Gas Company, Northwest Natural Holding Company, Northwestern Energy Group Inc., ONE Gas, Inc., Otter Tail Corporation, Spire Inc., and TXMN Energy, Inc. were added to the peer group based on their industry and size relative to the Company.
TSR for the peer group companies were as follows:
Peer Group | 12/31/2020 ($) | 12/31/2021 ($) | 12/31/2022 ($) | 12/31/2023 ($) | 12/31/2024 ($) | 12/31/2025 ($) | ||||||||||||||
2021 | 100.00 | 126.68 | 122.95 | 135.19 | 171.77 | 206.45 | ||||||||||||||
2022-23 | 100.00 | 126.83 | 123.89 | 136.67 | 173.57 | 210.58 | ||||||||||||||
2024 | 100.00 | 118.80 | 120.77 | 122.09 | 158.07 | 199.97 | ||||||||||||||
2025 | 100.00 | 117.81 | 120.62 | 116.35 | 139.72 | 162.61 | ||||||||||||||
SCT Total Compensation for the PEO | 4,812,252 | |||||||
less: Reported Value of Stock Awards in the SCT(a) | 2,600,313 | |||||||
plus: Equity Award Adjustments(a)(b) | 3,668,957 | |||||||
less: Change in Actuarial Present Value of Defined Benefit and Pension Plans as Reported in the SCT | 66,929 | |||||||
plus: Aggregate Service Cost and Prior Service Costs on Defined Benefit and Pension Plans | — | |||||||
CAP for the PEO | 5,813,967 | |||||||
(a) Equity compensation grant date and year-end fair value for PSAs and RSUs with a performance condition performance measure were determined by the closing stock price on the grant date or year-end, as applicable. Equity compensation grant date fair value for awards with a market condition performance measure are determined by Monte Carlo simulation as described in Note 3 to the SCT found on page 63. Year-end fair values for awards with a market condition performance measure were determined using the same assumptions.
(b) Equity Award Adjustments in determining CAP:
PEO | Year-end Fair Value of Equity Awards Granted in the Year that are Unvested ($) | Year-over-Year Change in Fair Value of Equity Awards Granted in Prior Years that are Unvested ($) | Fair Value as of Vesting Date of Equity Awards Granted and Vested in the Year ($) | Year-over-Year Change in Fair Value of Equity Awards Granted in Prior Years that Vested in the Year ($) | Prior Year-end Fair Value of Equity Awards that Failed to Meet Vesting Conditions in the Year ($) | Value of Dividends or Other Earnings Paid on Equity Awards not Otherwise Reflected in Fair Value or Total Compensation ($) | Total Equity Award Adjustments ($) | ||||||||||||||||
| Kivisto | 3,050,044 | 384,284 | — | 234,629 | — | — | 3,668,957 | ||||||||||||||||
Average of SCT Total Compensation for Non-PEO NEOs | 1,580,722 | ||||
less: Reported Value of Stock Awards in the SCT(a) | 544,059 | ||||
plus: Equity Award Adjustments(a)(b) | 799,482 | ||||
less: Change in Actuarial Present Value of Defined Benefit and Pension Plans as Reported in the SCT | 13,190 | ||||
plus: Aggregate Service Cost and Prior Service Costs on Defined Benefit and Pension Plans | — | ||||
Average CAP for the Non-PEO NEOs | 1,822,955 | ||||
(a) Equity compensation grant date and year-end fair value for PSA and RSUs with a performance condition metric were determined by the closing stock price on the grant date or year-end, as applicable. Equity compensation grant date fair value for awards with a market condition metric are determined by Monte Carlo simulation as described in Note 3 to the SCT on page 63. Year-end fair value for awards with a market condition metric were determined using the same assumptions.
(b) Equity Award Adjustments for average non-PEO NEOs:
Year | Year-end Fair Value of Equity Awards Granted in the Year that are Unvested ($) | Year-over-Year Change in Fair Value of Equity Awards Granted in Prior Years that are Unvested ($) | Fair Value as of Vesting Date of Equity Awards Granted and Vested in the Year ($) | Year-over-Year Change in Fair Value of Equity Awards Granted in Prior Years that Vested in the Year ($) | Prior Year-end Fair Value of Equity Awards that Failed to Meet Vesting Conditions in the Year ($) | Value of Dividends or Other Earnings Paid on Equity Awards not Otherwise Reflected in Fair Value or Total Compensation ($) | Total Equity Award Adjustments ($) | ||||||||||||||||
| 2025 | 638,155 | 69,605 | — | 91,722 | — | — | 799,482 | ||||||||||||||||
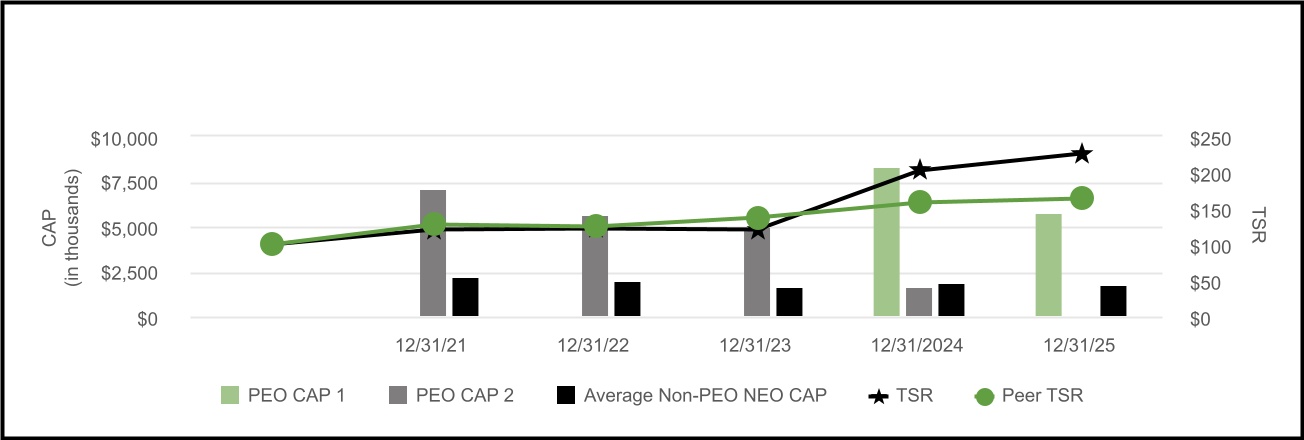
CAP vs. TSR
Our TSR is a reflection of our stock price and dividends paid over a period of time and is important to stockholders as it measures the performance of an investment in our Common Stock in the marketplace. The following chart depicts the PEO and average non-PEO NEO CAP compared to the value of $100 invested in Company and peer company stock during the applicable years assuming dividends are reinvested at the frequency paid:
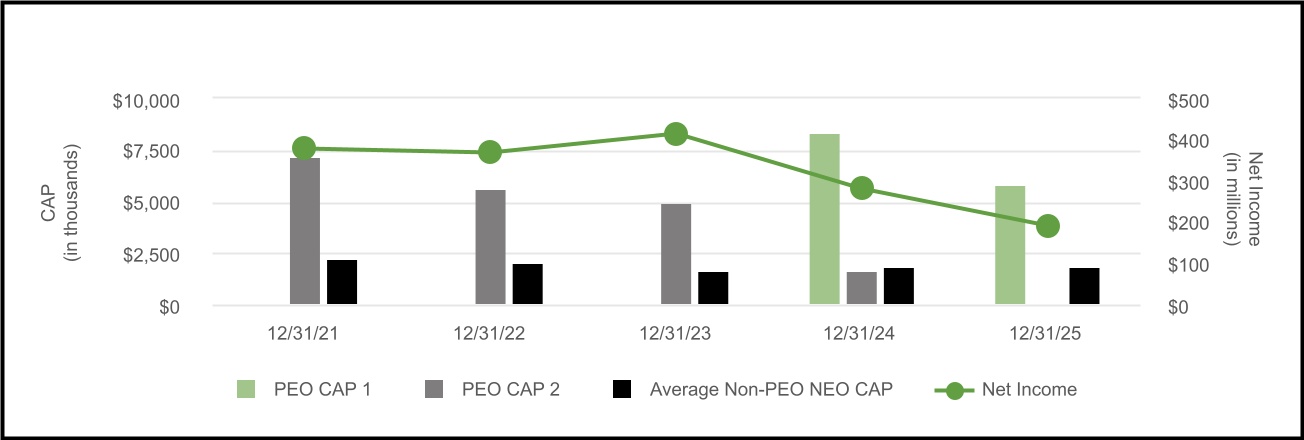
CAP vs. Net Income
The following chart depicts the PEO and average non-PEO NEO CAP compared to the Net Income during the applicable years:
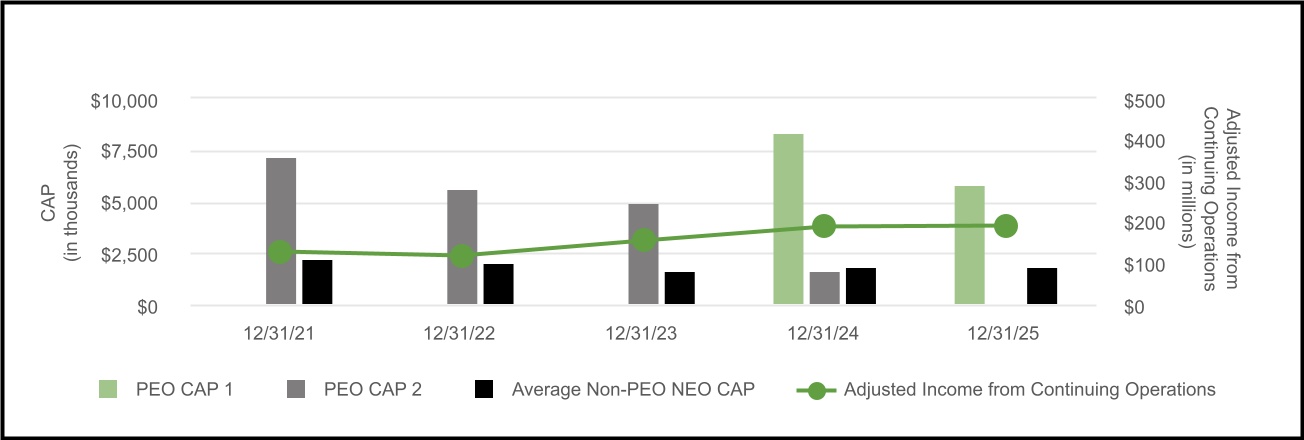
CAP vs. Adjusted Income from Continuing Operations
The following chart depicts the PEO and average non-PEO NEO CAP compared to the Company’s Adjusted Income from Continuing Operations during the applicable years:
CAP vs. TSR
Our TSR is a reflection of our stock price and dividends paid over a period of time and is important to stockholders as it measures the performance of an investment in our Common Stock in the marketplace. The following chart depicts the PEO and average non-PEO NEO CAP compared to the value of $100 invested in Company and peer company stock during the applicable years assuming dividends are reinvested at the frequency paid:
The 2025 most important financial performance measures used by the Company to link PEO and Non-PEO NEOs’ CAP to Company performance are listed, each of which is described in more detail in the CD&A beginning on page 46. | 2025 Most Important Measures (Unranked) | |||||||
Adjusted Income from Continuing Operations | ||||||||
Cumulative Adjusted EPS | ||||||||
rTSR | ||||||||
Descriptions of the Information Presented in the Pay Versus Performance Table
We are providing the graphics below to illustrate the relationship between our PEO CAP and non-PEO NEOs’ CAP as a group and Company performance, as set forth and described in and under Pay Versus Performance beginning on page 72, including the Company and compensation benchmarking peer group cumulative TSR, Net Income, and Adjusted Income from Continuing Operations. For each of the graphics below, PEO CAP 1 refers to Ms. Kivisto and PEO CAP 2 refers to Mr. Goodin.
•The effect from asset sales, dispositions, and retirements not contemplated in the Company’s financial plan;
•The effect from transaction costs associated with acquisitions, divestitures, mergers, or other strategic transactions not contemplated in the Company’s financial plan;
•The effect from unanticipated changes and interpretations of tax laws or accounting rules not contemplated in the Company’s financial plan; and
•To the extent determined appropriate, the effect of any extraordinary and nonrecurring items, not contemplated in the Company’s financial plan.