SUMMARY | AVERAGE | AVERAGE | VALUE OF INITIAL FIXED $100 | |||||||||||||
COMPENSATION | SUMMARY | COMPENSATION | INVESTMENT BASED ON: | |||||||||||||
TABLE TOTAL | COMPENSATION | COMPENSATION | ACTUALLY | PEER GROUP | ||||||||||||
FOR PRINCIPAL | ACTUALLY | TABLE | PAID TO | TOTAL | TOTAL | REAL ESTATE | ||||||||||
EXECUTIVE | PAID TO | TOTAL FOR | NON-PEO | SHAREHOLDER | SHAREHOLDER | NET | FFO | |||||||||
OFFICER (“PEO”) | PEO | NON-PEO NEOS | NEOS | RETURN | RETURN | INCOME | PER SHARE | |||||||||
YEAR | | ($)(1) | | ($)(2) | | ($)(3) | | ($)(4) | | ($) | | ($)(5) | | ($ in 000s)(6) | | ($)(7) |
2025 | 11,663,678 | 31,738,170 | 4,583,176 | 8,121,241 | 283 | 174 | 5,364,120 | 12.73 | ||||||||
2024 |
| 61,394,770 | 81,595,925 | 8,896,713 | 13,401,627 | 251 | 166 | 2,729,021 | 12.24 | |||||||
2023 |
| 15,564,307 |
| 22,397,338 |
| 3,544,111 |
| 5,557,380 |
| 198 |
| 146 |
| 2,617,018 |
| 11.78 |
2022 |
| 35,667,783 |
| 30,033,524 |
| 5,554,461 |
| 3,916,326 |
| 153 |
| 132 |
| 2,452,385 |
| 11.39 |
2021 |
| 10,475,192 |
| 24,351,704 |
| 2,512,245 |
| 5,726,224 |
| 196 |
| 152 |
| 2,568,707 |
| 10.51 |
| 1. | Represents the amount reported for each of the corresponding years in the “Total” column of the Summary Compensation Table for Mr. David Simon, the Company’s CEO through 2025. |
| 2. | Represents the amount of “compensation actually paid” to Mr. David Simon, as computed in accordance with Item 402(v) of Regulation S- K. This amount does not reflect the total compensation actually realized or received by Mr. David Simon. In accordance with Item 402(v) of Regulation S-K, these amounts reflect “Total” compensation as set forth in the Summary Compensation Table for each year, adjusted as shown below. Equity values are calculated in accordance with FASB ASC Topic 718, and the valuation assumptions used to calculate fair values did not materially differ from those disclosed at the time of grant. |
EQUITY AWARD ADJUSTMENTS (PEO) (A) |
| |||||||||||||
| | | CHANGE IN FV | CHANGE IN FV | |
| ||||||||
DEDUCTION FOR | OF AWARDS GRANTED IN | OF AWARDS |
| |||||||||||
AMOUNTS | INCREASE BASED ON | PRIOR FY THAT | GRANTED IN | INCREASED |
| |||||||||
REPORTED UNDER | ASC 718 FV OF | WERE OUTSTANDING | PRIOR FY THAT | BASED ON |
| |||||||||
THE “STOCK | AWARDS GRANTED | AND UNVESTED | VESTED IN THE | DIVIDENDS OR |
| |||||||||
AWARDS” AND | IN THE APPLICABLE | AS OF APPLICABLE | APPLICABLE FY, | OTHER EARNINGS |
| |||||||||
“OPTION AWARDS” | FY THAT REMAIN | FY END DETERMINED | DETERMINED | PAID DURING |
| |||||||||
COLUMNS IN THE | UNVESTED AS OF | BASED ON CHANGE | BASED ON CHANGE | APPLICABLE | ||||||||||
PEO | SCT FOR THE | APPLICABLE FY END, | IN ASC 718 FV | IN ASC 718 FV | FY PRIOR | COMPENSATION | ||||||||
REPORTED | APPLICABLE | DETERMINED AS OF | FROM PRIOR FY END | FROM PRIOR FY END | TO VESTING | ACTUALLY | ||||||||
SCT TOTAL | FISCAL YEAR | APPLICABLE FY END | TO APPLICABLE FY END | TO VESTING DATE | DATE | PAID TO PEO | ||||||||
YEAR | | $ | | $ | | $ | | $ | | $ | | $ | | $ |
2025 | 11,663,678 | 7,000,261 | 6,981,664 | 16,877,286 | 346,911 | 2,868,892 | 31,738,170 | |||||||
| (A) | The fair values of unvested and outstanding equity awards to our NEOs were remeasured as of the end of each fiscal year, and as of each vesting date, during the 2021, 2022, 2023, 2024 and 2025 fiscal years. Adjustments for the items shown in the table above for fiscal year 2025 were also made for the 2021, 2022, 2023 and 2024 fiscal years. Fair values as of each measurement date were determined using valuation assumptions and methodologies (including volatility, dividend yield, and risk-free interest rates) that are stock units, fair values were estimated using a Monte Carlo simulation model, using assumptions that are consistent with those used at grant. For other performance-based awards, the fair values reflect the probable outcome of the performance vesting conditions as of the last day of the applicable fiscal year. |
| 3. | Represents the average of the amounts reported for the Company’s named executive officers (NEOs) as a group (excluding Mr. David Simon) for each of the corresponding years in the “Total” column of the Summary Compensation Table. The names of each of the NEOs included for these purposes in each applicable year are as follows: |
YEAR | | PEO | | NEOs included in Average |
2025 |
| David Simon |
| Brian J. McDade, Eli Simon, Steven E. Fivel, and John Rulli |
2024 |
| David Simon |
| Brian J. McDade, Steven E. Fivel, John Rulli, and Adam J. Reuille |
2023 |
| David Simon |
| Brian J. McDade, Steven E. Fivel, John Rulli, and Adam J. Reuille |
2022 |
| David Simon |
| Brian J. McDade, Steven E. Fivel, John Rulli, and Adam J. Reuille |
2021 |
| David Simon |
| Brian J. McDade, Steven E. Fivel, John Rulli, and Alexander L.W. Snyder |
| 4. | Represents the average amount of “compensation actually paid” to the NEOs as a group (excluding Mr. David Simon), as computed in accordance with Item 402(v) of Regulation S-K. In accordance with Item 402(v) of Regulation S-K, these amounts reflect “Total” compensation as set forth in the Summary Compensation Table for each year, adjusted as shown below. Equity values are calculated in accordance with FASB ASC Topic 718, and the valuation assumptions used to calculate fair values did not materially differ from those disclosed at the time of the grant. |
EQUITY AWARD ADJUSTMENTS (NON-PEO NEOS) (A) |
| |||||||||||||
| | CHANGE IN | | |
| |||||||||
FV OF AWARDS |
| |||||||||||||
GRANTED IN PRIOR | CHANGE IN |
| ||||||||||||
DEDUCTION FOR | FY THAT WERE | FV OF AWARDS |
| |||||||||||
AMOUNTS | OUTSTANDING AND | GRANTED IN |
| |||||||||||
REPORTED | INCREASE BASED | UNVESTED AS OF | PRIOR FY THAT |
| ||||||||||
IN THE | ON ASC 718 | APPLICABLE | VESTED IN THE | INCREASED |
| |||||||||
“STOCK AWARDS” | FAIR VALUE OF | FY END | APPLICABLE FY, | BASED ON |
| |||||||||
AND “OPTION | AWARDS GRANTED | DETERMINED | DETERMINED | DIVIDENDS OR |
| |||||||||
AWARDS” | IN THE APPLICABLE | BASED ON | BASED | OTHER |
| |||||||||
AVERAGE | COLUMNS | FY THAT REMAIN | CHANGE IN | ON CHANGE IN | EARNINGS | AVERAGE | ||||||||
NON-PEO | IN THE | UNVESTED AS OF | ASC 718 FV FROM | ASC 718 FV | PAID DURING | COMPENSATION | ||||||||
NEO | SCT FOR THE | APPLICABLE FY END, | PRIOR FY END TO | FROM | APPLICABLE FY | ACTUALLY | ||||||||
REPORTED | APPLICABLE | DETERMINED AS OF | APPLICABLE | PRIOR FY END | PRIOR TO | PAID TO | ||||||||
SCT TOTAL | FISCAL YEAR | APPLICABLE FY END | FY END | TO VESTING DATE | VESTING DATE | NON-PEO NEOS | ||||||||
YEAR | | $ | | $ | | $ | | $ | | $ | | $ | | $ |
2025 | 4,583,176 | 2,750,338 | 2,883,063 | 2,865,456 | 26,364 | 513,519 | 8,121,241 | |||||||
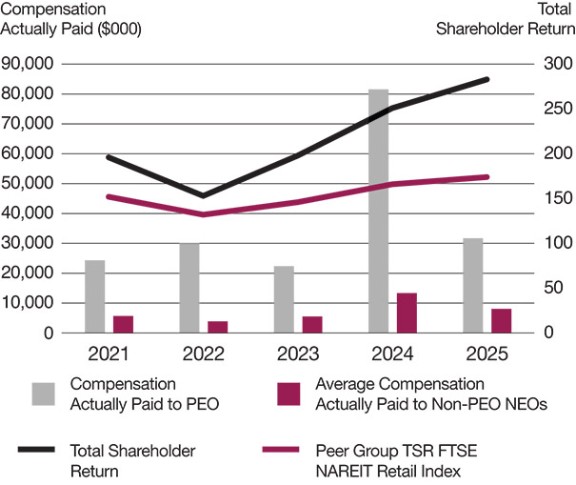
| 5. | The peer group used for this purpose is the following published industry index: FTSE NAREIT Equity Retail Index. |
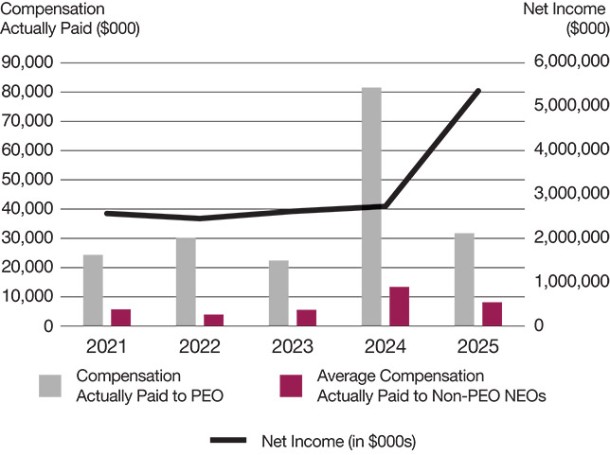
| 6. | Represents the amount of net income reflected in the Company’s audited financial statements for the applicable year. |
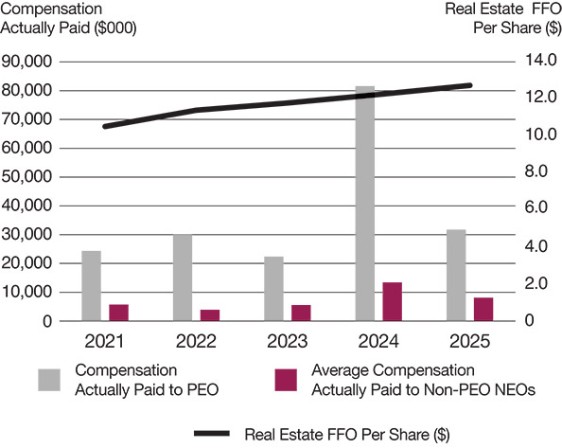
| 7. | GAAP reconciliation of our reported FFO per share to real estate FFO per share for the years 2023, 2024 and 2025 is included in our filed Annual Report on form 10-K for the year ending December 31, 2025 on pages 75-77, and real estate FFO per share for 2022 includes adjustments consistent with those applied for the years 2023, 2024 and 2025. Real estate FFO for 2021 includes adjustments consistent with those made and reported in our 2025 Form 10-K to diluted FFO. |
| 3. | Represents the average of the amounts reported for the Company’s named executive officers (NEOs) as a group (excluding Mr. David Simon) for each of the corresponding years in the “Total” column of the Summary Compensation Table. The names of each of the NEOs included for these purposes in each applicable year are as follows: |
YEAR | | PEO | | NEOs included in Average |
2025 |
| David Simon |
| Brian J. McDade, Eli Simon, Steven E. Fivel, and John Rulli |
2024 |
| David Simon |
| Brian J. McDade, Steven E. Fivel, John Rulli, and Adam J. Reuille |
2023 |
| David Simon |
| Brian J. McDade, Steven E. Fivel, John Rulli, and Adam J. Reuille |
2022 |
| David Simon |
| Brian J. McDade, Steven E. Fivel, John Rulli, and Adam J. Reuille |
2021 |
| David Simon |
| Brian J. McDade, Steven E. Fivel, John Rulli, and Alexander L.W. Snyder |
| 5. | The peer group used for this purpose is the following published industry index: FTSE NAREIT Equity Retail Index. |
| 2. | Represents the amount of “compensation actually paid” to Mr. David Simon, as computed in accordance with Item 402(v) of Regulation S- K. This amount does not reflect the total compensation actually realized or received by Mr. David Simon. In accordance with Item 402(v) of Regulation S-K, these amounts reflect “Total” compensation as set forth in the Summary Compensation Table for each year, adjusted as shown below. Equity values are calculated in accordance with FASB ASC Topic 718, and the valuation assumptions used to calculate fair values did not materially differ from those disclosed at the time of grant. |
EQUITY AWARD ADJUSTMENTS (PEO) (A) |
| |||||||||||||
| | | CHANGE IN FV | CHANGE IN FV | |
| ||||||||
DEDUCTION FOR | OF AWARDS GRANTED IN | OF AWARDS |
| |||||||||||
AMOUNTS | INCREASE BASED ON | PRIOR FY THAT | GRANTED IN | INCREASED |
| |||||||||
REPORTED UNDER | ASC 718 FV OF | WERE OUTSTANDING | PRIOR FY THAT | BASED ON |
| |||||||||
THE “STOCK | AWARDS GRANTED | AND UNVESTED | VESTED IN THE | DIVIDENDS OR |
| |||||||||
AWARDS” AND | IN THE APPLICABLE | AS OF APPLICABLE | APPLICABLE FY, | OTHER EARNINGS |
| |||||||||
“OPTION AWARDS” | FY THAT REMAIN | FY END DETERMINED | DETERMINED | PAID DURING |
| |||||||||
COLUMNS IN THE | UNVESTED AS OF | BASED ON CHANGE | BASED ON CHANGE | APPLICABLE | ||||||||||
PEO | SCT FOR THE | APPLICABLE FY END, | IN ASC 718 FV | IN ASC 718 FV | FY PRIOR | COMPENSATION | ||||||||
REPORTED | APPLICABLE | DETERMINED AS OF | FROM PRIOR FY END | FROM PRIOR FY END | TO VESTING | ACTUALLY | ||||||||
SCT TOTAL | FISCAL YEAR | APPLICABLE FY END | TO APPLICABLE FY END | TO VESTING DATE | DATE | PAID TO PEO | ||||||||
YEAR | | $ | | $ | | $ | | $ | | $ | | $ | | $ |
2025 | 11,663,678 | 7,000,261 | 6,981,664 | 16,877,286 | 346,911 | 2,868,892 | 31,738,170 | |||||||
| (A) | The fair values of unvested and outstanding equity awards to our NEOs were remeasured as of the end of each fiscal year, and as of each vesting date, during the 2021, 2022, 2023, 2024 and 2025 fiscal years. Adjustments for the items shown in the table above for fiscal year 2025 were also made for the 2021, 2022, 2023 and 2024 fiscal years. Fair values as of each measurement date were determined using valuation assumptions and methodologies (including volatility, dividend yield, and risk-free interest rates) that are stock units, fair values were estimated using a Monte Carlo simulation model, using assumptions that are consistent with those used at grant. For other performance-based awards, the fair values reflect the probable outcome of the performance vesting conditions as of the last day of the applicable fiscal year. |
| (A) | The fair values of unvested and outstanding equity awards to our NEOs were remeasured as of the end of each fiscal year, and as of each vesting date, during the 2021, 2022, 2023, 2024 and 2025 fiscal years. Adjustments for the items shown in the table above for fiscal year 2025 were also made for the 2021, 2022, 2023 and 2024 fiscal years. Fair values as of each measurement date were determined using valuation assumptions and methodologies (including volatility, dividend yield, and risk-free interest rates) that are stock units, fair values were estimated using a Monte Carlo simulation model, using assumptions that are consistent with those used at grant. For other performance-based awards, the fair values reflect the probable outcome of the performance vesting conditions as of the last day of the applicable fiscal year. |
| 4. | Represents the average amount of “compensation actually paid” to the NEOs as a group (excluding Mr. David Simon), as computed in accordance with Item 402(v) of Regulation S-K. In accordance with Item 402(v) of Regulation S-K, these amounts reflect “Total” compensation as set forth in the Summary Compensation Table for each year, adjusted as shown below. Equity values are calculated in accordance with FASB ASC Topic 718, and the valuation assumptions used to calculate fair values did not materially differ from those disclosed at the time of the grant. |
EQUITY AWARD ADJUSTMENTS (NON-PEO NEOS) (A) |
| |||||||||||||
| | CHANGE IN | | |
| |||||||||
FV OF AWARDS |
| |||||||||||||
GRANTED IN PRIOR | CHANGE IN |
| ||||||||||||
DEDUCTION FOR | FY THAT WERE | FV OF AWARDS |
| |||||||||||
AMOUNTS | OUTSTANDING AND | GRANTED IN |
| |||||||||||
REPORTED | INCREASE BASED | UNVESTED AS OF | PRIOR FY THAT |
| ||||||||||
IN THE | ON ASC 718 | APPLICABLE | VESTED IN THE | INCREASED |
| |||||||||
“STOCK AWARDS” | FAIR VALUE OF | FY END | APPLICABLE FY, | BASED ON |
| |||||||||
AND “OPTION | AWARDS GRANTED | DETERMINED | DETERMINED | DIVIDENDS OR |
| |||||||||
AWARDS” | IN THE APPLICABLE | BASED ON | BASED | OTHER |
| |||||||||
AVERAGE | COLUMNS | FY THAT REMAIN | CHANGE IN | ON CHANGE IN | EARNINGS | AVERAGE | ||||||||
NON-PEO | IN THE | UNVESTED AS OF | ASC 718 FV FROM | ASC 718 FV | PAID DURING | COMPENSATION | ||||||||
NEO | SCT FOR THE | APPLICABLE FY END, | PRIOR FY END TO | FROM | APPLICABLE FY | ACTUALLY | ||||||||
REPORTED | APPLICABLE | DETERMINED AS OF | APPLICABLE | PRIOR FY END | PRIOR TO | PAID TO | ||||||||
SCT TOTAL | FISCAL YEAR | APPLICABLE FY END | FY END | TO VESTING DATE | VESTING DATE | NON-PEO NEOS | ||||||||
YEAR | | $ | | $ | | $ | | $ | | $ | | $ | | $ |
2025 | 4,583,176 | 2,750,338 | 2,883,063 | 2,865,456 | 26,364 | 513,519 | 8,121,241 | |||||||
Compensation Actually Paid vs Company Total Shareholder Return and Peer Group Shareholder Return
Compensation Actually Paid vs Net Income
Compensation Actually Paid vs Real Estate FFO per share
Compensation Actually Paid vs Company Total Shareholder Return and Peer Group Shareholder Return
The table below represents the most important financial performance measures used by the Company to link compensation actually paid to our NEOs to Company performance for fiscal year ended December 31, 2025, as discussed further in our Compensation Discussion and Analysis.
Real Estate FFO per Share | |
Absolute TSR | |
EBITDA |
| 7. | GAAP reconciliation of our reported FFO per share to real estate FFO per share for the years 2023, 2024 and 2025 is included in our filed Annual Report on form 10-K for the year ending December 31, 2025 on pages 75-77, and real estate FFO per share for 2022 includes adjustments consistent with those applied for the years 2023, 2024 and 2025. Real estate FFO for 2021 includes adjustments consistent with those made and reported in our 2025 Form 10-K to diluted FFO. |