Pay vs Performance Disclosure - USD ($)
Dec. 31, 2025
Dec. 31, 2024
Dec. 31, 2023
Dec. 31, 2022
Dec. 31, 2021
PAY VERSUS PERFORMANCE
As required by Section 953(a) of the Dodd-Frank Wall Street Reform and Consumer Protection Act, and Item 402(v) of Regulation philosophy and how the company aligns executive compensation with the company’s performance, refer to the Compensation Discussion and Analysis.
S-K,
we are providing the following information about the relationship between “compensation actually paid” to our CEO and our other NEOs and certain financial performance of the company. Compensation actually paid, as determined under SEC requirements, does not reflect the actual amount of compensation earned by or paid to our executive officers during a covered year. For further information concerning the company’s pay-for-performance
Pay versus Performance Table
Summary Compensation Table Total for CEO (McAnnally) |
Average Summary Compensation Table Total for Other NEOs |
Value of Initial Fixed $100 Investment Based On: |
| |||||||||||||||||||||||||||||||||||||||||||||||
Year (1) |
Compensation Actually Paid to CEO (McAnnally) (2) |
Summary Compensation Table Total for CEO (Norton) |
Compensation Actually Paid to CEO (Norton) (2) |
Average Compensation Actually Paid to Other NEOs (2) |
ONE Gas Cumulative TSR |
Benchmarking Peer Group Cumulative TSR (3) |
Net Income ($Mn) |
Company Selected Performance Measure: EPS (4) | ||||||||||||||||||||||||||||||||||||||||||
2025 |
$5,575,027 |
$6,381,771 |
N/A |
N/A |
$1,611,740 |
$1,438,584 |
$119.72 |
$158.65 |
$264.22 |
4.37 |
||||||||||||||||||||||||||||||||||||||||
2024 |
$5,191,056 |
$4,996,766 |
N/A |
N/A |
$1,493,048 |
$1,425,371 |
$87.22 |
$115.59 |
$222.85 |
3.91 |
||||||||||||||||||||||||||||||||||||||||
2023 |
$4,504,545 |
$1,915,243 |
N/A |
N/A |
$1,699,861 |
$852,932 |
$77.14 |
$99.79 |
$231.23 |
4.14 |
||||||||||||||||||||||||||||||||||||||||
2022 |
$3,474,198 |
$2,938,903 |
N/A |
N/A |
$1,323,263 |
$1,269,028 |
$88.46 |
$103.89 |
$221.74 |
4.08 |
||||||||||||||||||||||||||||||||||||||||
2021 |
$2,584,173 |
$2,286,142 |
$4,331,191 |
$(1,331,503) |
$1,422,177 |
$1,081,408 |
$87.94 |
$98.68 |
$206.43 |
3.85 |
||||||||||||||||||||||||||||||||||||||||
| (1) | The CEO and other NEOs for the indicated years were as follows: |
• |
For 2025, our CEO was Robert S. McAnnally and our other NEOs were Christopher P. Sighinolfi, Curtis L. Dinan, Joseph L. McCormick, Mark A. Bender, and W. Kent Shortridge. |
• |
For 2024, our CEO was Robert S. McAnnally and our other NEOs were Christopher P. Sighinolfi, Curtis L. Dinan, Joseph L. McCormick and Mark A. Bender. |
• |
For 2023, our CEO was Robert S. McAnnally and our other NEOs were Caron A. Lawhorn, Curtis L. Dinan, Joseph L. McCormick and Mark A. Bender. |
• |
For 2022, our CEO was Robert S. McAnnally and our other NEOs were Caron A Lawhorn, Curtis L. Dinan, Joseph L. McCormick and Mark A. Bender. |
• |
For 2021, our CEO was Robert S. McAnnally, our former CEO was Pierce H. Norton II, and our other NEOs were Caron A. Lawhorn, Curtis L. Dinan, Joseph L. McCormick and Mark A. Bender. |
| (2) | Amounts reported in this column are based on total compensation reported for our CEO and the average of the total compensation reported for our other NEOs in the Summary Compensation Table for the 2025 fiscal year and adjusted as shown in the table below. |
2025 |
||||||||
CEO |
Other NEOs |
|||||||
| Total Compensation for CEO and average of total compensation for the other NEOs as reported SCT for the covered year |
|
$ 5,575,027 |
|
|
$ 1,611,740 |
| ||
| Deduct pension values reported in SCT for the covered year |
|
$ 0 |
|
|
($ 197,162 |
) | ||
| Deduct grant date fair value of equity awards reported in SCT for the covered year |
|
($ 3,154,361 |
) |
|
($ 548,783 |
) | ||
| Add pension value attributable to current year’s service and any change in pension value attributable to plan amendments made in the covered year |
|
$ 0 |
|
|
$ 35,262 |
| ||
| Add fair values as of the end of the covered year of all equity awards granted during the covered year that are outstanding and unvested as of the end of such covered year |
|
$3,275,687 |
|
|
$ 482,428 |
| ||
| Add fair value as of the vesting date of any awards granted in the covered year that vested during the covered year |
|
$ 0 |
|
|
$ 0 |
| ||
| Add dividends paid on unvested shares/share units and stock options |
|
$ 0 |
|
|
$ 0 |
| ||
| Add the change in fair value (whether positive or negative) as of the end of the covered year of any equity awards granted in any prior year that are outstanding and unvested as of the end of such covered year |
|
($ 649,839 |
) |
|
($ 114,502 |
) | ||
| Add the change in fair value (whether positive or negative) as of the vesting date of any equity awards granted in any prior year for which all applicable vesting conditions were satisfied during the covered year |
|
$ 35,578 |
|
|
$ 6,822 |
| ||
| Subtract the fair value of any equity awards granted in a prior year that were forfeited in the covered year determined as of the end of the prior year |
|
$ 0 |
|
|
$ 66,225 |
| ||
| Compensation Actually Paid to CEO and average of Compensation Actually Paid to other NEOs |
$6,381,771 |
$1,438,584 |
||||||
The fair value of equity awards was computed in accordance with the company’s methodology used for financial reporting purposes.
| (3) | The companies that composed the benchmarking peer group for 2024 and 2025 are as follows: Alliant Energy Corporation (LNT); Atmos Energy Corporation (ATO); Avista Corporation (AVA); Black Hills Corporation (BKH); IDACORP Inc. (IDA); New Jersey Resources Corporation (NJR); Northwest Natural Holding Company (NWN); NorthWestern Energy Group, Inc. (NWE); Pinnacle West Capital Corporation (PNW); Portland General Electric Company (POR); Southwest Gas Holdings, Inc. (SWX); Spire Inc. (SR); and TXNM Energy, Inc. (TXNM). The companies that composed the benchmarking peer group for 2021, 2022 and 2023 were the same except that in 2024 Black Hills Corporation replaced South Jersey Industries, Inc. due to South Jersey Industries’ acquisition by the Infrastructure Investments Fund in February 2023, and PNM Resources, Inc. changed its name to TXNM Energy, Inc. |
| (4) | In accordance with SEC rules, the company is required to include in the Pay versus Performance table the “most important” financial performance measure (as determined by the company) used to link compensation actually paid to our executive officer to company performance for the most recently completed fiscal year. The company determined EPS, which is a metric included in our incentive program, meets this requirement and therefore, we have included this performance measure in the Pay versus Performance table. |
| (1) | The CEO and other NEOs for the indicated years were as follows: |
• |
For 2025, our CEO was Robert S. McAnnally and our other NEOs were Christopher P. Sighinolfi, Curtis L. Dinan, Joseph L. McCormick, Mark A. Bender, and W. Kent Shortridge. |
• |
For 2024, our CEO was Robert S. McAnnally and our other NEOs were Christopher P. Sighinolfi, Curtis L. Dinan, Joseph L. McCormick and Mark A. Bender. |
• |
For 2023, our CEO was Robert S. McAnnally and our other NEOs were Caron A. Lawhorn, Curtis L. Dinan, Joseph L. McCormick and Mark A. Bender. |
• |
For 2022, our CEO was Robert S. McAnnally and our other NEOs were Caron A Lawhorn, Curtis L. Dinan, Joseph L. McCormick and Mark A. Bender. |
• |
For 2021, our CEO was Robert S. McAnnally, our former CEO was Pierce H. Norton II, and our other NEOs were Caron A. Lawhorn, Curtis L. Dinan, Joseph L. McCormick and Mark A. Bender. |
| (3) | The companies that composed the benchmarking peer group for 2024 and 2025 are as follows: Alliant Energy Corporation (LNT); Atmos Energy Corporation (ATO); Avista Corporation (AVA); Black Hills Corporation (BKH); IDACORP Inc. (IDA); New Jersey Resources Corporation (NJR); Northwest Natural Holding Company (NWN); NorthWestern Energy Group, Inc. (NWE); Pinnacle West Capital Corporation (PNW); Portland General Electric Company (POR); Southwest Gas Holdings, Inc. (SWX); Spire Inc. (SR); and TXNM Energy, Inc. (TXNM). The companies that composed the benchmarking peer group for 2021, 2022 and 2023 were the same except that in 2024 Black Hills Corporation replaced South Jersey Industries, Inc. due to South Jersey Industries’ acquisition by the Infrastructure Investments Fund in February 2023, and PNM Resources, Inc. changed its name to TXNM Energy, Inc. |
| (2) | Amounts reported in this column are based on total compensation reported for our CEO and the average of the total compensation reported for our other NEOs in the Summary Compensation Table for the 2025 fiscal year and adjusted as shown in the table below. |
2025 |
||||||||
CEO |
Other NEOs |
|||||||
| Total Compensation for CEO and average of total compensation for the other NEOs as reported SCT for the covered year |
|
$ 5,575,027 |
|
|
$ 1,611,740 |
| ||
| Deduct pension values reported in SCT for the covered year |
|
$ 0 |
|
|
($ 197,162 |
) | ||
| Deduct grant date fair value of equity awards reported in SCT for the covered year |
|
($ 3,154,361 |
) |
|
($ 548,783 |
) | ||
| Add pension value attributable to current year’s service and any change in pension value attributable to plan amendments made in the covered year |
|
$ 0 |
|
|
$ 35,262 |
| ||
| Add fair values as of the end of the covered year of all equity awards granted during the covered year that are outstanding and unvested as of the end of such covered year |
|
$3,275,687 |
|
|
$ 482,428 |
| ||
| Add fair value as of the vesting date of any awards granted in the covered year that vested during the covered year |
|
$ 0 |
|
|
$ 0 |
| ||
| Add dividends paid on unvested shares/share units and stock options |
|
$ 0 |
|
|
$ 0 |
| ||
| Add the change in fair value (whether positive or negative) as of the end of the covered year of any equity awards granted in any prior year that are outstanding and unvested as of the end of such covered year |
|
($ 649,839 |
) |
|
($ 114,502 |
) | ||
| Add the change in fair value (whether positive or negative) as of the vesting date of any equity awards granted in any prior year for which all applicable vesting conditions were satisfied during the covered year |
|
$ 35,578 |
|
|
$ 6,822 |
| ||
| Subtract the fair value of any equity awards granted in a prior year that were forfeited in the covered year determined as of the end of the prior year |
|
$ 0 |
|
|
$ 66,225 |
| ||
| Compensation Actually Paid to CEO and average of Compensation Actually Paid to other NEOs |
$6,381,771 |
$1,438,584 |
||||||
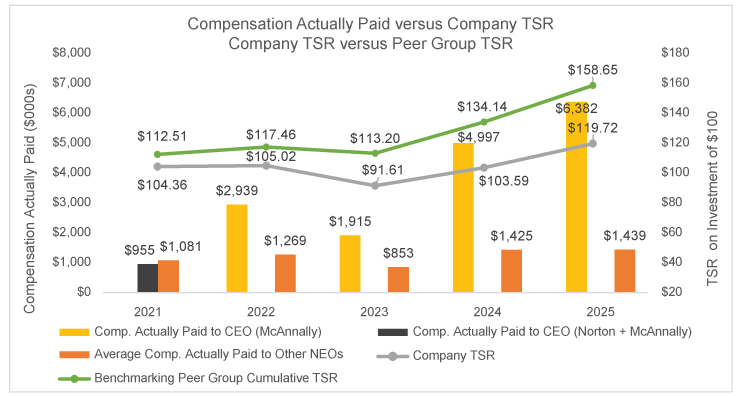
The following graph compares the compensation actually paid to our CEO(s), the average of the compensation actually paid to our other NEOs and the company’s TSR performance. The graph also compares the company’s TSR performance with the benchmarking peer group’s TSR performance. The company’s and the benchmarking peer group’s TSR amounts assume that $100 was invested beginning on December 31, 2020, and assumes reinvestment of all dividends.
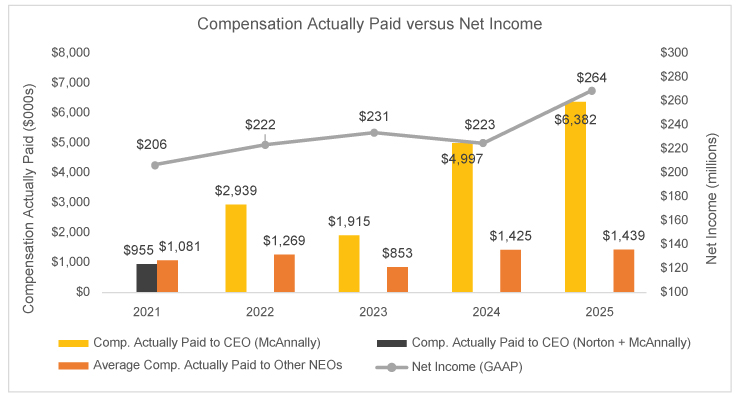
The following graph compares the compensation actually paid to our CEO(s) and the average of the compensation actually paid to our other NEOs with our net income.
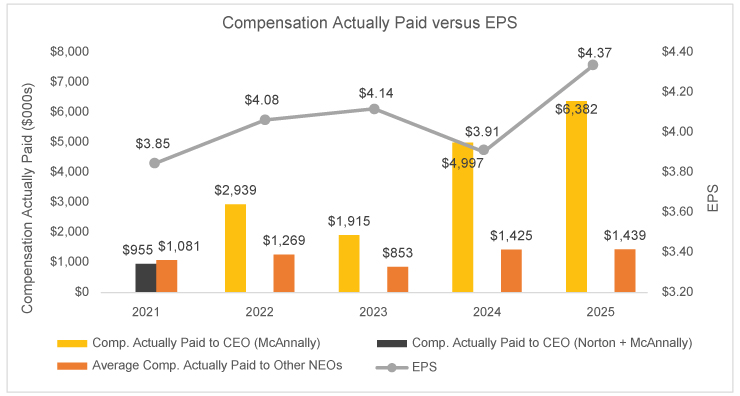
The following graph compares the compensation actually paid to our CEO(s) and the average of the compensation actually paid to our other NEOs with our EPS.
The following graph compares the compensation actually paid to our CEO(s), the average of the compensation actually paid to our other NEOs and the company’s TSR performance. The graph also compares the company’s TSR performance with the benchmarking peer group’s TSR performance. The company’s and the benchmarking peer group’s TSR amounts assume that $100 was invested beginning on December 31, 2020, and assumes reinvestment of all dividends.
Company’s Most Important Financial Performance Measures
The following are the most important financial performance measures (and
non-financial
performance measures), as determined by the company, that link compensation actually paid to our CEO and other NEOs to the company’s performance for the most recently completed fiscal year. • |
Diluted Earnings Per Share |
• |
Relative Total Shareholder Return |
• |
Emissions Reduction |
• |
Days Away, Restricted or Transferred Incident Rate |
• |
Preventable Vehicle Incident Rate |
• |
Emergency Response Time |