Shareholder Report
|
|
12 Months Ended |
Feb. 01, 2025 |
Jan. 31, 2026
USD ($)
Holding
|
| Shareholder Report [Line Items] |
|
|
| Document Type |
|
N-CSR
|
| Amendment Flag |
|
false
|
| Registrant Name |
|
DEUTSCHE DWS PORTFOLIO TRUST
|
| Entity Central Index Key |
|
0000088063
|
| Entity Investment Company Type |
|
N-1A
|
| Document Period End Date |
|
Jan. 31, 2026
|
| Shareholder Report Annual or Semi-Annual |
|
Annual Shareholder Report
|
| C000016770 |
|
|
| Shareholder Report [Line Items] |
|
|
| Fund Name |
|
DWS Total Return Bond Fund
|
| Class Name |
|
Class A
|
| Trading Symbol |
|
SZIAX
|
| Annual or Semi-Annual Statement [Text Block] |
|
This annual shareholder report contains important information about DWS Total Return Bond Fund (the "Fund") for the period February 1, 2025 to January 31, 2026.
|
| Additional Information [Text Block] |
|
You can find additional information about the Fund on the Fund's website at dws.com/mutualreports. You can also request this information by contacting us at (800) 728-3337.
|
| Material Fund Change Notice [Text Block] |
|
This report describes changes to the Fund that occurred during the reporting period.
|
| Additional Information Phone Number |
|
(800) 728-3337
|
| Additional Information Website |
|
<span style="box-sizing: border-box; color: rgb(0, 0, 0); display: inline; flex-wrap: nowrap; font-size: 14.6667px; font-weight: 300; grid-area: auto; line-height: 17.6px; margin: 0px; overflow: visible; text-align: left; text-align-last: auto; white-space-collapse: preserve-breaks;">dws.com/mutualreports</span>
|
| Expenses [Text Block] |
|
What were the Fund costs for the last year?(Based on a hypothetical $10,000 investment) Fund | Costs of a $10,000 investment | Costs paid as a percentage of a $10,000 investment |
|---|
Class A | $82 | 0.79% |
|---|
Gross expense ratio as of the latest prospectus: 0.99%. See prospectus for any contractual or voluntary waivers; without a waiver, costs would have been higher. |
| Expenses Paid, Amount |
|
$ 82
|
| Expense Ratio, Percent |
|
0.79%
|
| Factors Affecting Performance [Text Block] |
|
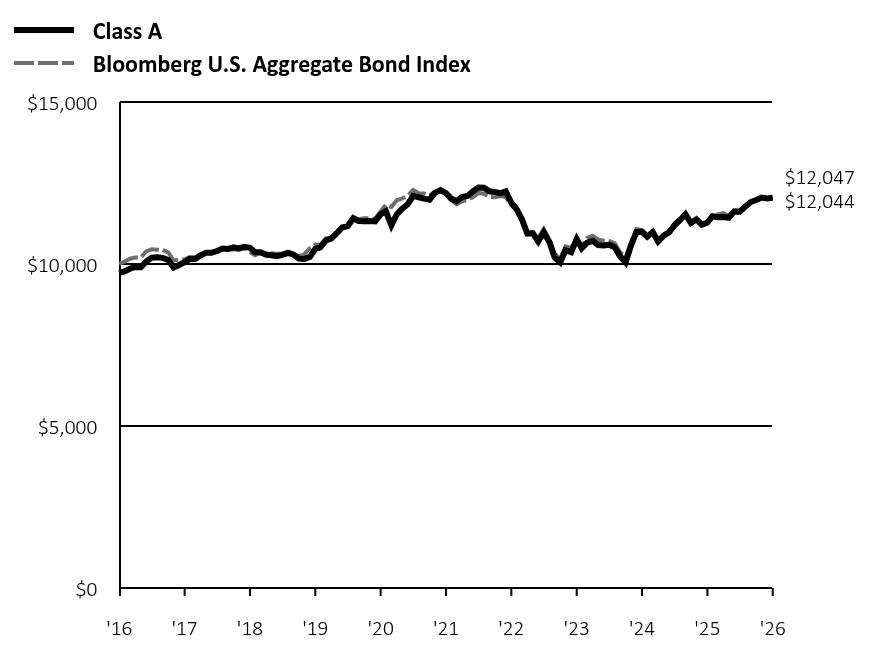
How did the Fund perform last year and what affected its performance? Class A shares of the Fund returned 6.78% (unadjusted for sales charges) for the period ended January 31, 2026. The Bloomberg U.S. Aggregate Bond Index returned 6.85% for the same period. The Fund’s strong total and absolute return for the 12 months ending January 31, 2026, in part reflects positive performance from overweights to credit-sensitive sectors and positioning with respect to interest rates. The Fund’s performance relative to the Bloomberg U.S. Aggregate Bond Index was supported by both overall security selection and asset allocation. Overweight exposure to risk assets that trade at a higher yield relative to Treasuries was motivated by a relatively stable economic backdrop featuring continued growth and low unemployment. In addition to a sound fundamental picture, the technical environment was also supportive of performance for credit-based assets as attractive all-in yields drove inflows into those sectors. In view of uncertainties around tariffs and inflation, the Fund tactically reduced risk at times to protect against downside outcomes or spread widening. In terms of specific exposures, positive contributions came from risk positioning in investment grade corporate bonds, most notably overweights to the banking/finance, energy, utility and communication subsectors. In addition, within financials, energy and utilities, performance benefited from holdings of securities that were lower in the capital structure or subordinated. An overweight to BBB-rated securities (the lowest investment grade category) across financials, industrials and utilities also proved additive. Overweight exposure to other credit-oriented sectors including collateralized loan obligations, asset-backed securities and commercial mortgage-backed securities contributed as well. Finally, the Fund was positioned to benefit as the Treasury yield curve steepened over the period, while tactical positioning with respect to duration and corresponding interest rate sensitivity allowed the Fund to take advantage as Treasury yields periodically declined. As the yield curve steepened, trades were implemented to take advantage of bonds experiencing price gains as they approach maturity and gravitate towards par value. There were no material detractors in terms of sector or interest rate positioning. |
| Performance Past Does Not Indicate Future [Text] |
|
The Fund's past performance is not a good predictor or guarantee of the Fund's future performance.
|
| Line Graph [Table Text Block] |
|
 | Class A | Bloomberg U.S. Aggregate Bond Index |
|---|
'16 | $9,725 | $10,000 |
|---|
'16 | $9,771 | $10,071 |
|---|
'16 | $9,854 | $10,163 |
|---|
'16 | $9,909 | $10,202 |
|---|
'16 | $9,899 | $10,205 |
|---|
'16 | $10,076 | $10,388 |
|---|
'16 | $10,197 | $10,454 |
|---|
'16 | $10,207 | $10,442 |
|---|
'16 | $10,188 | $10,436 |
|---|
'16 | $10,124 | $10,356 |
|---|
'16 | $9,890 | $10,111 |
|---|
'16 | $9,968 | $10,125 |
|---|
'17 | $10,055 | $10,145 |
|---|
'17 | $10,152 | $10,213 |
|---|
'17 | $10,156 | $10,208 |
|---|
'17 | $10,265 | $10,287 |
|---|
'17 | $10,347 | $10,366 |
|---|
'17 | $10,344 | $10,356 |
|---|
'17 | $10,400 | $10,400 |
|---|
'17 | $10,476 | $10,494 |
|---|
'17 | $10,465 | $10,444 |
|---|
'17 | $10,511 | $10,450 |
|---|
'17 | $10,481 | $10,436 |
|---|
'17 | $10,528 | $10,484 |
|---|
'18 | $10,498 | $10,363 |
|---|
'18 | $10,360 | $10,265 |
|---|
'18 | $10,360 | $10,331 |
|---|
'18 | $10,291 | $10,254 |
|---|
'18 | $10,271 | $10,327 |
|---|
'18 | $10,242 | $10,315 |
|---|
'18 | $10,282 | $10,317 |
|---|
'18 | $10,342 | $10,383 |
|---|
'18 | $10,293 | $10,317 |
|---|
'18 | $10,164 | $10,235 |
|---|
'18 | $10,155 | $10,296 |
|---|
'18 | $10,217 | $10,485 |
|---|
'19 | $10,470 | $10,597 |
|---|
'19 | $10,512 | $10,590 |
|---|
'19 | $10,726 | $10,794 |
|---|
'19 | $10,781 | $10,797 |
|---|
'19 | $10,948 | $10,988 |
|---|
'19 | $11,126 | $11,126 |
|---|
'19 | $11,170 | $11,151 |
|---|
'19 | $11,412 | $11,440 |
|---|
'19 | $11,325 | $11,379 |
|---|
'19 | $11,321 | $11,413 |
|---|
'19 | $11,323 | $11,407 |
|---|
'19 | $11,313 | $11,399 |
|---|
'20 | $11,533 | $11,619 |
|---|
'20 | $11,629 | $11,828 |
|---|
'20 | $11,191 | $11,758 |
|---|
'20 | $11,526 | $11,967 |
|---|
'20 | $11,704 | $12,023 |
|---|
'20 | $11,840 | $12,099 |
|---|
'20 | $12,103 | $12,279 |
|---|
'20 | $12,060 | $12,180 |
|---|
'20 | $12,017 | $12,173 |
|---|
'20 | $11,984 | $12,119 |
|---|
'20 | $12,195 | $12,238 |
|---|
'20 | $12,280 | $12,255 |
|---|
'21 | $12,183 | $12,167 |
|---|
'21 | $12,023 | $11,991 |
|---|
'21 | $11,938 | $11,842 |
|---|
'21 | $12,068 | $11,935 |
|---|
'21 | $12,100 | $11,974 |
|---|
'21 | $12,241 | $12,058 |
|---|
'21 | $12,361 | $12,193 |
|---|
'21 | $12,351 | $12,170 |
|---|
'21 | $12,244 | $12,065 |
|---|
'21 | $12,224 | $12,061 |
|---|
'21 | $12,182 | $12,097 |
|---|
'21 | $12,237 | $12,066 |
|---|
'22 | $11,890 | $11,806 |
|---|
'22 | $11,706 | $11,674 |
|---|
'22 | $11,380 | $11,350 |
|---|
'22 | $10,944 | $10,919 |
|---|
'22 | $10,945 | $10,990 |
|---|
'22 | $10,694 | $10,817 |
|---|
'22 | $10,971 | $11,082 |
|---|
'22 | $10,686 | $10,768 |
|---|
'22 | $10,202 | $10,303 |
|---|
'22 | $10,051 | $10,170 |
|---|
'22 | $10,423 | $10,544 |
|---|
'22 | $10,360 | $10,496 |
|---|
'23 | $10,767 | $10,819 |
|---|
'23 | $10,482 | $10,539 |
|---|
'23 | $10,658 | $10,807 |
|---|
'23 | $10,713 | $10,872 |
|---|
'23 | $10,587 | $10,754 |
|---|
'23 | $10,574 | $10,716 |
|---|
'23 | $10,596 | $10,708 |
|---|
'23 | $10,517 | $10,640 |
|---|
'23 | $10,243 | $10,369 |
|---|
'23 | $10,049 | $10,206 |
|---|
'23 | $10,558 | $10,668 |
|---|
'23 | $10,989 | $11,076 |
|---|
'24 | $10,993 | $11,046 |
|---|
'24 | $10,844 | $10,890 |
|---|
'24 | $10,987 | $10,990 |
|---|
'24 | $10,696 | $10,713 |
|---|
'24 | $10,876 | $10,894 |
|---|
'24 | $10,974 | $10,998 |
|---|
'24 | $11,191 | $11,255 |
|---|
'24 | $11,350 | $11,416 |
|---|
'24 | $11,533 | $11,569 |
|---|
'24 | $11,263 | $11,282 |
|---|
'24 | $11,376 | $11,401 |
|---|
'24 | $11,212 | $11,215 |
|---|
'25 | $11,279 | $11,274 |
|---|
'25 | $11,470 | $11,522 |
|---|
'25 | $11,442 | $11,527 |
|---|
'25 | $11,452 | $11,572 |
|---|
'25 | $11,427 | $11,489 |
|---|
'25 | $11,623 | $11,666 |
|---|
'25 | $11,611 | $11,635 |
|---|
'25 | $11,773 | $11,774 |
|---|
'25 | $11,912 | $11,903 |
|---|
'25 | $11,975 | $11,977 |
|---|
'25 | $12,050 | $12,052 |
|---|
'25 | $12,023 | $12,034 |
|---|
'26 | $12,044 | $12,047 |
|---|
|
| Average Annual Return [Table Text Block] |
|
Class/Index
| 1-Year | 5-Year | 10-Year |
|---|
Class A Unadjusted for Sales Charge | 6.78% | -0.23% | 2.16% |
|---|
Class A Adjusted for the Maximum Sales Charge (max 2.75% load) | 3.85% | -0.78% | 1.88% |
|---|
Bloomberg U.S. Aggregate Bond Index | 6.85% | -0.20% | 1.88% |
|---|
|
| No Deduction of Taxes [Text Block] |
|
The performance graph and returns table do not reflect the deduction of taxes that a shareholder would pay on Fund distributions or the redemption of Fund shares.
|
| Material Change Date |
Feb. 01, 2025
|
|
| AssetsNet |
|
$ 234,238,901
|
| Holdings Count | Holding |
|
340
|
| Advisory Fees Paid, Amount |
|
$ 721,189
|
| InvestmentCompanyPortfolioTurnover |
|
181.00%
|
| Additional Fund Statistics [Text Block] |
|
Net Assets ($) | 234,238,901 |
|---|
Number of Portfolio Holdings | 340 |
|---|
Portfolio Turnover Rate (%) | 181 |
|---|
Total Net Advisory Fees Paid ($) | 721,189 |
|---|
Effective Duration | 6.5 years |
|---|
Effective duration is an approximate measure of the Fund’s sensitivity to interest rate changes taking into consideration any maturity shortening features. |
| Holdings [Text Block] |
|
Asset Type | % of Net Assets |
|---|
Corporate Bonds | 38% |
|---|
Mortgage-Backed Securities Pass-Throughs | 22% |
|---|
Asset-Backed | 13% |
|---|
Commercial Mortgage-Backed Securities | 11% |
|---|
Collateralized Mortgage Obligations | 7% |
|---|
Government & Agency Obligations | 7% |
|---|
Warrants | 0% |
|---|
Cash Equivalents and Other Assets and Liabilities, Net | 2% |
|---|
Total | 100% |
|---|
Credit Rating | % of Net Assets |
|---|
AAA | 10% |
|---|
AA | 41% |
|---|
A | 10% |
|---|
BBB | 32% |
|---|
BB | 4% |
|---|
B | 0% |
|---|
CCC | 1% |
|---|
Not Rated | 2% |
|---|
|
| Credit Ratings Selection [Text Block] |
|
The quality ratings represent the highest of Moody’s Investors Service, Inc. (“Moody’s”), Fitch Ratings, Inc. (“Fitch”) or S&P Global Ratings (“S&P”) credit ratings. The ratings of Moody’s, Fitch and S&P represent their opinions as to the quality of the securities they rate. Credit quality measures a bond issuer’s ability to repay interest and principal in a timely manner. Ratings are relative and subjective and are not absolute standards of quality. Credit quality does not remove market risk and is subject to change.
|
| Material Fund Change [Text Block] |
|
This is a summary of certain changes of the Fund since February 1, 2025. For more information, review the Fund's current prospectus at dws.com/mutualreports, or call (800) 728-3337. Effective May 1, 2025, the Fund’s contractual cap on total annual operating expense for Class A shares changed from 0.75% to 0.80%. The cap excludes certain expenses such as extraordinary expenses, taxes, brokerage, interest expense and acquired fund fees and expenses. |
| Material Fund Change Expenses [Text Block] |
|
Effective May 1, 2025, the Fund’s contractual cap on total annual operating expense for Class A shares changed from 0.75% to 0.80%. The cap excludes certain expenses such as extraordinary expenses, taxes, brokerage, interest expense and acquired fund fees and expenses.
|
| Summary of Change Legend [Text Block] |
|
This is a summary of certain changes of the Fund since February 1, 2025. For more information, review the Fund's current prospectus at dws.com/mutualreports, or call (800) 728-3337.
|
| C000016773 |
|
|
| Shareholder Report [Line Items] |
|
|
| Fund Name |
|
DWS Total Return Bond Fund
|
| Class Name |
|
Class C
|
| Trading Symbol |
|
SZICX
|
| Annual or Semi-Annual Statement [Text Block] |
|
This annual shareholder report contains important information about DWS Total Return Bond Fund (the "Fund") for the period February 1, 2025 to January 31, 2026.
|
| Additional Information [Text Block] |
|
You can find additional information about the Fund on the Fund's website at dws.com/mutualreports. You can also request this information by contacting us at (800) 728-3337.
|
| Material Fund Change Notice [Text Block] |
|
This report describes changes to the Fund that occurred during the reporting period.
|
| Additional Information Phone Number |
|
(800) 728-3337
|
| Additional Information Website |
|
<span style="box-sizing: border-box; color: rgb(0, 0, 0); display: inline; flex-wrap: nowrap; font-size: 14.6667px; font-weight: 300; grid-area: auto; line-height: 17.6px; margin: 0px; overflow: visible; text-align: left; text-align-last: auto; white-space-collapse: preserve-breaks;">dws.com/mutualreports</span>
|
| Expenses [Text Block] |
|
What were the Fund costs for the last year?(Based on a hypothetical $10,000 investment) Fund | Costs of a $10,000 investment | Costs paid as a percentage of a $10,000 investment |
|---|
Class C | $159 | 1.54% |
|---|
Gross expense ratio as of the latest prospectus: 1.79%. See prospectus for any contractual or voluntary waivers; without a waiver, costs would have been higher. |
| Expenses Paid, Amount |
|
$ 159
|
| Expense Ratio, Percent |
|
1.54%
|
| Factors Affecting Performance [Text Block] |
|
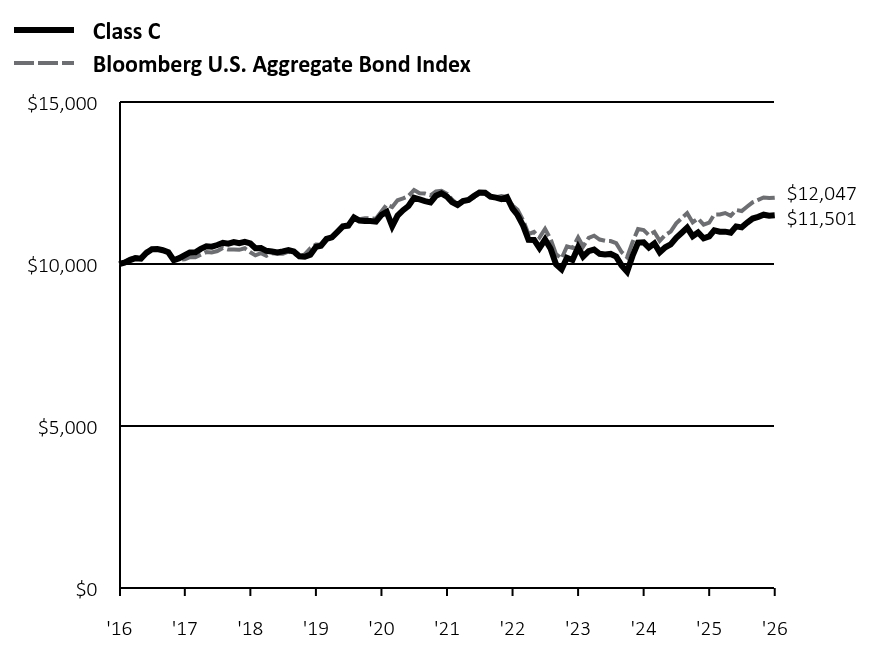
How did the Fund perform last year and what affected its performance? Class C shares of the Fund returned 5.99% (unadjusted for sales charges) for the period ended January 31, 2026. The Bloomberg U.S. Aggregate Bond Index returned 6.85% for the same period. The Fund’s strong total and absolute return for the 12 months ending January 31, 2026, in part reflects positive performance from overweights to credit-sensitive sectors and positioning with respect to interest rates. The Fund’s performance relative to the Bloomberg U.S. Aggregate Bond Index was supported by both overall security selection and asset allocation. Overweight exposure to risk assets that trade at a higher yield relative to Treasuries was motivated by a relatively stable economic backdrop featuring continued growth and low unemployment. In addition to a sound fundamental picture, the technical environment was also supportive of performance for credit-based assets as attractive all-in yields drove inflows into those sectors. In view of uncertainties around tariffs and inflation, the Fund tactically reduced risk at times to protect against downside outcomes or spread widening. In terms of specific exposures, positive contributions came from risk positioning in investment grade corporate bonds, most notably overweights to the banking/finance, energy, utility and communication subsectors. In addition, within financials, energy and utilities, performance benefited from holdings of securities that were lower in the capital structure or subordinated. An overweight to BBB-rated securities (the lowest investment grade category) across financials, industrials and utilities also proved additive. Overweight exposure to other credit-oriented sectors including collateralized loan obligations, asset-backed securities and commercial mortgage-backed securities contributed as well. Finally, the Fund was positioned to benefit as the Treasury yield curve steepened over the period, while tactical positioning with respect to duration and corresponding interest rate sensitivity allowed the Fund to take advantage as Treasury yields periodically declined. As the yield curve steepened, trades were implemented to take advantage of bonds experiencing price gains as they approach maturity and gravitate towards par value. There were no material detractors in terms of sector or interest rate positioning. |
| Performance Past Does Not Indicate Future [Text] |
|
The Fund's past performance is not a good predictor or guarantee of the Fund's future performance.
|
| Line Graph [Table Text Block] |
|
 | Class C | Bloomberg U.S. Aggregate Bond Index |
|---|
'16 | $10,000 | $10,000 |
|---|
'16 | $10,041 | $10,071 |
|---|
'16 | $10,120 | $10,163 |
|---|
'16 | $10,180 | $10,202 |
|---|
'16 | $10,164 | $10,205 |
|---|
'16 | $10,338 | $10,388 |
|---|
'16 | $10,456 | $10,454 |
|---|
'16 | $10,459 | $10,442 |
|---|
'16 | $10,424 | $10,436 |
|---|
'16 | $10,361 | $10,356 |
|---|
'16 | $10,116 | $10,111 |
|---|
'16 | $10,179 | $10,125 |
|---|
'17 | $10,272 | $10,145 |
|---|
'17 | $10,355 | $10,213 |
|---|
'17 | $10,362 | $10,208 |
|---|
'17 | $10,467 | $10,287 |
|---|
'17 | $10,543 | $10,366 |
|---|
'17 | $10,534 | $10,356 |
|---|
'17 | $10,585 | $10,400 |
|---|
'17 | $10,654 | $10,494 |
|---|
'17 | $10,627 | $10,444 |
|---|
'17 | $10,677 | $10,450 |
|---|
'17 | $10,640 | $10,436 |
|---|
'17 | $10,681 | $10,484 |
|---|
'18 | $10,633 | $10,363 |
|---|
'18 | $10,488 | $10,265 |
|---|
'18 | $10,491 | $10,331 |
|---|
'18 | $10,405 | $10,254 |
|---|
'18 | $10,388 | $10,327 |
|---|
'18 | $10,353 | $10,315 |
|---|
'18 | $10,387 | $10,317 |
|---|
'18 | $10,431 | $10,383 |
|---|
'18 | $10,385 | $10,317 |
|---|
'18 | $10,238 | $10,235 |
|---|
'18 | $10,223 | $10,296 |
|---|
'18 | $10,288 | $10,485 |
|---|
'19 | $10,526 | $10,597 |
|---|
'19 | $10,562 | $10,590 |
|---|
'19 | $10,771 | $10,794 |
|---|
'19 | $10,819 | $10,797 |
|---|
'19 | $10,990 | $10,988 |
|---|
'19 | $11,161 | $11,126 |
|---|
'19 | $11,189 | $11,151 |
|---|
'19 | $11,433 | $11,440 |
|---|
'19 | $11,340 | $11,379 |
|---|
'19 | $11,329 | $11,413 |
|---|
'19 | $11,323 | $11,407 |
|---|
'19 | $11,307 | $11,399 |
|---|
'20 | $11,519 | $11,619 |
|---|
'20 | $11,607 | $11,828 |
|---|
'20 | $11,164 | $11,758 |
|---|
'20 | $11,491 | $11,967 |
|---|
'20 | $11,660 | $12,023 |
|---|
'20 | $11,789 | $12,099 |
|---|
'20 | $12,042 | $12,279 |
|---|
'20 | $11,992 | $12,180 |
|---|
'20 | $11,942 | $12,173 |
|---|
'20 | $11,902 | $12,119 |
|---|
'20 | $12,104 | $12,238 |
|---|
'20 | $12,180 | $12,255 |
|---|
'21 | $12,076 | $12,167 |
|---|
'21 | $11,911 | $11,991 |
|---|
'21 | $11,820 | $11,842 |
|---|
'21 | $11,940 | $11,935 |
|---|
'21 | $11,976 | $11,974 |
|---|
'21 | $12,097 | $12,058 |
|---|
'21 | $12,207 | $12,193 |
|---|
'21 | $12,201 | $12,170 |
|---|
'21 | $12,077 | $12,065 |
|---|
'21 | $12,049 | $12,061 |
|---|
'21 | $12,000 | $12,097 |
|---|
'21 | $12,058 | $12,066 |
|---|
'22 | $11,709 | $11,806 |
|---|
'22 | $11,511 | $11,674 |
|---|
'22 | $11,183 | $11,350 |
|---|
'22 | $10,748 | $10,919 |
|---|
'22 | $10,743 | $10,990 |
|---|
'22 | $10,490 | $10,817 |
|---|
'22 | $10,755 | $11,082 |
|---|
'22 | $10,469 | $10,768 |
|---|
'22 | $9,990 | $10,303 |
|---|
'22 | $9,835 | $10,170 |
|---|
'22 | $10,193 | $10,544 |
|---|
'22 | $10,125 | $10,496 |
|---|
'23 | $10,515 | $10,819 |
|---|
'23 | $10,231 | $10,539 |
|---|
'23 | $10,397 | $10,807 |
|---|
'23 | $10,443 | $10,872 |
|---|
'23 | $10,314 | $10,754 |
|---|
'23 | $10,296 | $10,716 |
|---|
'23 | $10,310 | $10,708 |
|---|
'23 | $10,227 | $10,640 |
|---|
'23 | $9,955 | $10,369 |
|---|
'23 | $9,760 | $10,206 |
|---|
'23 | $10,247 | $10,668 |
|---|
'23 | $10,659 | $11,076 |
|---|
'24 | $10,666 | $11,046 |
|---|
'24 | $10,505 | $10,890 |
|---|
'24 | $10,636 | $10,990 |
|---|
'24 | $10,360 | $10,713 |
|---|
'24 | $10,516 | $10,894 |
|---|
'24 | $10,604 | $10,998 |
|---|
'24 | $10,807 | $11,255 |
|---|
'24 | $10,965 | $11,416 |
|---|
'24 | $11,123 | $11,569 |
|---|
'24 | $10,856 | $11,282 |
|---|
'24 | $10,971 | $11,401 |
|---|
'24 | $10,794 | $11,215 |
|---|
'25 | $10,851 | $11,274 |
|---|
'25 | $11,040 | $11,522 |
|---|
'25 | $10,995 | $11,527 |
|---|
'25 | $10,998 | $11,572 |
|---|
'25 | $10,966 | $11,489 |
|---|
'25 | $11,160 | $11,666 |
|---|
'25 | $11,129 | $11,635 |
|---|
'25 | $11,277 | $11,774 |
|---|
'25 | $11,402 | $11,903 |
|---|
'25 | $11,456 | $11,977 |
|---|
'25 | $11,521 | $12,052 |
|---|
'25 | $11,487 | $12,034 |
|---|
'26 | $11,501 | $12,047 |
|---|
|
| Average Annual Return [Table Text Block] |
|
Class/Index
| 1-Year | 5-Year | 10-Year |
|---|
Class C Unadjusted for Sales Charge | 5.99% | -0.97% | 1.41% |
|---|
Class C Adjusted for the Maximum Sales Charge (max 1.00% CDSC) | 4.99% | -0.97% | 1.41% |
|---|
Bloomberg U.S. Aggregate Bond Index | 6.85% | -0.20% | 1.88% |
|---|
|
| No Deduction of Taxes [Text Block] |
|
The performance graph and returns table do not reflect the deduction of taxes that a shareholder would pay on Fund distributions or the redemption of Fund shares.
|
| Material Change Date |
Feb. 01, 2025
|
|
| AssetsNet |
|
$ 234,238,901
|
| Holdings Count | Holding |
|
340
|
| Advisory Fees Paid, Amount |
|
$ 721,189
|
| InvestmentCompanyPortfolioTurnover |
|
181.00%
|
| Additional Fund Statistics [Text Block] |
|
Net Assets ($) | 234,238,901 |
|---|
Number of Portfolio Holdings | 340 |
|---|
Portfolio Turnover Rate (%) | 181 |
|---|
Total Net Advisory Fees Paid ($) | 721,189 |
|---|
Effective Duration | 6.5 years |
|---|
Effective duration is an approximate measure of the Fund’s sensitivity to interest rate changes taking into consideration any maturity shortening features. |
| Holdings [Text Block] |
|
Asset Type | % of Net Assets |
|---|
Corporate Bonds | 38% |
|---|
Mortgage-Backed Securities Pass-Throughs | 22% |
|---|
Asset-Backed | 13% |
|---|
Commercial Mortgage-Backed Securities | 11% |
|---|
Collateralized Mortgage Obligations | 7% |
|---|
Government & Agency Obligations | 7% |
|---|
Warrants | 0% |
|---|
Cash Equivalents and Other Assets and Liabilities, Net | 2% |
|---|
Total | 100% |
|---|
Credit Rating | % of Net Assets |
|---|
AAA | 10% |
|---|
AA | 41% |
|---|
A | 10% |
|---|
BBB | 32% |
|---|
BB | 4% |
|---|
B | 0% |
|---|
CCC | 1% |
|---|
Not Rated | 2% |
|---|
|
| Credit Ratings Selection [Text Block] |
|
The quality ratings represent the highest of Moody’s Investors Service, Inc. (“Moody’s”), Fitch Ratings, Inc. (“Fitch”) or S&P Global Ratings (“S&P”) credit ratings. The ratings of Moody’s, Fitch and S&P represent their opinions as to the quality of the securities they rate. Credit quality measures a bond issuer’s ability to repay interest and principal in a timely manner. Ratings are relative and subjective and are not absolute standards of quality. Credit quality does not remove market risk and is subject to change.
|
| Material Fund Change [Text Block] |
|
This is a summary of certain changes of the Fund since February 1, 2025. For more information, review the Fund's current prospectus at dws.com/mutualreports, or call (800) 728-3337. Effective May 1, 2025, the Fund’s contractual cap on total annual operating expense for Class C shares changed from 1.50% to 1.55%. The cap excludes certain expenses such as extraordinary expenses, taxes, brokerage, interest expense and acquired fund fees and expenses. |
| Material Fund Change Expenses [Text Block] |
|
Effective May 1, 2025, the Fund’s contractual cap on total annual operating expense for Class C shares changed from 1.50% to 1.55%. The cap excludes certain expenses such as extraordinary expenses, taxes, brokerage, interest expense and acquired fund fees and expenses.
|
| Summary of Change Legend [Text Block] |
|
This is a summary of certain changes of the Fund since February 1, 2025. For more information, review the Fund's current prospectus at dws.com/mutualreports, or call (800) 728-3337.
|
| C000016774 |
|
|
| Shareholder Report [Line Items] |
|
|
| Fund Name |
|
DWS Total Return Bond Fund
|
| Class Name |
|
Class S
|
| Trading Symbol |
|
SCSBX
|
| Annual or Semi-Annual Statement [Text Block] |
|
This annual shareholder report contains important information about DWS Total Return Bond Fund (the "Fund") for the period February 1, 2025 to January 31, 2026.
|
| Additional Information [Text Block] |
|
You can find additional information about the Fund on the Fund's website at dws.com/mutualreports. You can also request this information by contacting us at (800) 728-3337.
|
| Material Fund Change Notice [Text Block] |
|
This report describes changes to the Fund that occurred during the reporting period.
|
| Additional Information Phone Number |
|
(800) 728-3337
|
| Additional Information Website |
|
<span style="box-sizing: border-box; color: rgb(0, 0, 0); display: inline; flex-wrap: nowrap; font-size: 14.6667px; font-weight: 300; grid-area: auto; line-height: 17.6px; margin: 0px; overflow: visible; text-align: left; text-align-last: auto; white-space-collapse: preserve-breaks;">dws.com/mutualreports</span>
|
| Expenses [Text Block] |
|
What were the Fund costs for the last year?(Based on a hypothetical $10,000 investment) Fund | Costs of a $10,000 investment | Costs paid as a percentage of a $10,000 investment |
|---|
Class S | $56 | 0.54% |
|---|
Gross expense ratio as of the latest prospectus: 0.74%. See prospectus for any contractual or voluntary waivers; without a waiver, costs would have been higher. |
| Expenses Paid, Amount |
|
$ 56
|
| Expense Ratio, Percent |
|
0.54%
|
| Factors Affecting Performance [Text Block] |
|
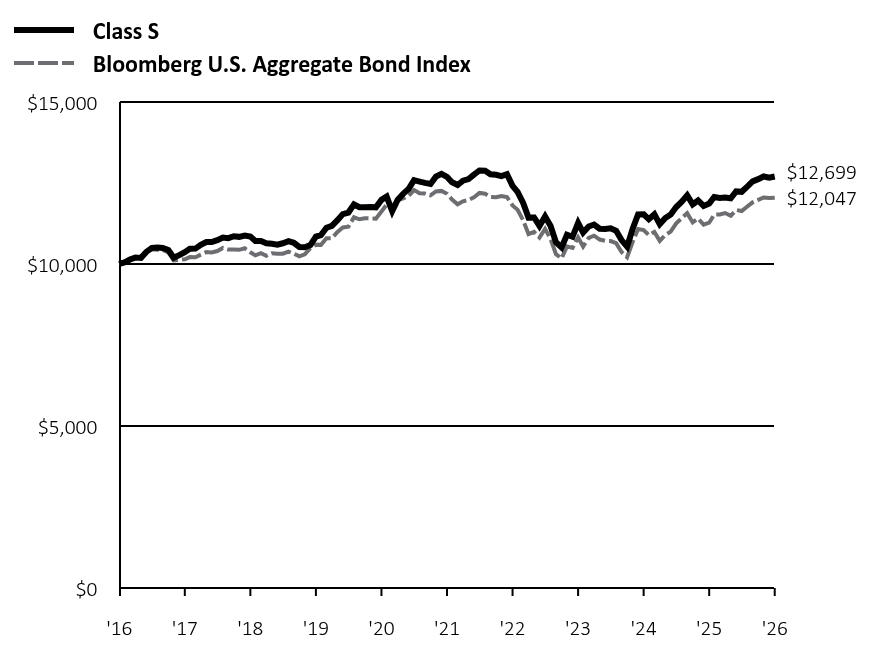
How did the Fund perform last year and what affected its performance? Class S shares of the Fund returned 7.06% for the period ended January 31, 2026. The Bloomberg U.S. Aggregate Bond Index returned 6.85% for the same period. The Fund’s strong total and absolute return for the 12 months ending January 31, 2026, in part reflects positive performance from overweights to credit-sensitive sectors and positioning with respect to interest rates. The Fund’s performance relative to the Bloomberg U.S. Aggregate Bond Index was supported by both overall security selection and asset allocation. Overweight exposure to risk assets that trade at a higher yield relative to Treasuries was motivated by a relatively stable economic backdrop featuring continued growth and low unemployment. In addition to a sound fundamental picture, the technical environment was also supportive of performance for credit-based assets as attractive all-in yields drove inflows into those sectors. In view of uncertainties around tariffs and inflation, the Fund tactically reduced risk at times to protect against downside outcomes or spread widening. In terms of specific exposures, positive contributions came from risk positioning in investment grade corporate bonds, most notably overweights to the banking/finance, energy, utility and communication subsectors. In addition, within financials, energy and utilities, performance benefited from holdings of securities that were lower in the capital structure or subordinated. An overweight to BBB-rated securities (the lowest investment grade category) across financials, industrials and utilities also proved additive. Overweight exposure to other credit-oriented sectors including collateralized loan obligations, asset-backed securities and commercial mortgage-backed securities contributed as well. Finally, the Fund was positioned to benefit as the Treasury yield curve steepened over the period, while tactical positioning with respect to duration and corresponding interest rate sensitivity allowed the Fund to take advantage as Treasury yields periodically declined. As the yield curve steepened, trades were implemented to take advantage of bonds experiencing price gains as they approach maturity and gravitate towards par value. There were no material detractors in terms of sector or interest rate positioning. |
| Performance Past Does Not Indicate Future [Text] |
|
The Fund's past performance is not a good predictor or guarantee of the Fund's future performance.
|
| Line Graph [Table Text Block] |
|
 | Class S | Bloomberg U.S. Aggregate Bond Index |
|---|
'16 | $10,000 | $10,000 |
|---|
'16 | $10,049 | $10,071 |
|---|
'16 | $10,137 | $10,163 |
|---|
'16 | $10,196 | $10,202 |
|---|
'16 | $10,188 | $10,205 |
|---|
'16 | $10,372 | $10,388 |
|---|
'16 | $10,498 | $10,454 |
|---|
'16 | $10,510 | $10,442 |
|---|
'16 | $10,494 | $10,436 |
|---|
'16 | $10,430 | $10,356 |
|---|
'16 | $10,191 | $10,111 |
|---|
'16 | $10,273 | $10,125 |
|---|
'17 | $10,365 | $10,145 |
|---|
'17 | $10,468 | $10,213 |
|---|
'17 | $10,473 | $10,208 |
|---|
'17 | $10,589 | $10,287 |
|---|
'17 | $10,675 | $10,366 |
|---|
'17 | $10,675 | $10,356 |
|---|
'17 | $10,735 | $10,400 |
|---|
'17 | $10,815 | $10,494 |
|---|
'17 | $10,796 | $10,444 |
|---|
'17 | $10,856 | $10,450 |
|---|
'17 | $10,837 | $10,436 |
|---|
'17 | $10,878 | $10,484 |
|---|
'18 | $10,849 | $10,363 |
|---|
'18 | $10,709 | $10,265 |
|---|
'18 | $10,711 | $10,331 |
|---|
'18 | $10,641 | $10,254 |
|---|
'18 | $10,623 | $10,327 |
|---|
'18 | $10,595 | $10,315 |
|---|
'18 | $10,639 | $10,317 |
|---|
'18 | $10,704 | $10,383 |
|---|
'18 | $10,655 | $10,317 |
|---|
'18 | $10,524 | $10,235 |
|---|
'18 | $10,517 | $10,296 |
|---|
'18 | $10,583 | $10,485 |
|---|
'19 | $10,847 | $10,597 |
|---|
'19 | $10,893 | $10,590 |
|---|
'19 | $11,117 | $10,794 |
|---|
'19 | $11,176 | $10,797 |
|---|
'19 | $11,352 | $10,988 |
|---|
'19 | $11,539 | $11,126 |
|---|
'19 | $11,587 | $11,151 |
|---|
'19 | $11,840 | $11,440 |
|---|
'19 | $11,753 | $11,379 |
|---|
'19 | $11,751 | $11,413 |
|---|
'19 | $11,755 | $11,407 |
|---|
'19 | $11,748 | $11,399 |
|---|
'20 | $11,979 | $11,619 |
|---|
'20 | $12,080 | $11,828 |
|---|
'20 | $11,629 | $11,758 |
|---|
'20 | $11,979 | $11,967 |
|---|
'20 | $12,166 | $12,023 |
|---|
'20 | $12,310 | $12,099 |
|---|
'20 | $12,586 | $12,279 |
|---|
'20 | $12,544 | $12,180 |
|---|
'20 | $12,502 | $12,173 |
|---|
'20 | $12,470 | $12,119 |
|---|
'20 | $12,693 | $12,238 |
|---|
'20 | $12,783 | $12,255 |
|---|
'21 | $12,685 | $12,167 |
|---|
'21 | $12,521 | $11,991 |
|---|
'21 | $12,436 | $11,842 |
|---|
'21 | $12,573 | $11,935 |
|---|
'21 | $12,621 | $11,974 |
|---|
'21 | $12,759 | $12,058 |
|---|
'21 | $12,887 | $12,193 |
|---|
'21 | $12,879 | $12,170 |
|---|
'21 | $12,770 | $12,065 |
|---|
'21 | $12,752 | $12,061 |
|---|
'21 | $12,711 | $12,097 |
|---|
'21 | $12,771 | $12,066 |
|---|
'22 | $12,412 | $11,806 |
|---|
'22 | $12,222 | $11,674 |
|---|
'22 | $11,884 | $11,350 |
|---|
'22 | $11,431 | $10,919 |
|---|
'22 | $11,435 | $10,990 |
|---|
'22 | $11,174 | $10,817 |
|---|
'22 | $11,466 | $11,082 |
|---|
'22 | $11,171 | $10,768 |
|---|
'22 | $10,668 | $10,303 |
|---|
'22 | $10,512 | $10,170 |
|---|
'22 | $10,903 | $10,544 |
|---|
'22 | $10,839 | $10,496 |
|---|
'23 | $11,268 | $10,819 |
|---|
'23 | $10,971 | $10,539 |
|---|
'23 | $11,158 | $10,807 |
|---|
'23 | $11,218 | $10,872 |
|---|
'23 | $11,088 | $10,754 |
|---|
'23 | $11,077 | $10,716 |
|---|
'23 | $11,103 | $10,708 |
|---|
'23 | $11,022 | $10,640 |
|---|
'23 | $10,737 | $10,369 |
|---|
'23 | $10,536 | $10,206 |
|---|
'23 | $11,072 | $10,668 |
|---|
'23 | $11,527 | $11,076 |
|---|
'24 | $11,532 | $11,046 |
|---|
'24 | $11,379 | $10,890 |
|---|
'24 | $11,531 | $10,990 |
|---|
'24 | $11,228 | $10,713 |
|---|
'24 | $11,420 | $10,894 |
|---|
'24 | $11,525 | $10,998 |
|---|
'24 | $11,756 | $11,255 |
|---|
'24 | $11,925 | $11,416 |
|---|
'24 | $12,120 | $11,569 |
|---|
'24 | $11,838 | $11,282 |
|---|
'24 | $11,960 | $11,401 |
|---|
'24 | $11,790 | $11,215 |
|---|
'25 | $11,862 | $11,274 |
|---|
'25 | $12,066 | $11,522 |
|---|
'25 | $12,039 | $11,527 |
|---|
'25 | $12,053 | $11,572 |
|---|
'25 | $12,028 | $11,489 |
|---|
'25 | $12,238 | $11,666 |
|---|
'25 | $12,227 | $11,635 |
|---|
'25 | $12,388 | $11,774 |
|---|
'25 | $12,550 | $11,903 |
|---|
'25 | $12,618 | $11,977 |
|---|
'25 | $12,701 | $12,052 |
|---|
'25 | $12,661 | $12,034 |
|---|
'26 | $12,699 | $12,047 |
|---|
|
| Average Annual Return [Table Text Block] |
|
Class/Index
| 1-Year | 5-Year | 10-Year |
|---|
Class S No Sales Charge | 7.06% | 0.02% | 2.42% |
|---|
Bloomberg U.S. Aggregate Bond Index | 6.85% | -0.20% | 1.88% |
|---|
|
| No Deduction of Taxes [Text Block] |
|
The performance graph and returns table do not reflect the deduction of taxes that a shareholder would pay on Fund distributions or the redemption of Fund shares.
|
| Material Change Date |
Feb. 01, 2025
|
|
| AssetsNet |
|
$ 234,238,901
|
| Holdings Count | Holding |
|
340
|
| Advisory Fees Paid, Amount |
|
$ 721,189
|
| InvestmentCompanyPortfolioTurnover |
|
181.00%
|
| Additional Fund Statistics [Text Block] |
|
Net Assets ($) | 234,238,901 |
|---|
Number of Portfolio Holdings | 340 |
|---|
Portfolio Turnover Rate (%) | 181 |
|---|
Total Net Advisory Fees Paid ($) | 721,189 |
|---|
Effective Duration | 6.5 years |
|---|
Effective duration is an approximate measure of the Fund’s sensitivity to interest rate changes taking into consideration any maturity shortening features. |
| Holdings [Text Block] |
|
Asset Type | % of Net Assets |
|---|
Corporate Bonds | 38% |
|---|
Mortgage-Backed Securities Pass-Throughs | 22% |
|---|
Asset-Backed | 13% |
|---|
Commercial Mortgage-Backed Securities | 11% |
|---|
Collateralized Mortgage Obligations | 7% |
|---|
Government & Agency Obligations | 7% |
|---|
Warrants | 0% |
|---|
Cash Equivalents and Other Assets and Liabilities, Net | 2% |
|---|
Total | 100% |
|---|
Credit Rating | % of Net Assets |
|---|
AAA | 10% |
|---|
AA | 41% |
|---|
A | 10% |
|---|
BBB | 32% |
|---|
BB | 4% |
|---|
B | 0% |
|---|
CCC | 1% |
|---|
Not Rated | 2% |
|---|
|
| Credit Ratings Selection [Text Block] |
|
The quality ratings represent the highest of Moody’s Investors Service, Inc. (“Moody’s”), Fitch Ratings, Inc. (“Fitch”) or S&P Global Ratings (“S&P”) credit ratings. The ratings of Moody’s, Fitch and S&P represent their opinions as to the quality of the securities they rate. Credit quality measures a bond issuer’s ability to repay interest and principal in a timely manner. Ratings are relative and subjective and are not absolute standards of quality. Credit quality does not remove market risk and is subject to change.
|
| Material Fund Change [Text Block] |
|
This is a summary of certain changes of the Fund since February 1, 2025. For more information, review the Fund's current prospectus at dws.com/mutualreports, or call (800) 728-3337. Effective May 1, 2025, the Fund’s contractual cap on total annual operating expense for Class S shares changed from 0.50% to 0.55%. The cap excludes certain expenses such as extraordinary expenses, taxes, brokerage, interest expense and acquired fund fees and expenses. |
| Material Fund Change Expenses [Text Block] |
|
Effective May 1, 2025, the Fund’s contractual cap on total annual operating expense for Class S shares changed from 0.50% to 0.55%. The cap excludes certain expenses such as extraordinary expenses, taxes, brokerage, interest expense and acquired fund fees and expenses.
|
| Summary of Change Legend [Text Block] |
|
This is a summary of certain changes of the Fund since February 1, 2025. For more information, review the Fund's current prospectus at dws.com/mutualreports, or call (800) 728-3337.
|
| C000016775 |
|
|
| Shareholder Report [Line Items] |
|
|
| Fund Name |
|
DWS Total Return Bond Fund
|
| Class Name |
|
Institutional Class
|
| Trading Symbol |
|
SZIIX
|
| Annual or Semi-Annual Statement [Text Block] |
|
This annual shareholder report contains important information about DWS Total Return Bond Fund (the "Fund") for the period February 1, 2025 to January 31, 2026.
|
| Additional Information [Text Block] |
|
You can find additional information about the Fund on the Fund's website at dws.com/mutualreports. You can also request this information by contacting us at (800) 728-3337.
|
| Material Fund Change Notice [Text Block] |
|
This report describes changes to the Fund that occurred during the reporting period.
|
| Additional Information Phone Number |
|
(800) 728-3337
|
| Additional Information Website |
|
<span style="box-sizing: border-box; color: rgb(0, 0, 0); display: inline; flex-wrap: nowrap; font-size: 14.6667px; font-weight: 300; grid-area: auto; line-height: 17.6px; margin: 0px; overflow: visible; text-align: left; text-align-last: auto; white-space-collapse: preserve-breaks;">dws.com/mutualreports</span>
|
| Expenses [Text Block] |
|
What were the Fund costs for the last year?(Based on a hypothetical $10,000 investment) Fund | Costs of a $10,000 investment | Costs paid as a percentage of a $10,000 investment |
|---|
Institutional Class | $56 | 0.54% |
|---|
Gross expense ratio as of the latest prospectus: 0.73%. See prospectus for any contractual or voluntary waivers; without a waiver, costs would have been higher. |
| Expenses Paid, Amount |
|
$ 56
|
| Expense Ratio, Percent |
|
0.54%
|
| Factors Affecting Performance [Text Block] |
|
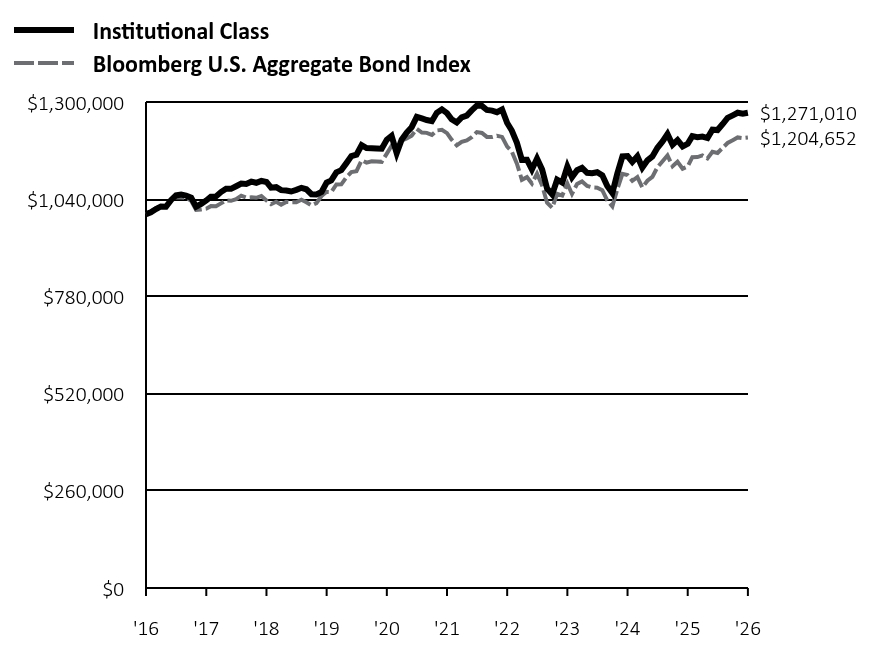
How did the Fund perform last year and what affected its performance? Institutional Class shares of the Fund returned 6.98% for the period ended January 31, 2026. The Bloomberg U.S. Aggregate Bond Index returned 6.85% for the same period. The Fund’s strong total and absolute return for the 12 months ending January 31, 2026, in part reflects positive performance from overweights to credit-sensitive sectors and positioning with respect to interest rates. The Fund’s performance relative to the Bloomberg U.S. Aggregate Bond Index was supported by both overall security selection and asset allocation. Overweight exposure to risk assets that trade at a higher yield relative to Treasuries was motivated by a relatively stable economic backdrop featuring continued growth and low unemployment. In addition to a sound fundamental picture, the technical environment was also supportive of performance for credit-based assets as attractive all-in yields drove inflows into those sectors. In view of uncertainties around tariffs and inflation, the Fund tactically reduced risk at times to protect against downside outcomes or spread widening. In terms of specific exposures, positive contributions came from risk positioning in investment grade corporate bonds, most notably overweights to the banking/finance, energy, utility and communication subsectors. In addition, within financials, energy and utilities, performance benefited from holdings of securities that were lower in the capital structure or subordinated. An overweight to BBB-rated securities (the lowest investment grade category) across financials, industrials and utilities also proved additive. Overweight exposure to other credit-oriented sectors including collateralized loan obligations, asset-backed securities and commercial mortgage-backed securities contributed as well. Finally, the Fund was positioned to benefit as the Treasury yield curve steepened over the period, while tactical positioning with respect to duration and corresponding interest rate sensitivity allowed the Fund to take advantage as Treasury yields periodically declined. As the yield curve steepened, trades were implemented to take advantage of bonds experiencing price gains as they approach maturity and gravitate towards par value. There were no material detractors in terms of sector or interest rate positioning. |
| Performance Past Does Not Indicate Future [Text] |
|
The Fund's past performance is not a good predictor or guarantee of the Fund's future performance.
|
| Line Graph [Table Text Block] |
|
 | Institutional Class | Bloomberg U.S. Aggregate Bond Index |
|---|
'16 | $1,000,000 | $1,000,000 |
|---|
'16 | $1,004,929 | $1,007,094 |
|---|
'16 | $1,013,714 | $1,016,334 |
|---|
'16 | $1,020,598 | $1,020,235 |
|---|
'16 | $1,019,793 | $1,020,497 |
|---|
'16 | $1,037,308 | $1,038,833 |
|---|
'16 | $1,050,024 | $1,045,401 |
|---|
'16 | $1,052,211 | $1,044,206 |
|---|
'16 | $1,049,556 | $1,043,594 |
|---|
'16 | $1,044,064 | $1,035,612 |
|---|
'16 | $1,020,056 | $1,011,116 |
|---|
'16 | $1,027,340 | $1,012,542 |
|---|
'17 | $1,036,603 | $1,014,529 |
|---|
'17 | $1,046,862 | $1,021,348 |
|---|
'17 | $1,047,420 | $1,020,812 |
|---|
'17 | $1,059,000 | $1,028,690 |
|---|
'17 | $1,067,662 | $1,036,608 |
|---|
'17 | $1,067,601 | $1,035,565 |
|---|
'17 | $1,074,616 | $1,040,021 |
|---|
'17 | $1,081,648 | $1,049,350 |
|---|
'17 | $1,080,699 | $1,044,352 |
|---|
'17 | $1,086,775 | $1,044,957 |
|---|
'17 | $1,083,836 | $1,043,616 |
|---|
'17 | $1,088,959 | $1,048,406 |
|---|
'18 | $1,086,009 | $1,036,332 |
|---|
'18 | $1,070,893 | $1,026,508 |
|---|
'18 | $1,072,107 | $1,033,091 |
|---|
'18 | $1,064,135 | $1,025,407 |
|---|
'18 | $1,063,312 | $1,032,725 |
|---|
'18 | $1,060,530 | $1,031,455 |
|---|
'18 | $1,064,939 | $1,031,700 |
|---|
'18 | $1,070,370 | $1,038,339 |
|---|
'18 | $1,066,516 | $1,031,653 |
|---|
'18 | $1,053,276 | $1,023,500 |
|---|
'18 | $1,052,560 | $1,029,610 |
|---|
'18 | $1,059,159 | $1,048,525 |
|---|
'19 | $1,084,686 | $1,059,660 |
|---|
'19 | $1,090,280 | $1,059,046 |
|---|
'19 | $1,111,789 | $1,079,382 |
|---|
'19 | $1,117,691 | $1,079,658 |
|---|
'19 | $1,136,380 | $1,098,824 |
|---|
'19 | $1,155,127 | $1,112,623 |
|---|
'19 | $1,158,949 | $1,115,070 |
|---|
'19 | $1,184,321 | $1,143,963 |
|---|
'19 | $1,176,604 | $1,137,870 |
|---|
'19 | $1,176,445 | $1,141,297 |
|---|
'19 | $1,175,725 | $1,140,716 |
|---|
'19 | $1,175,009 | $1,139,921 |
|---|
'20 | $1,199,308 | $1,161,858 |
|---|
'20 | $1,209,478 | $1,182,770 |
|---|
'20 | $1,162,992 | $1,175,810 |
|---|
'20 | $1,199,249 | $1,196,711 |
|---|
'20 | $1,218,077 | $1,202,283 |
|---|
'20 | $1,232,536 | $1,209,856 |
|---|
'20 | $1,260,234 | $1,227,928 |
|---|
'20 | $1,255,998 | $1,218,016 |
|---|
'20 | $1,251,752 | $1,217,348 |
|---|
'20 | $1,248,600 | $1,211,912 |
|---|
'20 | $1,270,949 | $1,223,804 |
|---|
'20 | $1,280,031 | $1,225,490 |
|---|
'21 | $1,270,187 | $1,216,703 |
|---|
'21 | $1,253,703 | $1,199,133 |
|---|
'21 | $1,245,097 | $1,184,160 |
|---|
'21 | $1,258,867 | $1,193,515 |
|---|
'21 | $1,263,689 | $1,197,414 |
|---|
'21 | $1,277,572 | $1,205,827 |
|---|
'21 | $1,290,352 | $1,219,309 |
|---|
'21 | $1,289,612 | $1,216,987 |
|---|
'21 | $1,278,663 | $1,206,450 |
|---|
'21 | $1,276,791 | $1,206,117 |
|---|
'21 | $1,272,624 | $1,209,685 |
|---|
'21 | $1,279,853 | $1,206,590 |
|---|
'22 | $1,243,727 | $1,180,595 |
|---|
'22 | $1,223,521 | $1,167,424 |
|---|
'22 | $1,190,687 | $1,134,991 |
|---|
'22 | $1,145,121 | $1,091,920 |
|---|
'22 | $1,145,513 | $1,098,960 |
|---|
'22 | $1,119,344 | $1,081,719 |
|---|
'22 | $1,148,639 | $1,108,150 |
|---|
'22 | $1,118,981 | $1,076,837 |
|---|
'22 | $1,068,403 | $1,030,311 |
|---|
'22 | $1,052,712 | $1,016,966 |
|---|
'22 | $1,091,993 | $1,054,366 |
|---|
'22 | $1,084,431 | $1,049,610 |
|---|
'23 | $1,127,448 | $1,081,900 |
|---|
'23 | $1,098,830 | $1,053,927 |
|---|
'23 | $1,117,624 | $1,080,699 |
|---|
'23 | $1,123,593 | $1,087,249 |
|---|
'23 | $1,110,537 | $1,075,410 |
|---|
'23 | $1,109,455 | $1,071,574 |
|---|
'23 | $1,111,969 | $1,070,827 |
|---|
'23 | $1,103,841 | $1,063,987 |
|---|
'23 | $1,075,237 | $1,036,949 |
|---|
'23 | $1,056,227 | $1,020,585 |
|---|
'23 | $1,108,831 | $1,066,803 |
|---|
'23 | $1,154,524 | $1,107,639 |
|---|
'24 | $1,155,072 | $1,104,597 |
|---|
'24 | $1,139,607 | $1,088,991 |
|---|
'24 | $1,154,911 | $1,099,047 |
|---|
'24 | $1,124,474 | $1,071,287 |
|---|
'24 | $1,143,724 | $1,089,449 |
|---|
'24 | $1,154,291 | $1,099,763 |
|---|
'24 | $1,177,483 | $1,125,450 |
|---|
'24 | $1,194,482 | $1,141,623 |
|---|
'24 | $1,214,078 | $1,156,909 |
|---|
'24 | $1,185,735 | $1,128,219 |
|---|
'24 | $1,197,986 | $1,140,147 |
|---|
'24 | $1,180,888 | $1,121,488 |
|---|
'25 | $1,188,137 | $1,127,438 |
|---|
'25 | $1,208,622 | $1,152,244 |
|---|
'25 | $1,205,942 | $1,152,678 |
|---|
'25 | $1,207,274 | $1,157,208 |
|---|
'25 | $1,203,534 | $1,148,922 |
|---|
'25 | $1,225,900 | $1,166,588 |
|---|
'25 | $1,224,861 | $1,163,511 |
|---|
'25 | $1,240,873 | $1,177,427 |
|---|
'25 | $1,257,308 | $1,190,271 |
|---|
'25 | $1,264,231 | $1,197,707 |
|---|
'25 | $1,271,184 | $1,205,150 |
|---|
'25 | $1,268,530 | $1,203,367 |
|---|
'26 | $1,271,010 | $1,204,652 |
|---|
|
| Average Annual Return [Table Text Block] |
|
Class/Index
| 1-Year | 5-Year | 10-Year |
|---|
Institutional Class No Sales Charge | 6.98% | 0.01% | 2.43% |
|---|
Bloomberg U.S. Aggregate Bond Index | 6.85% | -0.20% | 1.88% |
|---|
|
| No Deduction of Taxes [Text Block] |
|
The performance graph and returns table do not reflect the deduction of taxes that a shareholder would pay on Fund distributions or the redemption of Fund shares.
|
| Material Change Date |
Feb. 01, 2025
|
|
| AssetsNet |
|
$ 234,238,901
|
| Holdings Count | Holding |
|
340
|
| Advisory Fees Paid, Amount |
|
$ 721,189
|
| InvestmentCompanyPortfolioTurnover |
|
181.00%
|
| Additional Fund Statistics [Text Block] |
|
Net Assets ($) | 234,238,901 |
|---|
Number of Portfolio Holdings | 340 |
|---|
Portfolio Turnover Rate (%) | 181 |
|---|
Total Net Advisory Fees Paid ($) | 721,189 |
|---|
Effective Duration | 6.5 years |
|---|
Effective duration is an approximate measure of the Fund’s sensitivity to interest rate changes taking into consideration any maturity shortening features. |
| Holdings [Text Block] |
|
Asset Type | % of Net Assets |
|---|
Corporate Bonds | 38% |
|---|
Mortgage-Backed Securities Pass-Throughs | 22% |
|---|
Asset-Backed | 13% |
|---|
Commercial Mortgage-Backed Securities | 11% |
|---|
Collateralized Mortgage Obligations | 7% |
|---|
Government & Agency Obligations | 7% |
|---|
Warrants | 0% |
|---|
Cash Equivalents and Other Assets and Liabilities, Net | 2% |
|---|
Total | 100% |
|---|
Credit Rating | % of Net Assets |
|---|
AAA | 10% |
|---|
AA | 41% |
|---|
A | 10% |
|---|
BBB | 32% |
|---|
BB | 4% |
|---|
B | 0% |
|---|
CCC | 1% |
|---|
Not Rated | 2% |
|---|
|
| Credit Ratings Selection [Text Block] |
|
The quality ratings represent the highest of Moody’s Investors Service, Inc. (“Moody’s”), Fitch Ratings, Inc. (“Fitch”) or S&P Global Ratings (“S&P”) credit ratings. The ratings of Moody’s, Fitch and S&P represent their opinions as to the quality of the securities they rate. Credit quality measures a bond issuer’s ability to repay interest and principal in a timely manner. Ratings are relative and subjective and are not absolute standards of quality. Credit quality does not remove market risk and is subject to change.
|
| Material Fund Change [Text Block] |
|
This is a summary of certain changes of the Fund since February 1, 2025. For more information, review the Fund's current prospectus at dws.com/mutualreports, or call (800) 728-3337. Effective May 1, 2025, the Fund’s contractual cap on total annual operating expense for Institutional Class shares changed from 0.50% to 0.55%. The cap excludes certain expenses such as extraordinary expenses, taxes, brokerage, interest expense and acquired fund fees and expenses. |
| Material Fund Change Expenses [Text Block] |
|
Effective May 1, 2025, the Fund’s contractual cap on total annual operating expense for Institutional Class shares changed from 0.50% to 0.55%. The cap excludes certain expenses such as extraordinary expenses, taxes, brokerage, interest expense and acquired fund fees and expenses.
|
| Summary of Change Legend [Text Block] |
|
This is a summary of certain changes of the Fund since February 1, 2025. For more information, review the Fund's current prospectus at dws.com/mutualreports, or call (800) 728-3337.
|