Pay vs Performance Disclosure - USD ($)
|
12 Months Ended |
Dec. 31, 2025 |
Dec. 31, 2024 |
Dec. 31, 2023 |
Dec. 31, 2022 |
Dec. 31, 2021 |
| Pay vs Performance Disclosure |
|
|
|
|
|
| Pay vs Performance Disclosure, Table |
| | | | | | | | | | | | | | | | | | | | | | | | | | | | | | | | | | | | | | | | | | | | | | | Summary Compensation Table Total for PEO(1) | | Compensation Actually Paid to PEO(2) | | Average Summary Compensation Table Total for Non-PEO NEOs(3) | | Average Compensation Actually Paid to Non-PEO NEOs(4) | | Total Shareholder Return(5) | | Peer Group Total Shareholder Return(6) | | Net Income (Loss) | | Year | | ($) | | ($) | | ($) | | ($) | | ($) | | ($) | | ($ in thousands) | | 2025 | | 263,340 | | | 207,913 | | | 316,048 | | | 310,304 | | | 74.96 | | | 63.04 | | | (902) | | | 2024 | | 287,550 | | | (123,868) | | | 435,626 | | | 274,403 | | | 81.40 | | | 62.64 | | | (34,993) | | | 2023 | | 637,200 | | | 795,446 | | | 507,232 | | | 575,017 | | | 123.60 | | | 70.82 | | | (38,867) | | | 2022 | | 686,080 | | | 425,295 | | | 527,606 | | | 429,903 | | | 107.05 | | | 69.67 | | | 29,785 | | | 2021 | | 760,200 | | | 996,739 | | | 521,349 | | | 661,164 | | | 134.29 | | | 107.46 | | | 60,460 | | | | | | | | | | | | | | | | |
|
|
|
|
|
| Named Executive Officers, Footnote |
The dollar amounts reported in this column are the amounts of total compensation reported for our Chief Executive Officer (the “PEO”) for each corresponding year, as reported in the “Total” column of the Summary Compensation Table. The name of the PEO of the Company reflected in these columns for each of the applicable fiscal years is Bryan P. Donohoe. The dollar amounts reported in this column represent the average of the total amounts reported for our non-PEO named executive officers (the “Other NEOs”) for each corresponding year in the “Total” column of the Summary Compensation Table. For 2021 to 2023, our Other NEOs were Tae-Sik Yoon and Anton S. Feingold, and for 2024 and 2025, our Other NEOs were Tae-Sik Yoon, Jeffrey M. Gonzales and Anton S. Feingold.
|
|
|
|
|
| Peer Group Issuers, Footnote |
Total shareholder return for our peer group is the FTSE NAREIT All Mortgage Capped Index, which we also use for purposes of the stock performance graph required by Item 201(e) of Regulation S-K included in our Annual Report on Form 10-K for the year ended December 31, 2025.
|
|
|
|
|
| PEO Total Compensation Amount |
$ 263,340
|
$ 287,550
|
$ 637,200
|
$ 686,080
|
$ 760,200
|
| PEO Actually Paid Compensation Amount |
$ 207,913
|
(123,868)
|
795,446
|
425,295
|
996,739
|
| Adjustment To PEO Compensation, Footnote |
“Compensation Actually Paid” has been calculated in accordance with the requirements of Item 402(v)(2)(iii) of Regulation S-K and does not reflect compensation actually earned, realized or received. The following adjustments in the table below were made to the amounts reported for Mr. Donohoe in the Summary Compensation Table. In calculating “Compensation Actually Paid”, the fair value or change in fair value, as applicable, of the equity award adjustments included in each calculation was computed in accordance with FASB ASC Topic 718. Importantly, the dollar amounts do not reflect the actual amount of compensation earned by or paid to Mr. Donohoe during the applicable year. | | | | | | | | | | | | | | | | | | | | | | | | | | | | | | | | | | | | | | | 2021 | | 2022 | | 2023 | | 2024 | | 2025 | | Description | | ($) | | ($) | | ($) | | ($) | | ($) | | Reported Summary Compensation Total for PEO | | 760,200 | | | 686,080 | | | 637,200 | | | 287,550 | | | 263,340 | | | Change in Pension Value Deduction for PEO(a) | | — | | — | | — | | — | | — | | Pension Service Cost Addition for PEO(a) | | — | | — | | — | | — | | — | | Prior Pension Service Cost Addition for PEO(a) | | — | | — | | — | | — | | — | | Reported Stock Awards Deduction for PEO(b) | | (760,200) | | | (686,080) | | | (637,200) | | | (287,550) | | | (263,340) | | | Equity Award Adjustments for PEO(c) | | 996,739 | | | 425,295 | | | 795,446 | | | (123,868) | | | 207,913 | | | Compensation Actually Paid to PEO | | 996,739 | | | 425,295 | | | 795,446 | | | (123,868) | | | 207,913 | |
____________________________________
(a) The Company has no pension plans. (b) Total grant date fair value of equity awards reported in the “Stock Awards” column in the Summary Compensation Table for the applicable year. Mr. Donohoe did not receive option awards in the years shown. (c) For each covered year, the amounts added or deducted in calculated equity award adjustments include:
|
|
|
|
|
| Non-PEO NEO Average Total Compensation Amount |
$ 316,048
|
435,626
|
507,232
|
527,606
|
521,349
|
| Non-PEO NEO Average Compensation Actually Paid Amount |
$ 310,304
|
274,403
|
575,017
|
429,903
|
661,164
|
| Adjustment to Non-PEO NEO Compensation Footnote |
“Compensation Actually Paid” has been calculated in accordance with the requirements of Item 402(v)(2)(iii) of Regulation S-K and does not reflect compensation actually earned, realized or received. When calculating the “average compensation actually paid for the Other NEOs, the following adjustments in the table below were made to the amounts reported in the Summary Compensation Table. In calculating “Compensation Actually Paid”, the fair value or change in fair value, as applicable, of the equity award adjustments included in such calculations was computed in accordance with FASB ASC Topic 718. Importantly, the dollar amounts do not reflect the actual amount of compensation earned by or paid to our Other NEOs as a group during the applicable year. | | | | | | | | | | | | | | | | | | | | | | | | | | | | | | | | | | | | | | | 2021 | | 2022 | | 2023 | | 2024 | | 2025 | | Description | | ($) | | ($) | | ($) | | ($) | | ($) | | Average Reported Summary Compensation Total for Other NEOs | | 521,349 | | | 527,606 | | | 507,232 | | | 435,626 | | | 316,048 | | | Average Change in Pension Value Deduction for Other NEOs(a) | | — | | — | | — | | — | | — | | Average Pension Service Cost Addition for Other NEOs(a) | | — | | — | | — | | — | | — | | Average Prior Pension Service Cost Addition for Other NEOs(a) | | — | | — | | — | | — | | — | | Average Reported Stock Awards Deduction for Other NEOs(b) | | (314,940) | | | (318,920) | | | (329,400) | | | (158,685) | | | (183,363) | | | Average Equity Award Adjustments for Other NEOs(c) | | 454,755 | | | 221,217 | | | 397,185 | | | (2,538) | | | 177,619 | | | Average Compensation Actually Paid to Other NEOs | | 661,164 | | | 429,903 | | | 575,017 | | | 274,403 | | | 310,304 | |
____________________________________
(a) The Company has no pension plans. (b) Average total grant date fair value of equity awards reported in the “Stock Awards” column in the Summary Compensation Table for the applicable year. The Other NEOs did not receive option awards in the years shown. (c) For each covered year, the amounts added or deducted in calculated equity award adjustments include: | | | | | | | | | | | | | | | | | | | | | | | | | | | | | | | | | | | | | | | | | | | | | | | Year End Fair Value of Outstanding and Unvested Equity Awards Granted in the Covered Year for Other NEOs | | Year over Year Change in Fair Value of Outstanding and Unvested Equity Awards for Other NEOs | | Fair Value as of Vesting Date of Equity Awards Granted and Vested in the Year for Other NEOs | | Year over Year Change in Fair Value of Equity Awards Granted in Prior Years that Vested in the Year for Other NEOs | | Fair Value at the End of the Prior Year of Equity Awards that Failed to Meet Vesting Conditions in the Year for Other NEOs | | Value of Dividends or other Earnings Paid on Stock or Option Awards not Otherwise Reflected in Fair Value or Total Compensation for Other NEOs | | Total Equity Award Adjustments for Other NEOs | | Year | | ($) | | ($) | | ($) | | ($) | | ($) | | ($) | | ($) | | 2025 | | 164,751 | | | (26,701) | | | — | | | — | | | — | | | 39,569 | | | 177,619 | | | 2024 | | 146,268 | | | (203,134) | | | — | | | (517) | | | — | | | 54,845 | | | (2,538) | | | 2023 | | 315,980 | | | 3,511 | | | — | | | 3,397 | | | — | | | 74,297 | | | 397,185 | | | 2022 | | 306,128 | | | (148,299) | | | — | | | 8,122 | | | — | | | 55,266 | | | 221,217 | | | 2021 | | 316,245 | | | 68,172 | | | — | | | 25,568 | | | — | | | 44,770 | | | 454,755 | |
|
|
|
|
|
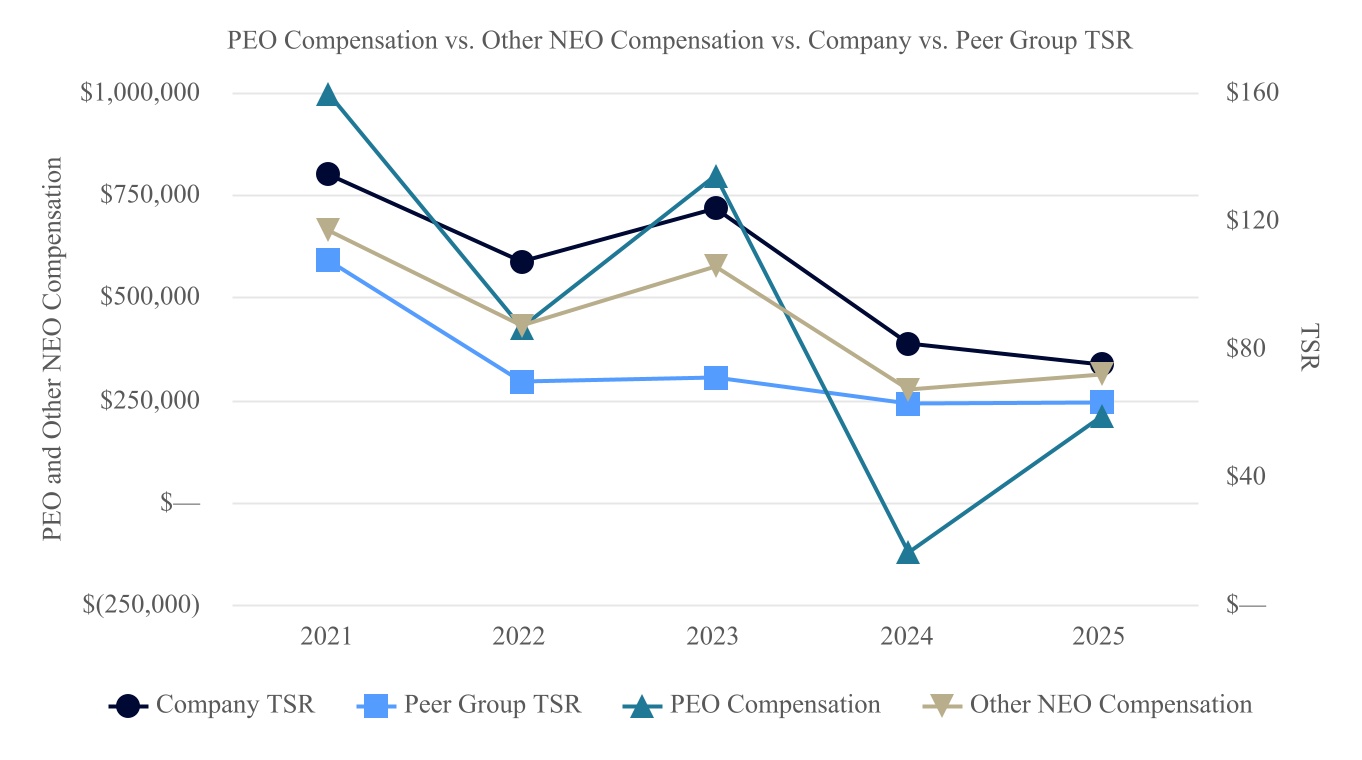
| Compensation Actually Paid vs. Total Shareholder Return |
|
|
|
|
|
| Total Shareholder Return Vs Peer Group |
|
|
|
|
|
| Total Shareholder Return Amount |
$ 74.96
|
81.40
|
123.60
|
107.05
|
134.29
|
| Peer Group Total Shareholder Return Amount |
63.04
|
62.64
|
70.82
|
69.67
|
107.46
|
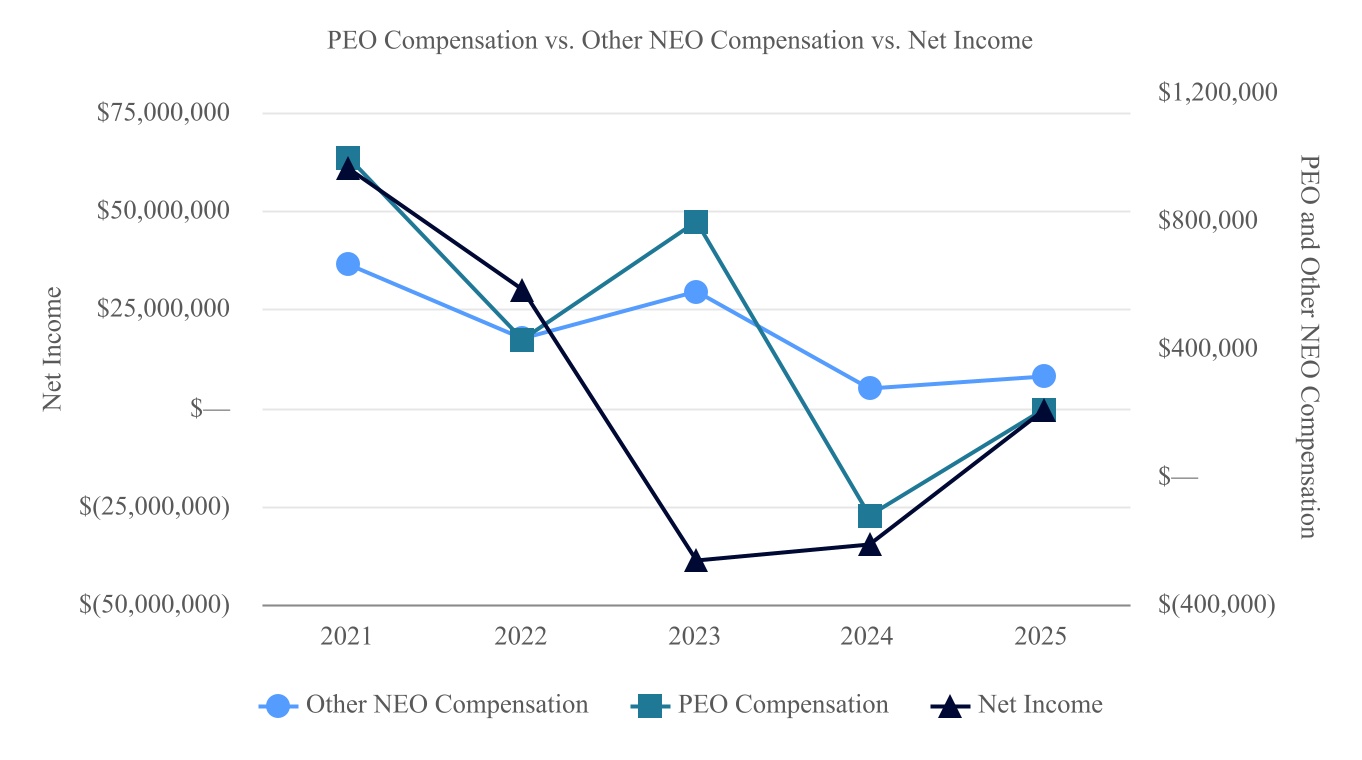
| Net Income (Loss) |
$ (902)
|
(34,993)
|
(38,867)
|
29,785
|
60,460
|
| Additional 402(v) Disclosure |
The total shareholder return as calculated based on a fixed investment of one hundred ($100) dollars measured from the market close on December 31, 2020 (the last trading day of 2020) through and including the end of the fiscal year for each year reported in the table.
|
|
|
|
|
| Measure:: 1 |
|
|
|
|
|
| Pay vs Performance Disclosure |
|
|
|
|
|
| Compensation Actually Paid vs. Other Measure |
|
|
|
|
|
| PEO | Aggregate Change in Present Value of Accumulated Benefit for All Pension Plans Reported in Summary Compensation Table |
|
|
|
|
|
| Pay vs Performance Disclosure |
|
|
|
|
|
| Adjustment to Compensation, Amount |
$ 0
|
0
|
0
|
0
|
0
|
| PEO | Pension Adjustments Service Cost |
|
|
|
|
|
| Pay vs Performance Disclosure |
|
|
|
|
|
| Adjustment to Compensation, Amount |
0
|
0
|
0
|
0
|
0
|
| PEO | Pension Adjustments Prior Service Cost |
|
|
|
|
|
| Pay vs Performance Disclosure |
|
|
|
|
|
| Adjustment to Compensation, Amount |
0
|
0
|
0
|
0
|
0
|
| PEO | Equity Awards Adjustments, Excluding Value Reported in Compensation Table |
|
|
|
|
|
| Pay vs Performance Disclosure |
|
|
|
|
|
| Adjustment to Compensation, Amount |
207,913
|
(123,868)
|
795,446
|
425,295
|
996,739
|
| PEO | Year-end Fair Value of Equity Awards Granted in Covered Year that are Outstanding and Unvested |
|
|
|
|
|
| Pay vs Performance Disclosure |
|
|
|
|
|
| Adjustment to Compensation, Amount |
236,610
|
265,050
|
611,240
|
658,560
|
763,350
|
| PEO | Year-over-Year Change in Fair Value of Equity Awards Granted in Prior Years That are Outstanding and Unvested |
|
|
|
|
|
| Pay vs Performance Disclosure |
|
|
|
|
|
| Adjustment to Compensation, Amount |
(117,288)
|
(532,672)
|
7,677
|
(367,268)
|
150,347
|
| PEO | Vesting Date Fair Value of Equity Awards Granted and Vested in Covered Year |
|
|
|
|
|
| Pay vs Performance Disclosure |
|
|
|
|
|
| Adjustment to Compensation, Amount |
0
|
0
|
0
|
0
|
0
|
| PEO | Change in Fair Value as of Vesting Date of Prior Year Equity Awards Vested in Covered Year |
|
|
|
|
|
| Pay vs Performance Disclosure |
|
|
|
|
|
| Adjustment to Compensation, Amount |
0
|
(1,280)
|
10,927
|
4,883
|
0
|
| PEO | Prior Year End Fair Value of Equity Awards Granted in Any Prior Year that Fail to Meet Applicable Vesting Conditions During Covered Year |
|
|
|
|
|
| Pay vs Performance Disclosure |
|
|
|
|
|
| Adjustment to Compensation, Amount |
0
|
0
|
0
|
0
|
0
|
| PEO | Dividends or Other Earnings Paid on Equity Awards not Otherwise Reflected in Total Compensation for Covered Year |
|
|
|
|
|
| Pay vs Performance Disclosure |
|
|
|
|
|
| Adjustment to Compensation, Amount |
88,591
|
145,034
|
165,602
|
129,120
|
83,042
|
| PEO | Reported Stock Awards Deduction [Member] |
|
|
|
|
|
| Pay vs Performance Disclosure |
|
|
|
|
|
| Adjustment to Compensation, Amount |
(263,340)
|
(287,550)
|
(637,200)
|
(686,080)
|
(760,200)
|
| Non-PEO NEO | Aggregate Change in Present Value of Accumulated Benefit for All Pension Plans Reported in Summary Compensation Table |
|
|
|
|
|
| Pay vs Performance Disclosure |
|
|
|
|
|
| Adjustment to Compensation, Amount |
0
|
0
|
0
|
0
|
0
|
| Non-PEO NEO | Pension Adjustments Service Cost |
|
|
|
|
|
| Pay vs Performance Disclosure |
|
|
|
|
|
| Adjustment to Compensation, Amount |
0
|
0
|
0
|
0
|
0
|
| Non-PEO NEO | Pension Adjustments Prior Service Cost |
|
|
|
|
|
| Pay vs Performance Disclosure |
|
|
|
|
|
| Adjustment to Compensation, Amount |
0
|
0
|
0
|
0
|
0
|
| Non-PEO NEO | Equity Awards Adjustments, Excluding Value Reported in Compensation Table |
|
|
|
|
|
| Pay vs Performance Disclosure |
|
|
|
|
|
| Adjustment to Compensation, Amount |
177,619
|
(2,538)
|
397,185
|
221,217
|
454,755
|
| Non-PEO NEO | Year-end Fair Value of Equity Awards Granted in Covered Year that are Outstanding and Unvested |
|
|
|
|
|
| Pay vs Performance Disclosure |
|
|
|
|
|
| Adjustment to Compensation, Amount |
164,751
|
146,268
|
315,980
|
306,128
|
316,245
|
| Non-PEO NEO | Year-over-Year Change in Fair Value of Equity Awards Granted in Prior Years That are Outstanding and Unvested |
|
|
|
|
|
| Pay vs Performance Disclosure |
|
|
|
|
|
| Adjustment to Compensation, Amount |
(26,701)
|
(203,134)
|
3,511
|
(148,299)
|
68,172
|
| Non-PEO NEO | Vesting Date Fair Value of Equity Awards Granted and Vested in Covered Year |
|
|
|
|
|
| Pay vs Performance Disclosure |
|
|
|
|
|
| Adjustment to Compensation, Amount |
0
|
0
|
0
|
0
|
0
|
| Non-PEO NEO | Change in Fair Value as of Vesting Date of Prior Year Equity Awards Vested in Covered Year |
|
|
|
|
|
| Pay vs Performance Disclosure |
|
|
|
|
|
| Adjustment to Compensation, Amount |
0
|
(517)
|
3,397
|
8,122
|
25,568
|
| Non-PEO NEO | Prior Year End Fair Value of Equity Awards Granted in Any Prior Year that Fail to Meet Applicable Vesting Conditions During Covered Year |
|
|
|
|
|
| Pay vs Performance Disclosure |
|
|
|
|
|
| Adjustment to Compensation, Amount |
0
|
0
|
0
|
0
|
0
|
| Non-PEO NEO | Dividends or Other Earnings Paid on Equity Awards not Otherwise Reflected in Total Compensation for Covered Year |
|
|
|
|
|
| Pay vs Performance Disclosure |
|
|
|
|
|
| Adjustment to Compensation, Amount |
39,569
|
54,845
|
74,297
|
55,266
|
44,770
|
| Non-PEO NEO | Reported Stock Awards Deduction [Member] |
|
|
|
|
|
| Pay vs Performance Disclosure |
|
|
|
|
|
| Adjustment to Compensation, Amount |
$ (183,363)
|
$ (158,685)
|
$ (329,400)
|
$ (318,920)
|
$ (314,940)
|