Pay Versus Performance
The following Pay Versus Performance table (“PVP Table”) provides SEC-required information about compensation for 2025 for this Proxy Statement’s NEOs, as well as our NEOs from our 2024, 2023, 2022 and 2021 Proxy Statements (each of 2021, 2022, 2023, 2024 and 2025, a “Covered Year”). The PVP Table also provides information about the results for certain measures of financial performance during those same Covered Years. In reviewing this information, there are a few important things we believe you should consider:
Due to the use and weighting of the Core Earnings performance measure in our STIP for 2025, we have determined that, pursuant to the SEC’s PVP rules, Core Earnings should be designated as the “Company-Selected Measure” for the years 2021 through 2025 and to be included in the far right column of the PVP Table below. We believe it is the most important financial measure that demonstrates how we sought to link executive pay to performance for 2025.
Pay Versus Performance Table (1) |
||||||||||||
|
SCT Total |
SCT Total |
SCT Total |
Compen- |
Compen- |
Compen- |
Average |
Average |
Value of Initial |
Net |
Core |
|
Year |
Strah |
Somerhalder |
Tierney |
Strah |
Somerhalder |
Tierney |
Officers |
Officers |
FE TSR |
EEI TSR |
(GAAP) |
Earnings |
(a) |
(b) |
(b) |
(b) |
(c)(2) |
(c)(2) |
(c)(2) |
(d) |
(e)(2) |
(f)(3) |
(g)(4) |
(h) |
(i)(5)(6) |
2025 |
n/a |
n/a |
$13,448,255 |
n/a |
n/a |
$17,913,372 |
$3,368,414 |
$4,292,665 |
$179.80 |
$143.83 |
$1,271 |
$1,471 |
2024 |
n/a |
n/a |
$11,933,534 |
n/a |
n/a |
$10,727,173 |
$2,931,354 |
$2,404,744 |
$153.27 |
$128.82 |
$1,127 |
$1,365 |
2023 |
n/a |
$4,497,007 |
$26,452,616 |
n/a |
$4,847,129 |
$30,948,304 |
$4,478,599 |
$3,468,502 |
$135.42 |
$108.16 |
$1,176 |
$1,263 |
2022 |
$9,268,371 |
$3,663,808 |
n/a |
$4,461,489 |
$3,931,015 |
n/a |
$3,195,262 |
$3,846,919 |
$148.45 |
$118.47 |
$439 |
$1,020 |
2021 |
$10,714,062 |
n/a |
n/a |
$11,432,150 |
n/a |
n/a |
$4,368,522 |
$5,296,905 |
$141.67 |
$117.12 |
$1,283 |
$1,145 |
(1) The tables below summarize our principal executive officer(s) (“PEOs”) and non-PEOs for 2021 to 2025 (although Mr. Somerhalder was a non-PEO named executive officer in 2021 and was included in the Summary Compensation Table for that year, his individual Summary Compensation Table Total amount is not included in the table above for 2021 because he was not our PEO for that year):
PEO 2021-2025 |
||
Name |
Position Start Date |
Position End Date |
Brian X. Tierney |
June 1, 2023 |
Current |
John W. Somerhalder II |
September 16, 2022 |
May 31, 2023 |
Steven E. Strah |
October 29, 2020 |
September 16, 2022 |
Non-PEO Named Executive Officers 2021-2025 |
|||||
Name |
2021 |
2022 |
2023 |
2024 |
2025 |
A. Wade Smith |
|
|
|
|
|
Toby L. Thomas |
|
|
|
|
|
John W. Somerhalder II |
|
|
|
|
|
K. Jon Taylor |
|
|
|
|
|
Samuel L. Belcher |
|
|
|
|
|
Hyun Park |
|
|
|
|
|
Christine L. Walker |
|
|
|
|
|
Robert P. Reffner |
|
|
|
|
|
(2) For each Covered Year, in determining both the CAP to our PEOs and the average CAP to our non-PEO named executive officers for purposes of this PVP Table, we deducted from or added back to the total amounts of compensation reported in column (b) for such Covered Year the following amounts:
Item and Value Added (Deducted) |
|
2025 |
2024 |
2023 |
2022 |
2021 |
SCT Total for Mr. Strah |
|
N/A |
N/A |
N/A |
$9,268,371 |
$10,714,062 |
- change in actuarial present value of pension benefits |
|
|
|
|
($691,253) |
($1,869,542) |
+ service cost of pension benefits |
|
|
|
|
$348,485 |
$255,941 |
+ prior service cost of pension benefits |
|
|
|
|
N/A |
N/A |
- SCT Stock Awards column value |
|
|
|
|
($6,601,055) |
($5,755,252) |
- SCT Option Awards column value |
|
|
|
|
N/A |
N/A |
+ year-end fair value of outstanding equity awards granted in covered year |
|
|
|
|
$1,158,750 |
$6,567,574 |
+/- change in fair value of outstanding equity awards granted in prior years |
|
|
|
|
$511,316 |
$940,309 |
+ vesting date fair value of equity awards granted and vested in covered year |
|
|
|
|
N/A |
N/A |
+/- change in fair value of prior-year equity awards vested in covered year |
|
|
|
|
$466,876 |
$579,058 |
- prior year-end fair value of prior year equity awards forfeited in covered year |
|
|
|
|
N/A |
N/A |
+ includable dividends/earnings on equity awards during covered year |
|
|
|
|
N/A |
N/A |
Compensation Actually Paid for Mr. Strah |
|
N/A |
N/A |
|
$4,461,489 |
$11,432,150 |
Item and Value Added (Deducted) |
|
2025 |
2024 |
2023 |
|
2022 |
|
2021 |
||
SCT Total for Mr. Somerhalder |
|
N/A |
N/A |
$ |
4,497,007 |
|
$ |
3,663,808 |
|
N/A |
- change in actuarial present value of pension benefits |
|
|
|
N/A |
|
$ |
(115,970 |
) |
|
|
+ service cost of pension benefits |
|
|
|
$ |
201,653 |
|
$ |
98,356 |
|
|
+ prior service cost of pension benefits |
|
|
|
N/A |
|
N/A |
|
|
||
- SCT Stock Awards column value |
|
|
|
$ |
(3,166,015 |
) |
$ |
(2,188,623 |
) |
|
- SCT Option Awards column value |
|
|
|
N/A |
|
N/A |
|
|
||
+ year-end fair value of outstanding equity awards granted in covered year |
|
|
|
N/A |
|
$ |
2,442,000 |
|
|
|
+/- change in fair value of outstanding equity awards granted in prior years |
|
|
|
$ |
290,015 |
|
$ |
(59,917 |
) |
|
+ vesting date fair value of equity awards granted and vested in covered year |
|
|
|
$ |
3,008,323 |
|
N/A |
|
|
|
+/- change in fair value of prior-year equity awards vested in covered year |
|
|
|
$ |
16,145 |
|
$ |
18,941 |
|
|
- prior year-end fair value of prior year equity awards forfeited in covered year |
|
|
|
N/A |
|
N/A |
|
|
||
+ includable dividends/earnings on equity awards during covered year |
|
|
|
N/A |
|
$ |
72,421 |
|
|
|
Compensation Actually Paid for Mr. Somerhalder |
|
N/A |
N/A |
$ |
4,847,129 |
|
$ |
3,931,015 |
|
N/A |
Item and Value Added (Deducted) |
|
2025 |
|
2024 |
|
2023 |
|
2022 |
2021 |
|||
SCT Total for Mr. Tierney |
|
$ |
13,448,255 |
|
$ |
11,933,534 |
|
$ |
26,452,616 |
|
N/A |
N/A |
- change in actuarial present value of pension benefits |
|
$ |
(115,314 |
) |
$ |
(186,854 |
) |
$ |
(49,154 |
) |
|
|
+ service cost of pension benefits |
|
$ |
234,532 |
|
$ |
95,024 |
|
N/A |
|
|
|
|
+ prior service cost of pension benefits |
|
N/A |
|
N/A |
|
N/A |
|
|
|
|||
- SCT Stock Awards column value |
|
$ |
(9,406,196 |
) |
$ |
(10,197,274 |
) |
$ |
(22,267,685 |
) |
|
|
- SCT Option Awards column value |
|
N/A |
|
N/A |
|
N/A |
|
|
|
|||
+ year-end fair value of outstanding equity awards granted in covered year |
|
$ |
11,647,071 |
|
$ |
10,525,290 |
|
$ |
26,812,527 |
|
|
|
+/- change in fair value of outstanding equity awards granted in prior years |
|
$ |
2,437,937 |
|
$ |
(188,226 |
) |
N/A |
|
|
|
|
+ vesting date fair value of equity awards granted and vested in covered year |
|
N/A |
|
N/A |
|
N/A |
|
|
|
|||
+/- change in fair value of prior-year equity awards vested in covered year |
|
$ |
(332,913 |
) |
$ |
(1,254,321 |
) |
N/A |
|
|
|
|
- prior year-end fair value of prior year equity awards forfeited in covered year |
|
N/A |
|
N/A |
|
N/A |
|
|
|
|||
+ includable dividends/earnings on equity awards during covered year |
|
N/A |
|
N/A |
|
N/A |
|
|
|
|||
Compensation Actually Paid for Mr. Tierney |
|
$ |
17,913,372 |
|
$ |
10,727,173 |
|
$ |
30,948,304 |
|
N/A |
N/A |
Item and Value Added (Deducted) |
|
2025 |
|
2024 |
|
2023 |
|
2022 |
|
2021 |
|
|||||
Average SCT Total for Non-PEO Named Executive Officers |
|
$ |
3,368,414 |
|
$ |
2,931,354 |
|
$ |
4,478,599 |
|
$ |
3,195,262 |
|
$ |
4,368,522 |
|
- change in actuarial present value of pension benefits |
|
$ |
(137,757 |
) |
$ |
(135,798 |
) |
$ |
(209,411 |
) |
$ |
(24,686 |
) |
$ |
(136,884 |
) |
+ service cost of pension benefits |
|
$ |
103,069 |
|
$ |
96,470 |
|
$ |
95,864 |
|
$ |
146,164 |
|
$ |
75,895 |
|
+ prior service cost of pension benefits |
|
N/A |
|
N/A |
|
N/A |
|
N/A |
|
N/A |
|
|||||
- SCT Stock Awards column value |
|
$ |
(1,795,719 |
) |
$ |
(1,681,249 |
) |
$ |
(3,119,704 |
) |
$ |
(1,515,633 |
) |
$ |
(2,293,441 |
) |
- SCT Option Awards column value |
|
N/A |
|
N/A |
|
N/A |
|
N/A |
|
N/A |
|
|||||
+ year-end fair value of outstanding equity awards granted in covered year |
|
$ |
2,223,447 |
|
$ |
1,599,222 |
|
$ |
2,753,339 |
|
$ |
1,601,589 |
|
$ |
2,791,195 |
|
+/- change in fair value of outstanding equity awards granted in prior years |
|
$ |
568,448 |
|
$ |
50,274 |
|
$ |
(534,263 |
) |
$ |
244,735 |
|
$ |
334,706 |
|
+ vesting date fair value of equity awards granted and vested in covered year |
|
N/A |
|
N/A |
|
N/A |
|
N/A |
|
N/A |
|
|||||
+/- change in fair value of prior-year equity awards vested in covered year |
|
$ |
(37,236 |
) |
$ |
(455,530 |
) |
$ |
120,922 |
|
$ |
199,488 |
|
$ |
156,913 |
|
- prior year-end fair value of prior year equity awards forfeited in covered year |
|
$ |
0 |
|
$ |
0 |
|
$ |
(116,843 |
) |
$ |
0 |
|
$ |
0 |
|
+ includable dividends/earnings on equity awards during covered year |
|
N/A |
|
N/A |
|
N/A |
|
N/A |
|
N/A |
|
|||||
Compensation Actually Paid for non-PEO Named Executive Officers |
|
$ |
4,292,665 |
|
$ |
2,404,744 |
|
$ |
3,468,502 |
|
$ |
3,846,919 |
|
$ |
5,296,905 |
|
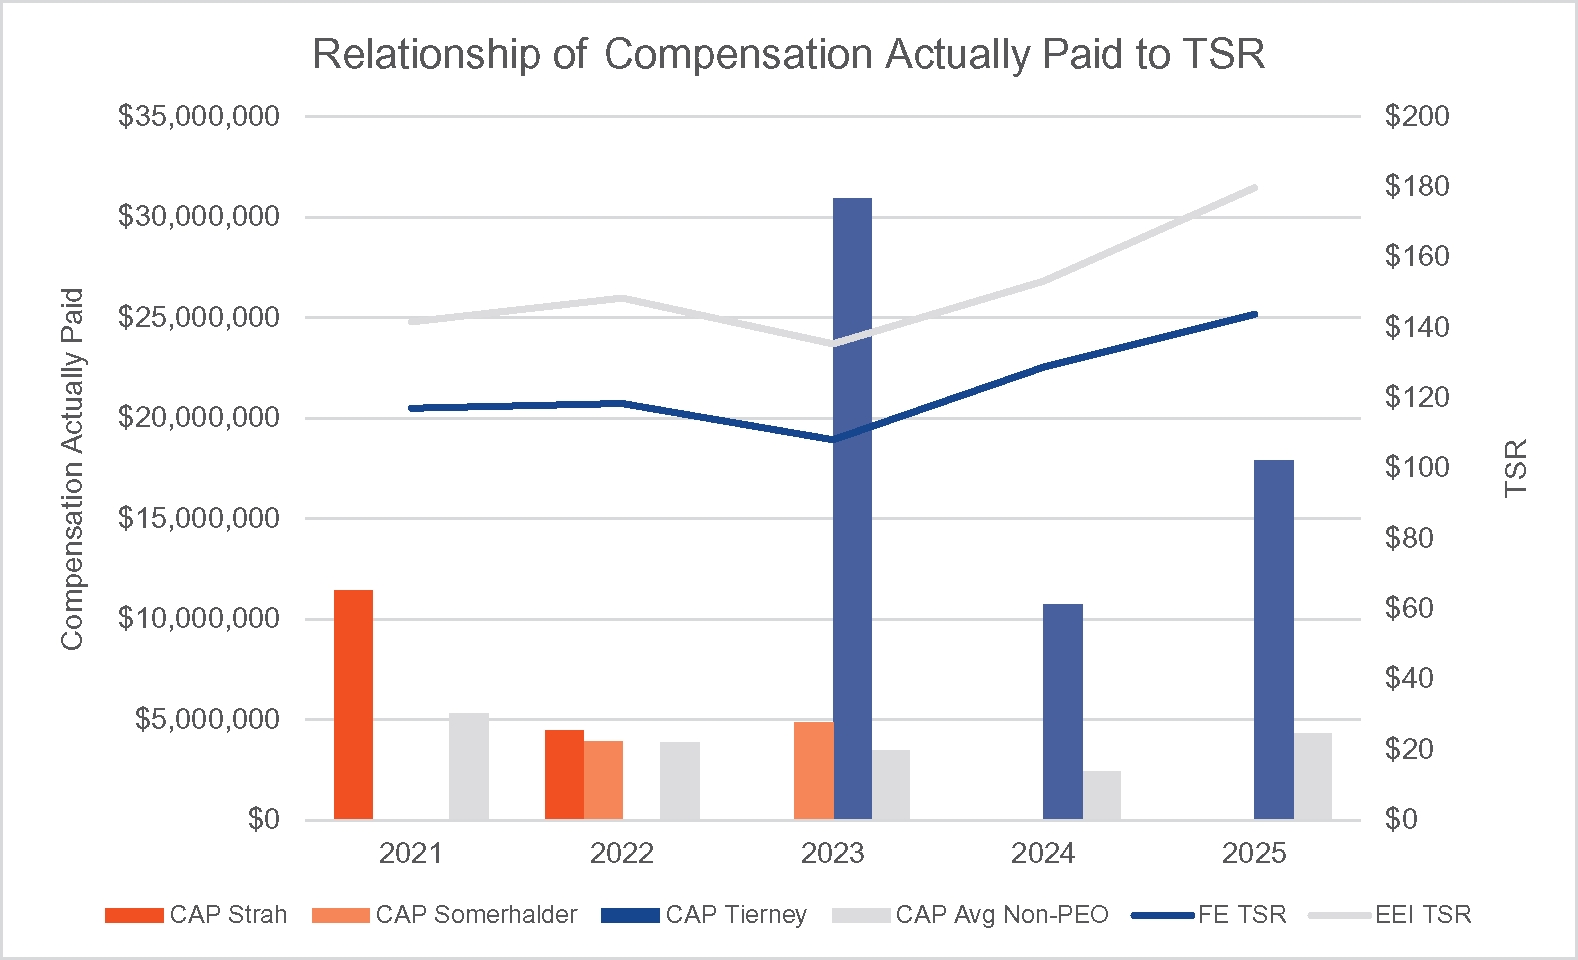
(3) For each Covered Year, our absolute total shareholder return was calculated as the yearly percentage change in our cumulative total shareholder return on our common stock, measured as the quotient of (a) the sum of (i) the cumulative amount of dividends for a period beginning with our closing price on NYSE on December 31, 2020 ($30.61 per share) through and including the last day of the Covered Year (each one-year, two-year, three-year, four-year and five-year periods, a “Measurement Period”), assuming dividend reinvestment, plus (ii) the difference between our closing stock price at the end versus the beginning of the Measurement Period ($44.77 per share for December 31, 2025, $39.78 per share for December 31, 2024, $36.66 per share for December 31, 2023, $41.94 per share for December 31, 2022, and $41.59 per share for December 31, 2021, divided by (b) our closing share price at the beginning of the Measurement Period ($30.61 per share). Each of
these yearly percentage changes was then applied to a deemed fixed investment of $100 at the beginning of the Measurement Period to produce the Covered Year-end values of such investment as of the end of 2025, 2024, 2023, 2022 and 2021, as applicable. Because Covered Years are presented in the table in reverse chronological order (from top to bottom), the table should be read from bottom to top for purposes of understanding cumulative returns over time.
(4) For purposes of this pay versus performance disclosure, our peer group is EEI’s Index of Investor-Owned Electric Utility Companies (the “Peer Group”). For each Covered Year, our peer group cumulative total shareholder return was calculated based on a deemed fixed investment of $100 through the Measurement Period, assuming dividend reinvestment for the entities in the Peer Group (on a weighted basis depending on the respective entity’s stock market capitalization at the beginning of the Measurement Period).
(5) For the years 2021-2024, for illustration purposes, Operating Earnings were converted to Core Earnings because Core Earnings was not the Company selected measure until 2025. The conversion is consistent with how Core Earnings is defined below in the following footnote.
(6) For 2025, Core Earnings is disclosed in millions and is calculated using the aggregate GAAP earnings adjusted to exclude Net Pension/OPEB credits and Signal Peak earnings impact, and other special items that are consistent with the Company’s non-GAAP external reporting. Results for 2025 included the following adjustments: in addition to the special items that adjust GAAP earnings to Core Earnings as reported externally, the impacts of unforeseen accounting and legislative or regulatory changes as instituted by authoritative organizations were included as adjustments. Other strategic decisions may also apply if they are presented to and approved by the Board.
(1) The tables below summarize our principal executive officer(s) (“PEOs”) and non-PEOs for 2021 to 2025 (although Mr. Somerhalder was a non-PEO named executive officer in 2021 and was included in the Summary Compensation Table for that year, his individual Summary Compensation Table Total amount is not included in the table above for 2021 because he was not our PEO for that year):
PEO 2021-2025 |
||
Name |
Position Start Date |
Position End Date |
Brian X. Tierney |
June 1, 2023 |
Current |
John W. Somerhalder II |
September 16, 2022 |
May 31, 2023 |
Steven E. Strah |
October 29, 2020 |
September 16, 2022 |
Non-PEO Named Executive Officers 2021-2025 |
|||||
Name |
2021 |
2022 |
2023 |
2024 |
2025 |
A. Wade Smith |
|
|
|
|
|
Toby L. Thomas |
|
|
|
|
|
John W. Somerhalder II |
|
|
|
|
|
K. Jon Taylor |
|
|
|
|
|
Samuel L. Belcher |
|
|
|
|
|
Hyun Park |
|
|
|
|
|
Christine L. Walker |
|
|
|
|
|
Robert P. Reffner |
|
|
|
|
|
(2) For each Covered Year, in determining both the CAP to our PEOs and the average CAP to our non-PEO named executive officers for purposes of this PVP Table, we deducted from or added back to the total amounts of compensation reported in column (b) for such Covered Year the following amounts:
Item and Value Added (Deducted) |
|
2025 |
2024 |
2023 |
2022 |
2021 |
SCT Total for Mr. Strah |
|
N/A |
N/A |
N/A |
$9,268,371 |
$10,714,062 |
- change in actuarial present value of pension benefits |
|
|
|
|
($691,253) |
($1,869,542) |
+ service cost of pension benefits |
|
|
|
|
$348,485 |
$255,941 |
+ prior service cost of pension benefits |
|
|
|
|
N/A |
N/A |
- SCT Stock Awards column value |
|
|
|
|
($6,601,055) |
($5,755,252) |
- SCT Option Awards column value |
|
|
|
|
N/A |
N/A |
+ year-end fair value of outstanding equity awards granted in covered year |
|
|
|
|
$1,158,750 |
$6,567,574 |
+/- change in fair value of outstanding equity awards granted in prior years |
|
|
|
|
$511,316 |
$940,309 |
+ vesting date fair value of equity awards granted and vested in covered year |
|
|
|
|
N/A |
N/A |
+/- change in fair value of prior-year equity awards vested in covered year |
|
|
|
|
$466,876 |
$579,058 |
- prior year-end fair value of prior year equity awards forfeited in covered year |
|
|
|
|
N/A |
N/A |
+ includable dividends/earnings on equity awards during covered year |
|
|
|
|
N/A |
N/A |
Compensation Actually Paid for Mr. Strah |
|
N/A |
N/A |
|
$4,461,489 |
$11,432,150 |
Item and Value Added (Deducted) |
|
2025 |
2024 |
2023 |
|
2022 |
|
2021 |
||
SCT Total for Mr. Somerhalder |
|
N/A |
N/A |
$ |
4,497,007 |
|
$ |
3,663,808 |
|
N/A |
- change in actuarial present value of pension benefits |
|
|
|
N/A |
|
$ |
(115,970 |
) |
|
|
+ service cost of pension benefits |
|
|
|
$ |
201,653 |
|
$ |
98,356 |
|
|
+ prior service cost of pension benefits |
|
|
|
N/A |
|
N/A |
|
|
||
- SCT Stock Awards column value |
|
|
|
$ |
(3,166,015 |
) |
$ |
(2,188,623 |
) |
|
- SCT Option Awards column value |
|
|
|
N/A |
|
N/A |
|
|
||
+ year-end fair value of outstanding equity awards granted in covered year |
|
|
|
N/A |
|
$ |
2,442,000 |
|
|
|
+/- change in fair value of outstanding equity awards granted in prior years |
|
|
|
$ |
290,015 |
|
$ |
(59,917 |
) |
|
+ vesting date fair value of equity awards granted and vested in covered year |
|
|
|
$ |
3,008,323 |
|
N/A |
|
|
|
+/- change in fair value of prior-year equity awards vested in covered year |
|
|
|
$ |
16,145 |
|
$ |
18,941 |
|
|
- prior year-end fair value of prior year equity awards forfeited in covered year |
|
|
|
N/A |
|
N/A |
|
|
||
+ includable dividends/earnings on equity awards during covered year |
|
|
|
N/A |
|
$ |
72,421 |
|
|
|
Compensation Actually Paid for Mr. Somerhalder |
|
N/A |
N/A |
$ |
4,847,129 |
|
$ |
3,931,015 |
|
N/A |
Item and Value Added (Deducted) |
|
2025 |
|
2024 |
|
2023 |
|
2022 |
2021 |
|||
SCT Total for Mr. Tierney |
|
$ |
13,448,255 |
|
$ |
11,933,534 |
|
$ |
26,452,616 |
|
N/A |
N/A |
- change in actuarial present value of pension benefits |
|
$ |
(115,314 |
) |
$ |
(186,854 |
) |
$ |
(49,154 |
) |
|
|
+ service cost of pension benefits |
|
$ |
234,532 |
|
$ |
95,024 |
|
N/A |
|
|
|
|
+ prior service cost of pension benefits |
|
N/A |
|
N/A |
|
N/A |
|
|
|
|||
- SCT Stock Awards column value |
|
$ |
(9,406,196 |
) |
$ |
(10,197,274 |
) |
$ |
(22,267,685 |
) |
|
|
- SCT Option Awards column value |
|
N/A |
|
N/A |
|
N/A |
|
|
|
|||
+ year-end fair value of outstanding equity awards granted in covered year |
|
$ |
11,647,071 |
|
$ |
10,525,290 |
|
$ |
26,812,527 |
|
|
|
+/- change in fair value of outstanding equity awards granted in prior years |
|
$ |
2,437,937 |
|
$ |
(188,226 |
) |
N/A |
|
|
|
|
+ vesting date fair value of equity awards granted and vested in covered year |
|
N/A |
|
N/A |
|
N/A |
|
|
|
|||
+/- change in fair value of prior-year equity awards vested in covered year |
|
$ |
(332,913 |
) |
$ |
(1,254,321 |
) |
N/A |
|
|
|
|
- prior year-end fair value of prior year equity awards forfeited in covered year |
|
N/A |
|
N/A |
|
N/A |
|
|
|
|||
+ includable dividends/earnings on equity awards during covered year |
|
N/A |
|
N/A |
|
N/A |
|
|
|
|||
Compensation Actually Paid for Mr. Tierney |
|
$ |
17,913,372 |
|
$ |
10,727,173 |
|
$ |
30,948,304 |
|
N/A |
N/A |
(2) For each Covered Year, in determining both the CAP to our PEOs and the average CAP to our non-PEO named executive officers for purposes of this PVP Table, we deducted from or added back to the total amounts of compensation reported in column (b) for such Covered Year the following amounts:
Item and Value Added (Deducted) |
|
2025 |
|
2024 |
|
2023 |
|
2022 |
|
2021 |
|
|||||
Average SCT Total for Non-PEO Named Executive Officers |
|
$ |
3,368,414 |
|
$ |
2,931,354 |
|
$ |
4,478,599 |
|
$ |
3,195,262 |
|
$ |
4,368,522 |
|
- change in actuarial present value of pension benefits |
|
$ |
(137,757 |
) |
$ |
(135,798 |
) |
$ |
(209,411 |
) |
$ |
(24,686 |
) |
$ |
(136,884 |
) |
+ service cost of pension benefits |
|
$ |
103,069 |
|
$ |
96,470 |
|
$ |
95,864 |
|
$ |
146,164 |
|
$ |
75,895 |
|
+ prior service cost of pension benefits |
|
N/A |
|
N/A |
|
N/A |
|
N/A |
|
N/A |
|
|||||
- SCT Stock Awards column value |
|
$ |
(1,795,719 |
) |
$ |
(1,681,249 |
) |
$ |
(3,119,704 |
) |
$ |
(1,515,633 |
) |
$ |
(2,293,441 |
) |
- SCT Option Awards column value |
|
N/A |
|
N/A |
|
N/A |
|
N/A |
|
N/A |
|
|||||
+ year-end fair value of outstanding equity awards granted in covered year |
|
$ |
2,223,447 |
|
$ |
1,599,222 |
|
$ |
2,753,339 |
|
$ |
1,601,589 |
|
$ |
2,791,195 |
|
+/- change in fair value of outstanding equity awards granted in prior years |
|
$ |
568,448 |
|
$ |
50,274 |
|
$ |
(534,263 |
) |
$ |
244,735 |
|
$ |
334,706 |
|
+ vesting date fair value of equity awards granted and vested in covered year |
|
N/A |
|
N/A |
|
N/A |
|
N/A |
|
N/A |
|
|||||
+/- change in fair value of prior-year equity awards vested in covered year |
|
$ |
(37,236 |
) |
$ |
(455,530 |
) |
$ |
120,922 |
|
$ |
199,488 |
|
$ |
156,913 |
|
- prior year-end fair value of prior year equity awards forfeited in covered year |
|
$ |
0 |
|
$ |
0 |
|
$ |
(116,843 |
) |
$ |
0 |
|
$ |
0 |
|
+ includable dividends/earnings on equity awards during covered year |
|
N/A |
|
N/A |
|
N/A |
|
N/A |
|
N/A |
|
|||||
Compensation Actually Paid for non-PEO Named Executive Officers |
|
$ |
4,292,665 |
|
$ |
2,404,744 |
|
$ |
3,468,502 |
|
$ |
3,846,919 |
|
$ |
5,296,905 |
|

2025 Tabular List
The following Tabular List provides the three financial performance measures that we believe represent the most important financial performance measures we used to link compensation actually paid to our named executive officers for fiscal 2025 to our performance:
Core Earnings |
3-Year Cumulative Core EPS |
Total Shareholder Return |