Pay vs Performance Disclosure
Dec. 31, 2025
USD ($)
PercentileRank
Dec. 31, 2024
USD ($)
PercentileRank
Dec. 31, 2023
USD ($)
PercentileRank
Dec. 31, 2022
USD ($)
PercentileRank
Dec. 31, 2021
USD ($)
PercentileRank
Pay Versus Performance
As discussed in our Compensation Discussion and Analysis, our executive compensation program is designed to reflect a strong focus on pay-for-performance to drive superior financial results and value creation and strongly align our executives’ interests with those of our shareholders. For more information about our pay-for-performance philosophy and how that is incorporated in our executive compensation program, see the discussion on Compensation Philosophy and Principles — Pay-for-Performance on page 29 of our Compensation Discussion and Analysis. The following table and accompanying disclosures report “compensation actually paid” (“CAP”) to our CEO and the average of such pay to our other NEOs (“Non-CEO NEOs”), along with other specified financial performance measures. The amounts shown for CAP are calculated in accordance with SEC rules and do not reflect the actual amount of compensation earned by or paid to our NEOs.
Pay Versus Performance Table
Value of Initial Fixed $100 Investment Based on: | ||||||||||||||||||||||||||
Year | Summary Compensation Table Total for CEO(1) ($) | Compensation Actually Paid to CEO(2) ($) | Average Summary Compensation Table Total for Non-CEO NEOs(3) ($) | Average Compensation Actually Paid to Non-CEO NEOs(2) ($) | Total Shareholder Return(4) ($) | Peer Group Total Shareholder Return(5) ($) | Net Income (in millions)(6) ($) | One-Year Relative TSR (percentile rank)(7) | ||||||||||||||||||
2025 | 13,983,685 | 10,318,880 | 4,125,437 | 3,058,649 | 86.43 | 102.20 | 324 | 51.8th | ||||||||||||||||||
2024 | 12,952,945 | 4,514,762 | 3,718,751 | 1,805,156 | 99.40 | 105.55 | 396 | 29.6th | ||||||||||||||||||
2023 | 13,022,431 | 15,217,383 | 3,806,336 | 3,882,166 | 119.20 | 109.33 | 839 | 44.1st | ||||||||||||||||||
2022 | 12,969,306 | 6,616,958 | 3,660,540 | 2,012,724 | 100.98 | 95.27 | 1,880 | 61.6th | ||||||||||||||||||
2021 | 12,715,531 | 17,032,291 | 4,028,448 | 4,631,147 | 126.92 | 117.33 | 2,607 | 46.3rd | ||||||||||||||||||
(1)Represents total compensation reported for our CEO, Mr. Stockfish, as set forth in the “Total” column of the Summary Compensation Table for the applicable year.
(2)Represents CAP as calculated in accordance with SEC rules. The following table shows the fiscal 2025 adjustments made to CEO total compensation and to the average total compensation of our Non-CEO NEOs in arriving at CAP.
CEO ($) | Average for Non-CEO NEOs ($) | |||||||
Summary Compensation Table Total | 13,983,685 | 4,125,437 | ||||||
Reported Grant Date Fair Value of Equity Awards(a) | (10,155,810) | (2,109,733) | ||||||
Equity Award Adjustments(b) | 6,647,412 | 1,419,222 | ||||||
Reported Change in the Actuarial Present Value of Pension Benefits(c) | (399,375) | (444,852) | ||||||
Pension Benefit Adjustments(d) | 242,968 | 68,575 | ||||||
Compensation Actually Paid | 10,318,880 | 3,058,649 | ||||||
(a) | Represents amounts reported in the “Stock Awards” column in the Summary Compensation Table for fiscal 2025. |
(b)Equity award adjustments for fiscal 2025 include the addition or subtraction of the following: (i) the year-end fair value of any equity awards granted in fiscal 2025 that are outstanding and unvested as of the end of the year; (ii) the change in fair value as of the end of fiscal 2025 (from the end of the prior fiscal year) of awards granted in prior years that are outstanding and unvested as of the end of fiscal 2025; (iii) for awards granted in fiscal 2025 that vested during fiscal 2025, the fair value as of the vesting date; (iv) for awards granted in prior years that vested during fiscal 2025, the amount equal to the change in fair value as of the vesting date (from the end of the prior fiscal year); and (v) for awards granted in prior years that were forfeited or otherwise determined to fail to meet vesting conditions during fiscal 2025, a deduction equal to the fair value of such awards at the end of the prior fiscal year. The dollar value of dividend equivalent units accrued on unvested equity awards during fiscal 2025 is reflected in the fair value of such awards. The valuation assumptions used to calculate fair values did not differ materially from those disclosed at the time of grant. The amounts deducted or added in calculating the equity award adjustments for the CEO and the average for the non-CEO NEOs are set forth in the following table.
CEO ($) | Average for Non-CEO NEOs ($) | |||||||
Year-End Fair Value of Outstanding and Unvested Equity Awards Granted During the Year | 7,862,135 | 1,627,353 | ||||||
Year-Over-Year Change in Fair Value of Outstanding and Unvested Equity Awards Granted in Previous Years | (1,553,470) | (257,602) | ||||||
Fair Value at Vesting Date of Awards Granted and Vested During the Fiscal Year | — | 5,530 | ||||||
Change in Fair Value from End of Prior Year to Vesting Date of Awards Granted in Prior Fiscal Year That Vested During the Fiscal Year | 338,747 | 43,941 | ||||||
Prior Year-End Fair Value of Equity Awards Forfeited During the Year | — | — | ||||||
Total Equity Award Adjustments | 6,647,412 | 1,419,222 | ||||||
(c)Represents amounts reported in the “Change in Pension Value and Nonqualified Deferred Compensation Earnings” column of the Summary Compensation Table for fiscal 2025.
(d)Pension benefit adjustments for fiscal 2025 represent the actuarially determined service cost for services rendered during fiscal 2025 calculated in accordance with U.S. GAAP. There were no plan amendments or initiations during fiscal 2025 and thus no applicable cost of benefits for services rendered in periods prior to a plan amendment or initiation. The pension benefit adjustments were calculated as follows:
CEO ($) | Average for Non-CEO NEOs ($) | |||||||
Service Cost | 242,968 | 68,575 | ||||||
Prior Service Cost | — | — | ||||||
Total Pension Benefit Adjustments | 242,968 | 68,575 | ||||||
(3)Represents the average of the amounts of total compensation reported for our Non-CEO NEOs as set forth in the “Total” column of the Summary Compensation Table for the applicable year. Our Non-CEO NEOs for each year presented were as follows: for 2021, Nancy S. Loewe, Russell S. Hagen, Kristy T. Harlan and Keith J. O’Rear; for 2022, Nancy S. Loewe, David M. Wold, Russell S. Hagen, Travis A. Keatley and Keith J. O’Rear; for 2023, David M. Wold, Russell S. Hagen, Travis A. Keatley and Keith J. O’Rear; for 2024, David M. Wold, Russell S. Hagen, Kristy T. Harlan, Travis A. Keatley and Keith J. O’Rear; and for 2025, David M. Wold, Paul Hossain, Travis A. Keatley and Denise M. Merle.
(4)Represents cumulative TSR of the company for the applicable year.
(5)Represents cumulative TSR of the S&P Global Timber and Forestry Index for the applicable year.
(6)Represents net income as reported in the company’s audited financial statements for the applicable year.
(7)Represents the company’s percentile ranking for the applicable year based on its One-Year TSR relative to that of a comparator group of industry peers used in our PSU long-term incentive awards. The industry peer group for each applicable year corresponds to the composition of the peer group for the same PSU plan year. The Compensation Committee has identified One-Year Relative TSR as the “Company Selected Measure”. While the committee does not view this measure as the single most important financial measure of performance used in the company’s executive compensation program, we are required by SEC disclosure rules to select one such measure and identify it in the Pay Versus Performance Table as the “Company Selected Measure”. The committee chose this measure because relative TSR is used as a performance goal in the PSU plan, in which all NEOs participate. In the PSU plan, relative TSR is measured over a three-year performance period; however, pursuant to SEC guidance, we are required to disclose relative TSR for each fiscal year (a one-year period) in the table. Other important measures of performance, such as Adjusted EBITDA and RONA, are used in different combinations in our short-term incentive plan performance goals among the NEOs.
(1)Represents total compensation reported for our CEO, Mr. Stockfish, as set forth in the “Total” column of the Summary Compensation Table for the applicable year.
(3)Represents the average of the amounts of total compensation reported for our Non-CEO NEOs as set forth in the “Total” column of the Summary Compensation Table for the applicable year. Our Non-CEO NEOs for each year presented were as follows: for 2021, Nancy S. Loewe, Russell S. Hagen, Kristy T. Harlan and Keith J. O’Rear; for 2022, Nancy S. Loewe, David M. Wold, Russell S. Hagen, Travis A. Keatley and Keith J. O’Rear; for 2023, David M. Wold, Russell S. Hagen, Travis A. Keatley and Keith J. O’Rear; for 2024, David M. Wold, Russell S. Hagen, Kristy T. Harlan, Travis A. Keatley and Keith J. O’Rear; and for 2025, David M. Wold, Paul Hossain, Travis A. Keatley and Denise M. Merle.
(5)Represents cumulative TSR of the S&P Global Timber and Forestry Index for the applicable year.
(2)Represents CAP as calculated in accordance with SEC rules. The following table shows the fiscal 2025 adjustments made to CEO total compensation and to the average total compensation of our Non-CEO NEOs in arriving at CAP.
CEO ($) | Average for Non-CEO NEOs ($) | |||||||
Summary Compensation Table Total | 13,983,685 | 4,125,437 | ||||||
Reported Grant Date Fair Value of Equity Awards(a) | (10,155,810) | (2,109,733) | ||||||
Equity Award Adjustments(b) | 6,647,412 | 1,419,222 | ||||||
Reported Change in the Actuarial Present Value of Pension Benefits(c) | (399,375) | (444,852) | ||||||
Pension Benefit Adjustments(d) | 242,968 | 68,575 | ||||||
Compensation Actually Paid | 10,318,880 | 3,058,649 | ||||||
(a) | Represents amounts reported in the “Stock Awards” column in the Summary Compensation Table for fiscal 2025. |
(b)Equity award adjustments for fiscal 2025 include the addition or subtraction of the following: (i) the year-end fair value of any equity awards granted in fiscal 2025 that are outstanding and unvested as of the end of the year; (ii) the change in fair value as of the end of fiscal 2025 (from the end of the prior fiscal year) of awards granted in prior years that are outstanding and unvested as of the end of fiscal 2025; (iii) for awards granted in fiscal 2025 that vested during fiscal 2025, the fair value as of the vesting date; (iv) for awards granted in prior years that vested during fiscal 2025, the amount equal to the change in fair value as of the vesting date (from the end of the prior fiscal year); and (v) for awards granted in prior years that were forfeited or otherwise determined to fail to meet vesting conditions during fiscal 2025, a deduction equal to the fair value of such awards at the end of the prior fiscal year. The dollar value of dividend equivalent units accrued on unvested equity awards during fiscal 2025 is reflected in the fair value of such awards. The valuation assumptions used to calculate fair values did not differ materially from those disclosed at the time of grant. The amounts deducted or added in calculating the equity award adjustments for the CEO and the average for the non-CEO NEOs are set forth in the following table.
CEO ($) | Average for Non-CEO NEOs ($) | |||||||
Year-End Fair Value of Outstanding and Unvested Equity Awards Granted During the Year | 7,862,135 | 1,627,353 | ||||||
Year-Over-Year Change in Fair Value of Outstanding and Unvested Equity Awards Granted in Previous Years | (1,553,470) | (257,602) | ||||||
Fair Value at Vesting Date of Awards Granted and Vested During the Fiscal Year | — | 5,530 | ||||||
Change in Fair Value from End of Prior Year to Vesting Date of Awards Granted in Prior Fiscal Year That Vested During the Fiscal Year | 338,747 | 43,941 | ||||||
Prior Year-End Fair Value of Equity Awards Forfeited During the Year | — | — | ||||||
Total Equity Award Adjustments | 6,647,412 | 1,419,222 | ||||||
(c)Represents amounts reported in the “Change in Pension Value and Nonqualified Deferred Compensation Earnings” column of the Summary Compensation Table for fiscal 2025.
(d)Pension benefit adjustments for fiscal 2025 represent the actuarially determined service cost for services rendered during fiscal 2025 calculated in accordance with U.S. GAAP. There were no plan amendments or initiations during fiscal 2025 and thus no applicable cost of benefits for services rendered in periods prior to a plan amendment or initiation. The pension benefit adjustments were calculated as follows:
CEO ($) | Average for Non-CEO NEOs ($) | |||||||
Service Cost | 242,968 | 68,575 | ||||||
Prior Service Cost | — | — | ||||||
Total Pension Benefit Adjustments | 242,968 | 68,575 | ||||||
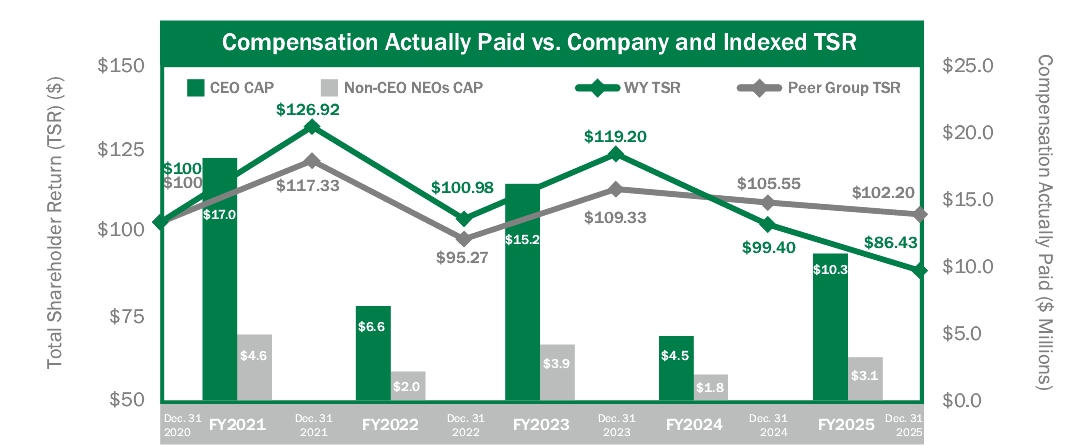
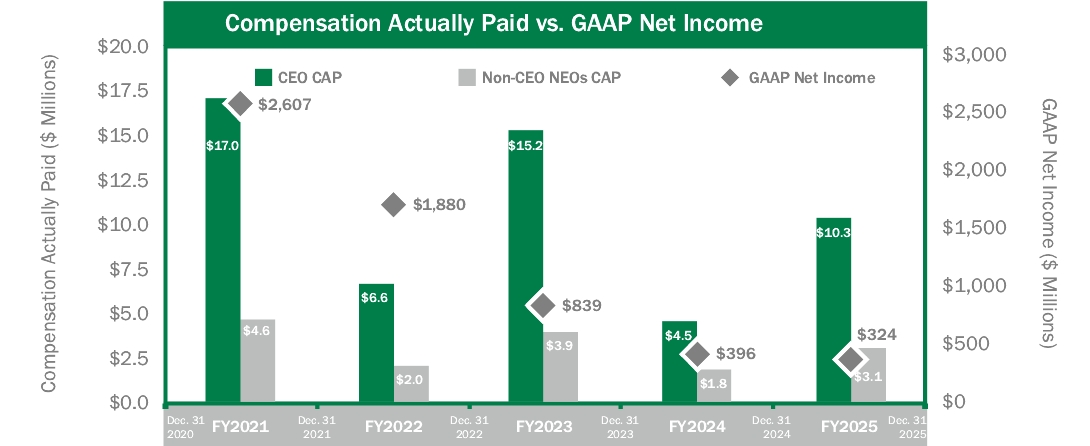
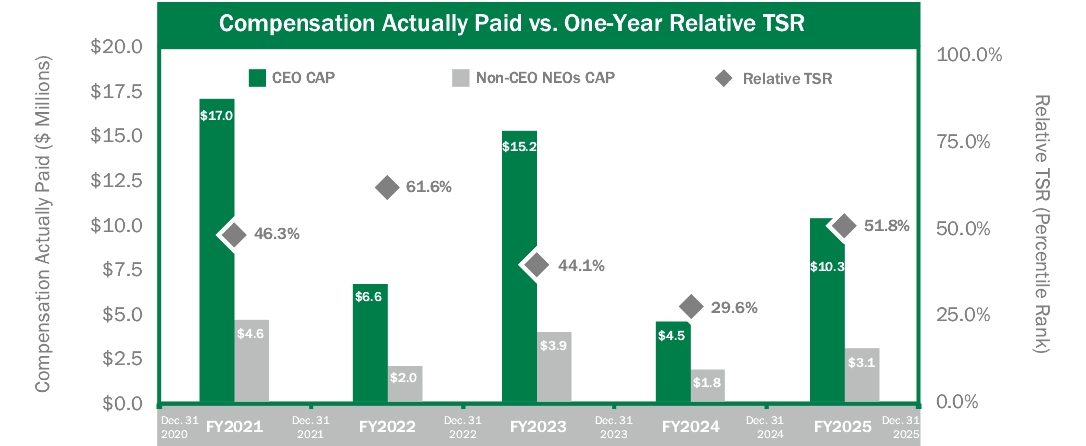
Table of Financial Performance Measures
Set forth below are the financial measures of company performance that the Compensation Committee and the board of directors view as the most important in aligning the interests and incentives of our executives with those of the company and its shareholders. The measures in this table are not listed in order of importance. How we define and use these measures in our executive compensation program, as well as the Compensation Committee’s reasons for choosing them, is discussed in our Compensation Discussion and Analysis, beginning on page 25.
Most Important Performance Measures | ||
Adjusted EBITDA | ||
Relative Total Shareholder Return | ||
Return on Net Assets (RONA) | ||
(d)Pension benefit adjustments for fiscal 2025 represent the actuarially determined service cost for services rendered during fiscal 2025 calculated in accordance with U.S. GAAP. There were no plan amendments or initiations during fiscal 2025 and thus no applicable cost of benefits for services rendered in periods prior to a plan amendment or initiation. The pension benefit adjustments were calculated as follows:
CEO ($) | Average for Non-CEO NEOs ($) | |||||||
Service Cost | 242,968 | 68,575 | ||||||
Prior Service Cost | — | — | ||||||
Total Pension Benefit Adjustments | 242,968 | 68,575 | ||||||
(b)Equity award adjustments for fiscal 2025 include the addition or subtraction of the following: (i) the year-end fair value of any equity awards granted in fiscal 2025 that are outstanding and unvested as of the end of the year; (ii) the change in fair value as of the end of fiscal 2025 (from the end of the prior fiscal year) of awards granted in prior years that are outstanding and unvested as of the end of fiscal 2025; (iii) for awards granted in fiscal 2025 that vested during fiscal 2025, the fair value as of the vesting date; (iv) for awards granted in prior years that vested during fiscal 2025, the amount equal to the change in fair value as of the vesting date (from the end of the prior fiscal year); and (v) for awards granted in prior years that were forfeited or otherwise determined to fail to meet vesting conditions during fiscal 2025, a deduction equal to the fair value of such awards at the end of the prior fiscal year. The dollar value of dividend equivalent units accrued on unvested equity awards during fiscal 2025 is reflected in the fair value of such awards. The valuation assumptions used to calculate fair values did not differ materially from those disclosed at the time of grant. The amounts deducted or added in calculating the equity award adjustments for the CEO and the average for the non-CEO NEOs are set forth in the following table.
CEO ($) | Average for Non-CEO NEOs ($) | |||||||
Year-End Fair Value of Outstanding and Unvested Equity Awards Granted During the Year | 7,862,135 | 1,627,353 | ||||||
Year-Over-Year Change in Fair Value of Outstanding and Unvested Equity Awards Granted in Previous Years | (1,553,470) | (257,602) | ||||||
Fair Value at Vesting Date of Awards Granted and Vested During the Fiscal Year | — | 5,530 | ||||||
Change in Fair Value from End of Prior Year to Vesting Date of Awards Granted in Prior Fiscal Year That Vested During the Fiscal Year | 338,747 | 43,941 | ||||||
Prior Year-End Fair Value of Equity Awards Forfeited During the Year | — | — | ||||||
Total Equity Award Adjustments | 6,647,412 | 1,419,222 | ||||||
(7)Represents the company’s percentile ranking for the applicable year based on its One-Year TSR relative to that of a comparator group of industry peers used in our PSU long-term incentive awards. The industry peer group for each applicable year corresponds to the composition of the peer group for the same PSU plan year. The Compensation Committee has identified One-Year Relative TSR as the “Company Selected Measure”. While the committee does not view this measure as the single most important financial measure of performance used in the company’s executive compensation program, we are required by SEC disclosure rules to select one such measure and identify it in the Pay Versus Performance Table as the “Company Selected Measure”. The committee chose this measure because relative TSR is used as a performance goal in the PSU plan, in which all NEOs participate. In the PSU plan, relative TSR is measured over a three-year performance period; however, pursuant to SEC guidance, we are required to disclose relative TSR for each fiscal year (a one-year period) in the table. Other important measures of performance, such as Adjusted EBITDA and RONA, are used in different combinations in our short-term incentive plan performance goals among the NEOs.