PAY VERSUS PERFORMANCE (PVP)
As required by Section 953(a) of the Dodd-Frank Wall Street Reform and Consumer Protection Act, and Item 402(v) of Regulation S-K, we are providing the following information about the relationship between compensation actually paid to our NEOs and certain financial performance metrics of the Company using a methodology that has been prescribed by the SEC.
| Value of Initial Fixed $100 | ||||||||||
| Fiscal | Summary | Summary | Compensation | Compensation | Average | Average | Total | Peer Group | Net Income | Return on |
| (a) | (b) | (b) | (c) | (c) | (d) | (e) | (f) | (g) | (h) | (i) |
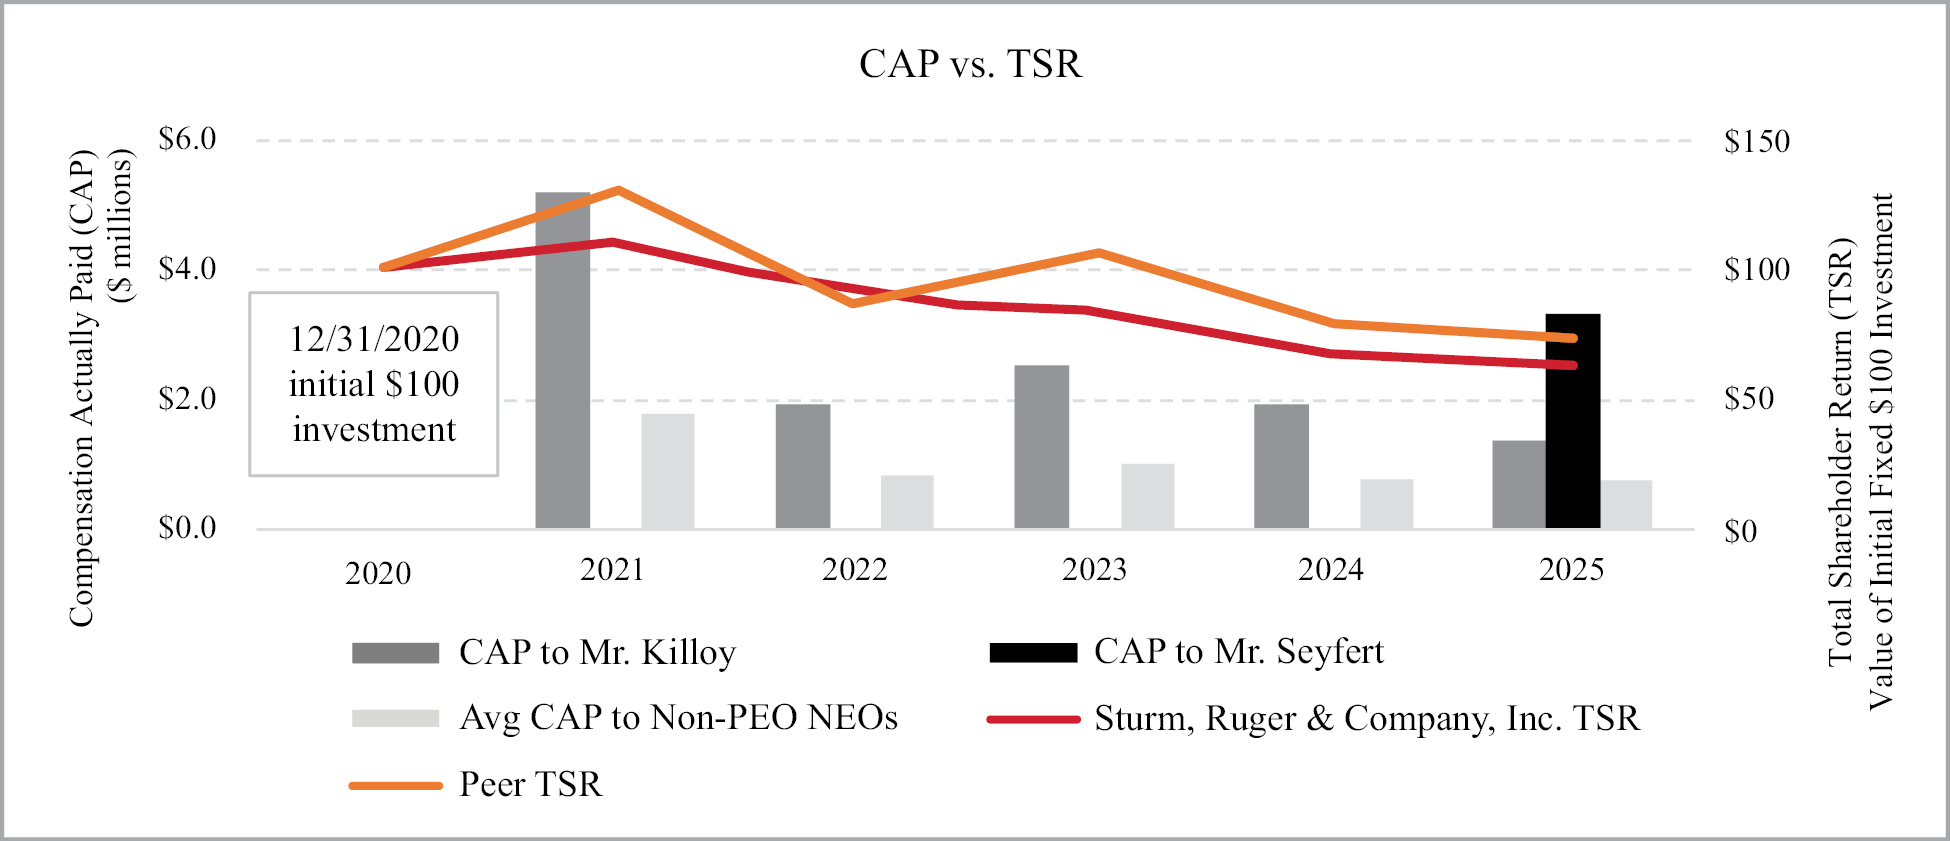
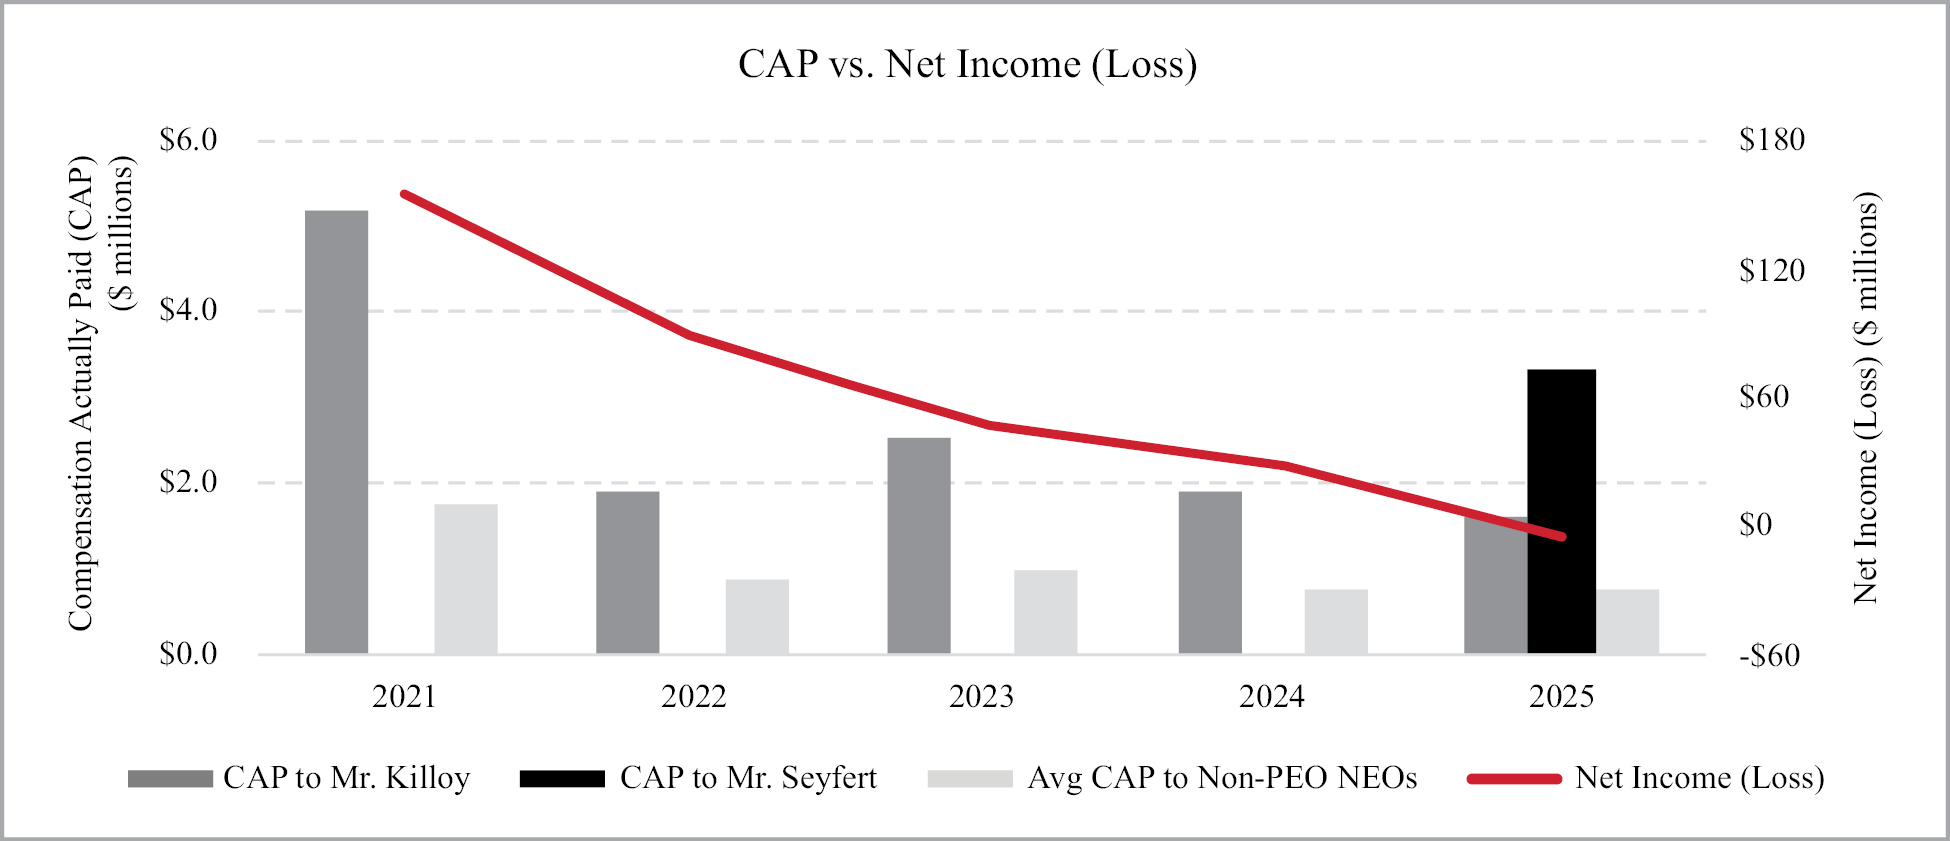
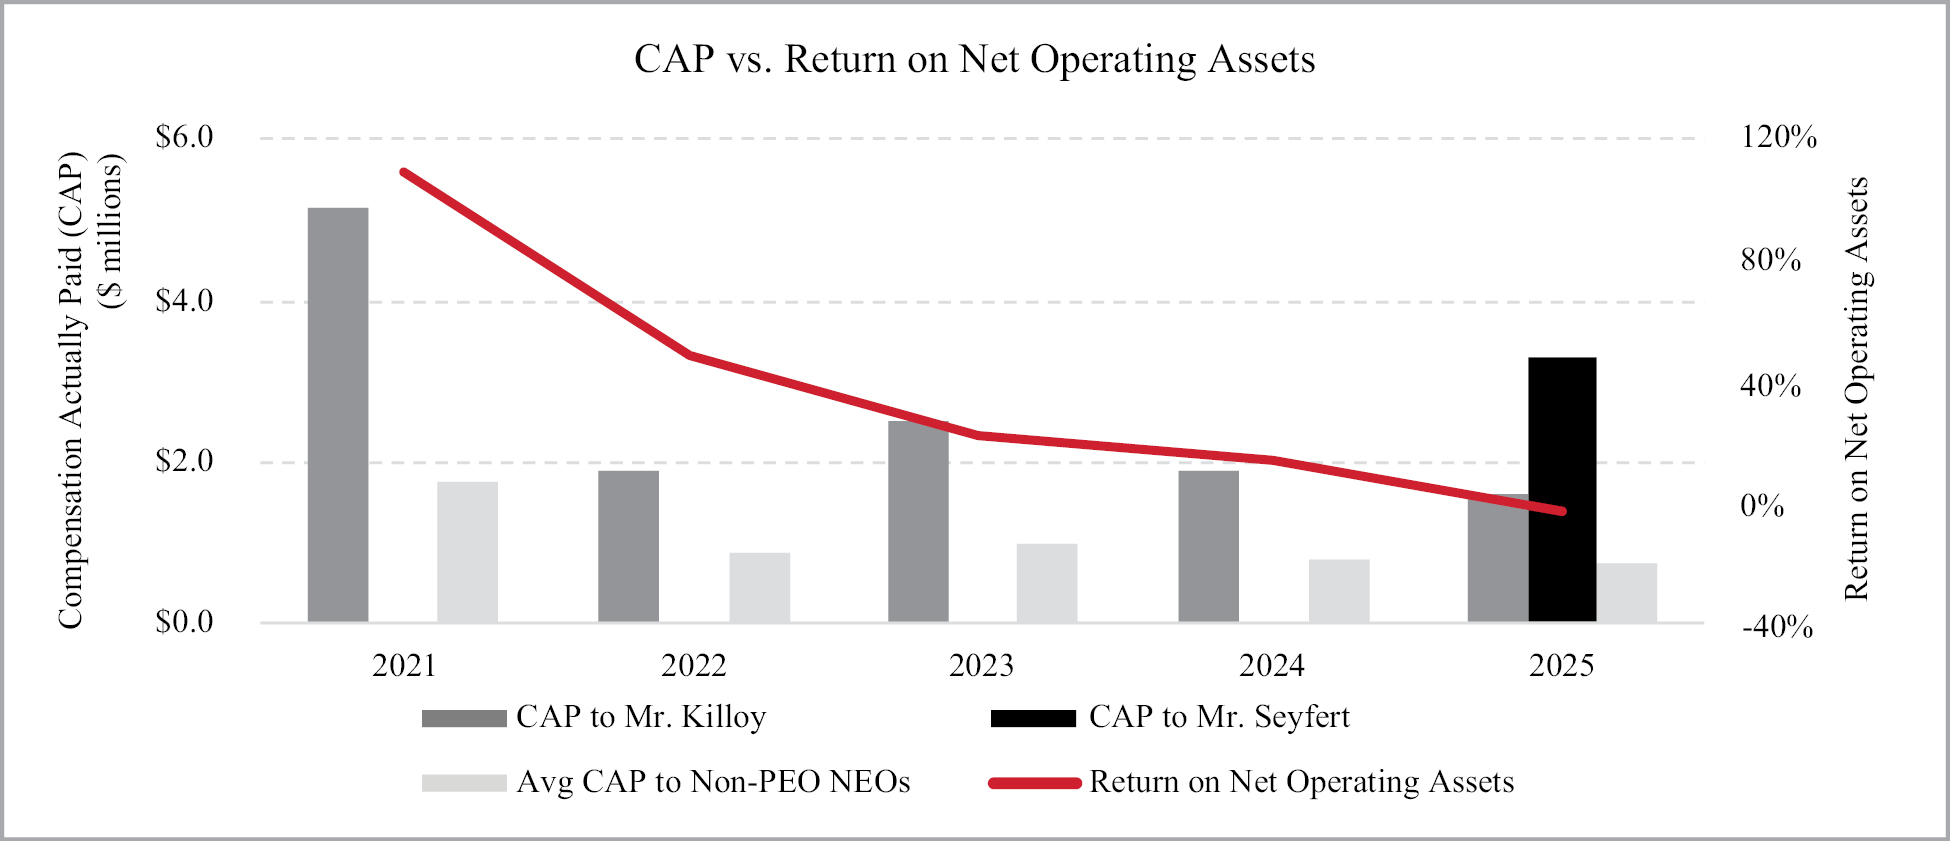
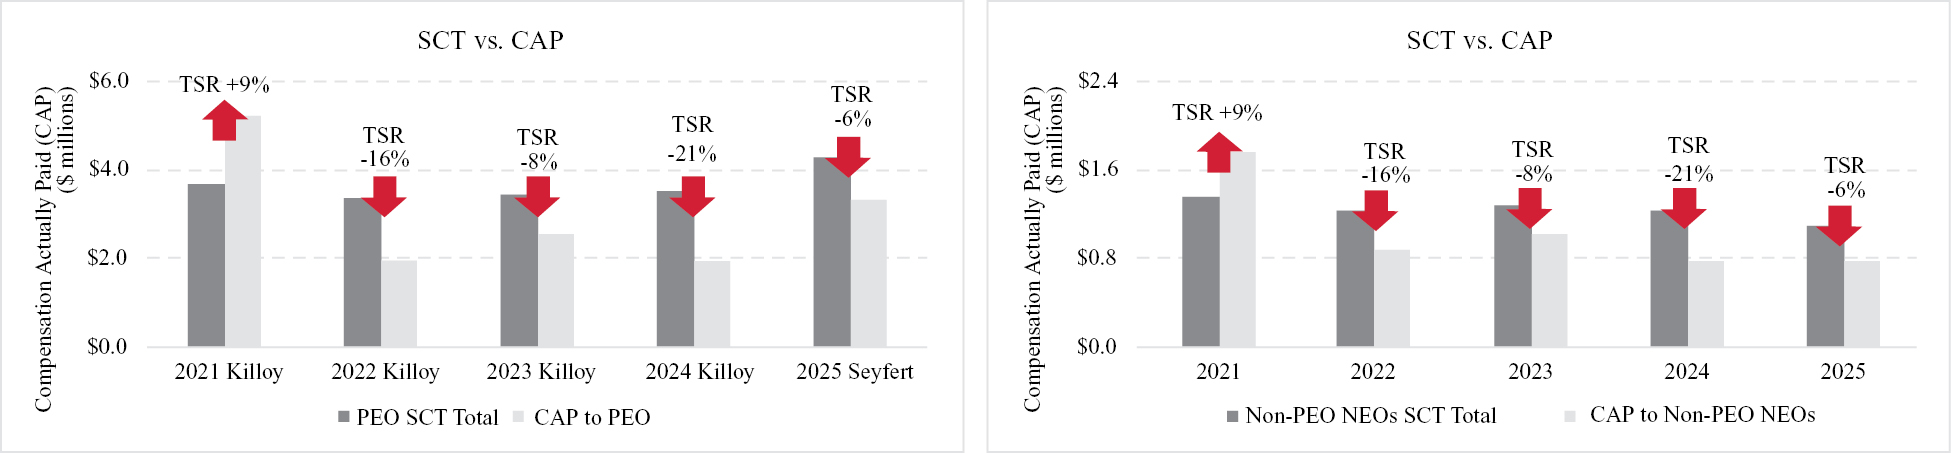
| 2025 | $2,944,092 | $4,270,103 | $1,634,400 | $3,312,303 | $1,103,644 | $758,762 | $62.99 | $72.88 | ($4,391) | -3% |
| 2024 | $3,502,442 | n/a | $1,921,492 |
| $1,249,081 | $783,311 | $67.10 | $80.71 | $30,563 | 14% |
| 2023 | $3,411,212 | n/a | $2,528,715 |
| $1,284,600 | $1,001,893 | $84.85 | $105.81 | $48,215 | 22% |
| 2022 | $3,335,852 | n/a | $1,926,234 |
| $1,237,715 | $878,784 | $92.28 | $85.93 | $88,332 | 48% |
| 2021 | $3,666,621 | n/a | $5,188,345 |
| $1,380,720 | $1,781,743 | $109.27 | $130.85 | $155,899 | 109% |
(1) Mr. Killoy served as our principal executive officer (“PEO”) until March 1, 2025. Mr. Seyfert has served as our PEO beginning March 1, 2025. The non-PEO NEOs reflected in columns (d) and (e) include the following individuals: Messrs. Dineen (2021-2025), Reid, Sr. (2021-2025), Leska (2021-2025), Lowney (2024), Sullivan (2021-2023), and Werkmeister (2025) and Ms. Colbert (2025).
(2) The following amounts were deducted from/added to Summary Compensation Table (“SCT”) total compensation in accordance with the SEC-mandated adjustments to calculate Compensation Actually Paid (“CAP”) to our PEO and average CAP to our non-PEO NEOs. The fair value of equity awards was determined using methodologies and assumptions developed in a manner substantively consistent with those used to determine the grant date fair value of such awards. We are providing reconciliations for fiscal years 2023 and 2024 because of the revisions in this year’s Summary Compensation Table to the grant date fair value of the performance-based equity awards in such years.
| 2025 SCT Total to CAP Reconciliation | Mr. Killoy | Mr. Seyfert | Non-PEO |
| SCT Total | $2,944,092 | $4,270,103 | $1,103,644 |
| - Grant Date Fair Value of Stock Awards Granted in Fiscal Year | ($2,242,718) | ($3,099,795) | ($607,700) |
| + Fair Value at Fiscal Year-End of Outstanding Unvested Stock Awards Granted in Fiscal Year | $1,442,329 | $2,092,498 | $412,698 |
| ± Change in Fair Value of Outstanding Unvested Stock Awards Granted in Prior Fiscal Years | ($619,753) | $0 | ($175,906) |
| + Fair Value at Vesting of Stock Awards Granted in Fiscal Year That Vested During Fiscal Year | $0 | $0 | $0 |
| ± Change in Fair Value as of Vesting Date of Stock Awards Granted in Prior Fiscal Years For Which Applicable Vesting Conditions Were Satisfied During Fiscal Year | $63,382 | $0 | $12,588 |
| - Fair Value as of Prior Fiscal Year-End of Stock Awards Granted in Prior Fiscal Years That Failed to Meet Applicable Vesting Conditions During Fiscal Year | $0 | $0 | $0 |
| + Dividends Accrued During Fiscal Year | $47,068 | $49,497 | $13,438 |
| Compensation Actually Paid | $1,634,400 | $3,312,303 | $758,762 |
| 2024 SCT Total to CAP Reconciliation | Mr. Killoy | Non-PEO |
| SCT Total | $3,502,442 | $1,249,081 |
| - Grant Date Fair Value of Stock Awards Granted in Fiscal Year | ($2,099,185) | ($631,968) |
| + Fair Value at Fiscal Year-End of Outstanding Unvested Stock Awards Granted in Fiscal Year | $1,424,211 | $428,934 |
| ± Change in Fair Value of Outstanding Unvested Stock Awards Granted in Prior Fiscal Years | ($869,562) | ($253,632) |
| + Fair Value at Vesting of Stock Awards Granted in Fiscal Year That Vested During Fiscal Year | $0 | $0 |
| ± Change in Fair Value as of Vesting Date of Stock Awards Granted in Prior Fiscal Years For Which Applicable Vesting Conditions Were Satisfied During Fiscal Year | ($54,390) | ($14,468) |
| - Fair Value as of Prior Fiscal Year-End of Stock Awards Granted in Prior Fiscal Years That Failed to Meet Applicable Vesting Conditions During Fiscal Year | $0 | $0 |
| + Dividends Accrued During Fiscal Year | $17,976 | $5,364 |
| Compensation Actually Paid | $1,921,492 | $783,311 |
| 2023 SCT Total to CAP Reconciliation | Mr. Killoy | Non-PEO |
| SCT Total | $3,411,212 | $1,284,600 |
| - Grant Date Fair Value of Stock Awards Granted in Fiscal Year | ($1,968,015) | ($628,114) |
| + Fair Value at Fiscal Year-End of Outstanding Unvested Stock Awards Granted in Fiscal Year | $1,440,628 | $459,809 |
| ± Change in Fair Value of Outstanding Unvested Stock Awards Granted in Prior Fiscal Years | ($646,126) | ($201,536) |
| + Fair Value at Vesting of Stock Awards Granted in Fiscal Year That Vested During Fiscal Year | $0 | $0 |
| ± Change in Fair Value as of Vesting Date of Stock Awards Granted in Prior Fiscal Years For Which Applicable Vesting Conditions Were Satisfied During Fiscal Year | $296,141 | $88,320 |
| - Fair Value as of Prior Fiscal Year-End of Stock Awards Granted in Prior Fiscal Years That Failed to Meet Applicable Vesting Conditions During Fiscal Year | $0 | $0 |
| + Dividends Accrued During Fiscal Year | ($5,125) | ($1,186) |
| Compensation Actually Paid | $2,528,715 | $1,001,893 |
(3) The Peer Group for which Total Shareholder Return is provided in column (g) is the Dow Jones US Recreational Products TSM index.
(4) Return on Net Operating Assets is calculated as Pre-Tax Income divided by Average Adjusted Net Assets (Total Assets less Total Liabilities, excluding debt, less Cash plus LIFO reserve).
TABULAR LIST OF MOST IMPORTANT PERFORMANCE MEASURES
The three items listed below represent the most important performance metrics we used to determine CAP for FY2025 as further described in our Compensation Discussion and Analysis (CD&A) within the sections titled “How are Profit Sharing and Bonuses Determined?” and “How are Equity Compensation Awards Determined?”
| Most Important Performance Measures | |
| • Return on Net Operating Assets (RONA) • Pre-Tax Income • Adjusted Operating Profit (AOP) |
| [1] | Mr. Killoy served as our principal executive officer (“PEO”) until March 1, 2025. Mr. Seyfert has served as our PEO beginning March 1, 2025. The non-PEO NEOs reflected in columns (d) and (e) include the following individuals: Messrs. Dineen (2021-2025), Reid, Sr. (2021-2025), Leska (2021-2025), Lowney (2024), Sullivan (2021-2023), and Werkmeister (2025) and Ms. Colbert (2025). | ||||||||||||||||||||||||||||||||||||||||||||||||||||||||||||||||||||||||||||||||||||||||||||||||||||
| [2] | The following amounts were deducted from/added to Summary Compensation Table (“SCT”) total compensation in accordance with the SEC-mandated adjustments to calculate Compensation Actually Paid (“CAP”) to our PEO and average CAP to our non-PEO NEOs. The fair value of equity awards was determined using methodologies and assumptions developed in a manner substantively consistent with those used to determine the grant date fair value of such awards. We are providing reconciliations for fiscal years 2023 and 2024 because of the revisions in this year’s Summary Compensation Table to the grant date fair value of the performance-based equity awards in such years.
|
||||||||||||||||||||||||||||||||||||||||||||||||||||||||||||||||||||||||||||||||||||||||||||||||||||
| [3] | The Peer Group for which Total Shareholder Return is provided in column (g) is the Dow Jones US Recreational Products TSM index | ||||||||||||||||||||||||||||||||||||||||||||||||||||||||||||||||||||||||||||||||||||||||||||||||||||
| [4] | Return on Net Operating Assets is calculated as Pre-Tax Income divided by Average Adjusted Net Assets (Total Assets less Total Liabilities, excluding debt, less Cash plus LIFO reserve). |