Pay vs Performance Disclosure
|
12 Months Ended |
|
Dec. 31, 2025
USD ($)
$ / shares
|
Dec. 31, 2024
USD ($)
$ / shares
|
Dec. 31, 2023
USD ($)
$ / shares
|
Dec. 31, 2022
USD ($)
$ / shares
|
Dec. 31, 2021
USD ($)
$ / shares
|
| Pay vs Performance Disclosure [Table] |
|
|
|
|
|
| Pay vs Performance Disclosure, Table |
Pay
Versus Performance Disclosure
Pursuant
to Section 953(a) of the Dodd-Frank Act and Item 402(v) of Regulation S-K, Fulton is providing the following information about
the relationship between executive compensation actually paid (“CAP”) to Fulton’s principal executive
officer (“PEO”) and non-PEO named executive officers (the “Non-PEO NEOs”) and certain aspects of
the financial performance of Fulton. The HR Committee does not utilize CAP as the basis for making compensation decisions. Please see
the CD&A with respect to additional information with respect to our compensation philosophy and how we align executive compensation
with our performance.
| |
Pay
Versus Performance Table |
|
| |
Year(1)
(a) |
|
Summary
Compensation
Table Total for
PEO(2)
(b) |
|
Compensation
Actually Paid
to PEO(3)
(c) |
|
Average
Summary
Compensation
Table Total
for Non-PEO
NEOs(2)
(d) |
|
Average
Compensation
Actually Paid
to Non-PEO
NEOs(3)
(e) |
|
Value
of Initial Fixed
$100 Investment
Based on:(4) |
|
Net
Income
(GAAP)(6)
(h) |
|
Company
Selected
Metric:
Adjusted
EPS(7)
(i) |
|
| |
|
|
|
|
|
TSR
(f) |
|
|
Peer
Group
TSR(5)
(g) |
|
|
|
| |
2025 |
|
$5,184,944 |
|
$5,733,586 |
|
$1,737,331 |
|
$1,881,976 |
|
$183.57 |
|
$131.30 |
|
$392 |
|
$2.16 |
|
| |
2024 |
|
$3,337,831 |
|
$4,335,378 |
|
$1,178,658 |
|
$1,073,637 |
|
$177.10 |
|
$125.97 |
|
$289 |
|
$1.68 |
|
| |
2023 |
|
$2,309,440 |
|
$2,862,798 |
|
$999,817 |
|
$1,196,969 |
|
$146.02 |
|
$107.92 |
|
$284 |
|
$1.70 |
|
| |
2022 |
|
$4,923,557 |
|
$5,537,243 |
|
$1,541,616 |
|
$1,675,245 |
|
$142.98 |
|
$115.66 |
|
$287 |
|
$1.76 |
|
| |
2021 |
|
$4,207,894 |
|
$5,365,077 |
|
$1,395,455 |
|
$1,745,204 |
|
$138.94 |
|
$142.26 |
|
$275 |
|
$1.62 |
|
|
|
|
|
|
| Company Selected Measure Name |
Adjusted
EPS
|
|
|
|
|
| Named Executive Officers, Footnote |
| (1) | Mr.
Myers served as the PEO for the entirety of 2025, 2024 and 2023. Mr. Wenger served as the
PEO for the entirety of 2022 and 2021. Our Non-PEO NEOs for the applicable years were as
follows: |
| | |
| | • | 2025:
Richard S. Kraemer, Angela M. Snyder, Andrew B. Fiol and Meg R. Mueller; |
| | • | 2024:
Mark R. McCollom, Beth Ann L. Chivinski, Richard S. Kraemer, Karthik K. Sridharan; |
| | • | 2023:
Mark R. McCollom, Angela M. Snyder, Meg R. Mueller and Beth Ann L. Chivinski; |
| | • | 2022:
Mark R. McCollom, Curtis J. Myers, Natasha Luddington and Angela M. Snyder; and |
| | • | 2021:
Curtis J. Myers, Mark R. McCollom, Angela M. Snyder and Meg R. Mueller;
|
|
|
|
|
|
| Peer Group Issuers, Footnote |
Peer
Group total shareholder return (“Peer Group TSR”) represents the Nasdaq
Bank Index, which is used by Fulton for purposes of compliance with Item 201(e) of Regulation
S-K.
|
|
|
|
|
| PEO Total Compensation Amount |
$ 5,184,944
|
$ 3,337,831
|
$ 2,309,440
|
$ 4,923,557
|
$ 4,207,894
|
| PEO Actually Paid Compensation Amount |
$ 5,733,586
|
4,335,378
|
2,862,798
|
5,537,243
|
5,365,077
|
| Adjustment To PEO Compensation, Footnote |
| |
|
|
2025
|
|
2024
|
|
2023
|
|
2022
|
|
2021
|
|
| |
|
|
PEO
Myers
|
|
Average
Non-PEO
NEOs
|
|
PEO
Myers
|
|
Average
Non-PEO
NEOs
|
|
PEO
Myers
|
|
Average
Non-PEO
NEOs
|
|
PEO
Wenger
|
|
Average
Non-PEO
NEOs
|
|
PEO
Wenger
|
|
Average
Non-PEO
NEOs
|
|
| |
Summary
Compensation
Table Total
|
|
$5,184,944
|
|
$1,737,331
|
|
$3,337,831
|
|
$1,178,658
|
|
$2,309,440
|
|
$999,817
|
|
$4,923,557
|
|
$1,541,616
|
|
$4,207,894
|
|
$1,395,455
|
|
| |
Less Stock
Award Value & Option Award Value Reported in
SCT for the
Covered Year
|
|
$2,558,162
|
|
$654,024
|
|
$1,329,526
|
|
$441,951
|
|
$954,757
|
|
$379,503
|
|
$2,076,061
|
|
$462,213
|
|
$1,305,528
|
|
$395,464
|
|
| |
Plus Year
End Fair Value of Equity Awards Granted During the Covered Year that Remain Outstanding and
Unvested as of Last Day of the Covered Year
|
|
$2,998,283
|
|
$667,385
|
|
$1,432,754
|
|
$375,360
|
|
$1,616,090
|
|
$642,375
|
|
$2,517,933
|
|
$552,934
|
|
$1,335,263
|
|
$404,470
|
|
| |
Plus Year
over Year Change in Fair Value as of the Last Day of the Covered Year of Outstanding and
Unvested Equity Awards Granted in Prior Years
|
|
$172,273
|
|
$50,245
|
|
$789,392
|
|
$177,116
|
|
$191,243
|
|
$111,252
|
|
$233,715
|
|
$57,715
|
|
$944,182
|
|
$285,212
|
|
| |
Plus Fair
Value as of Vesting Date of Equity Awards Granted and Vested in the Covered Year
|
|
-
|
|
$98,658
|
|
-
|
|
$80,075
|
|
-
|
|
-
|
|
-
|
|
-
|
|
-
|
|
-
|
|
| |
Plus Year
over Year Change in Fair Value as of the Vesting Date of Equity Awards Granted in Prior Years
that Vested During the Covered Year
|
|
($63,752
|
)
|
($17,618
|
)
|
$104,927
|
|
$27,582
|
|
($299,218
|
)
|
($176,972
|
)
|
($61,901
|
)
|
($14,807
|
)
|
$183,267
|
|
$55,530
|
|
| |
Minus Fair
Value at the End of the Prior Year of Equity Awards that Failed to Meet Vesting Conditions
in the Covered Year
|
|
-
|
|
-
|
|
-
|
|
$323,203
|
|
-
|
|
-
|
|
-
|
|
-
|
|
-
|
|
-
|
|
| |
|
|
2025
|
|
2024
|
|
2023
|
|
2022
|
|
2021
|
|
| |
|
|
PEO
Myers
|
|
Average
Non-PEO
NEOs
|
|
PEO
Myers
|
|
Average
Non-PEO
NEOs
|
|
PEO
Myers
|
|
Average
Non-PEO
NEOs
|
|
PEO
Wenger
|
|
Average
Non-PEO
NEOs
|
|
PEO
Wenger
|
|
Average
Non-PEO
NEOs
|
|
| |
Plus Value
of Dividends or other Earnings Paid on Stock or Option Awards Prior to the Vesting Date Not
Otherwise Reflected in Total Compensation for the Covered Year
|
|
-
|
|
-
|
|
-
|
|
-
|
|
-
|
|
-
|
|
-
|
|
-
|
|
-
|
|
-
|
|
| |
Compensation
Actually Paid
|
|
$5,733,586
|
|
$1,881,976
|
|
$4,335,378
|
|
$1,073,637
|
|
$2,862,798
|
|
$1,196,969
|
|
$5,537,243
|
|
$1,675,245
|
|
$5,365,077
|
|
$1,745,204
|
|
|
|
|
|
|
| Non-PEO NEO Average Total Compensation Amount |
$ 1,737,331
|
1,178,658
|
999,817
|
1,541,616
|
1,395,455
|
| Non-PEO NEO Average Compensation Actually Paid Amount |
$ 1,881,976
|
1,073,637
|
1,196,969
|
1,675,245
|
1,745,204
|
| Adjustment to Non-PEO NEO Compensation Footnote |
| |
|
|
2025
|
|
2024
|
|
2023
|
|
2022
|
|
2021
|
|
| |
|
|
PEO
Myers
|
|
Average
Non-PEO
NEOs
|
|
PEO
Myers
|
|
Average
Non-PEO
NEOs
|
|
PEO
Myers
|
|
Average
Non-PEO
NEOs
|
|
PEO
Wenger
|
|
Average
Non-PEO
NEOs
|
|
PEO
Wenger
|
|
Average
Non-PEO
NEOs
|
|
| |
Summary
Compensation
Table Total
|
|
$5,184,944
|
|
$1,737,331
|
|
$3,337,831
|
|
$1,178,658
|
|
$2,309,440
|
|
$999,817
|
|
$4,923,557
|
|
$1,541,616
|
|
$4,207,894
|
|
$1,395,455
|
|
| |
Less Stock
Award Value & Option Award Value Reported in
SCT for the
Covered Year
|
|
$2,558,162
|
|
$654,024
|
|
$1,329,526
|
|
$441,951
|
|
$954,757
|
|
$379,503
|
|
$2,076,061
|
|
$462,213
|
|
$1,305,528
|
|
$395,464
|
|
| |
Plus Year
End Fair Value of Equity Awards Granted During the Covered Year that Remain Outstanding and
Unvested as of Last Day of the Covered Year
|
|
$2,998,283
|
|
$667,385
|
|
$1,432,754
|
|
$375,360
|
|
$1,616,090
|
|
$642,375
|
|
$2,517,933
|
|
$552,934
|
|
$1,335,263
|
|
$404,470
|
|
| |
Plus Year
over Year Change in Fair Value as of the Last Day of the Covered Year of Outstanding and
Unvested Equity Awards Granted in Prior Years
|
|
$172,273
|
|
$50,245
|
|
$789,392
|
|
$177,116
|
|
$191,243
|
|
$111,252
|
|
$233,715
|
|
$57,715
|
|
$944,182
|
|
$285,212
|
|
| |
Plus Fair
Value as of Vesting Date of Equity Awards Granted and Vested in the Covered Year
|
|
-
|
|
$98,658
|
|
-
|
|
$80,075
|
|
-
|
|
-
|
|
-
|
|
-
|
|
-
|
|
-
|
|
| |
Plus Year
over Year Change in Fair Value as of the Vesting Date of Equity Awards Granted in Prior Years
that Vested During the Covered Year
|
|
($63,752
|
)
|
($17,618
|
)
|
$104,927
|
|
$27,582
|
|
($299,218
|
)
|
($176,972
|
)
|
($61,901
|
)
|
($14,807
|
)
|
$183,267
|
|
$55,530
|
|
| |
Minus Fair
Value at the End of the Prior Year of Equity Awards that Failed to Meet Vesting Conditions
in the Covered Year
|
|
-
|
|
-
|
|
-
|
|
$323,203
|
|
-
|
|
-
|
|
-
|
|
-
|
|
-
|
|
-
|
|
| |
|
|
2025
|
|
2024
|
|
2023
|
|
2022
|
|
2021
|
|
| |
|
|
PEO
Myers
|
|
Average
Non-PEO
NEOs
|
|
PEO
Myers
|
|
Average
Non-PEO
NEOs
|
|
PEO
Myers
|
|
Average
Non-PEO
NEOs
|
|
PEO
Wenger
|
|
Average
Non-PEO
NEOs
|
|
PEO
Wenger
|
|
Average
Non-PEO
NEOs
|
|
| |
Plus Value
of Dividends or other Earnings Paid on Stock or Option Awards Prior to the Vesting Date Not
Otherwise Reflected in Total Compensation for the Covered Year
|
|
-
|
|
-
|
|
-
|
|
-
|
|
-
|
|
-
|
|
-
|
|
-
|
|
-
|
|
-
|
|
| |
Compensation
Actually Paid
|
|
$5,733,586
|
|
$1,881,976
|
|
$4,335,378
|
|
$1,073,637
|
|
$2,862,798
|
|
$1,196,969
|
|
$5,537,243
|
|
$1,675,245
|
|
$5,365,077
|
|
$1,745,204
|
|
|
|
|
|
|
| Equity Valuation Assumption Difference, Footnote |
In
the table above, the unvested equity values are computed in accordance with ASC Topic 718. For unvested awards subject to performance-based
vesting conditions, the change in equity value is determined based on the probable outcome of such performance-based vesting conditions
as of the last day of the covered year.
|
|
|
|
|
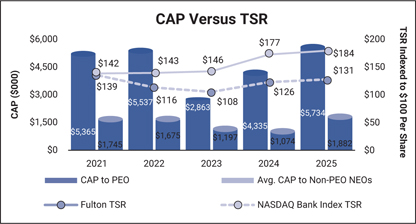
| Compensation Actually Paid vs. Total Shareholder Return |
Relationship
between CAP and TSR. The graph below illustrates the relationship between Fulton’s TSR and the Peer Group TSR as well
as the relationship between TSR and CAP for the PEO and average Non-PEO NEOs.
|
|
|
|
|
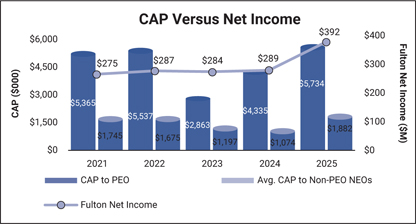
| Compensation Actually Paid vs. Net Income |
Relationship
between CAP and Net Income. The graph below illustrates the relationship between Fulton’s
Net Income and CAP for the PEO and average Non-PEO NEOs.
|
|
|
|
|
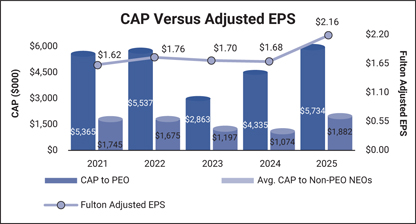
| Compensation Actually Paid vs. Company Selected Measure |
Relationship
between CAP and Adjusted EPS. The graph below illustrates the relationship between Fulton’s
Adjusted EPS and CAP for the PEO and average Non-PEO NEOs.
|
|
|
|
|
| Tabular List, Table |
The
following is a list of performance measures that represent the most important performance measures used by Fulton to link 2025 CAP to
the NEOs to performance:
• | TSR; | • | Adjusted
EPS; | • | Adjusted
ROE; and | • | Adjusted
Operating Expenses/Average Assets. |
|
|
|
|
|
| Total Shareholder Return Amount |
$ 183.57
|
177.10
|
146.02
|
142.98
|
138.94
|
| Peer Group Total Shareholder Return Amount |
131.30
|
125.97
|
107.92
|
115.66
|
142.26
|
| Net Income (Loss) |
$ 392,000,000
|
$ 289,000,000
|
$ 284,000,000
|
$ 287,000,000
|
$ 275,000,000
|
| Company Selected Measure Amount | $ / shares |
2.16
|
1.68
|
1.70
|
1.76
|
1.62
|
| PEO Name |
Mr.
Myers
|
Mr.
Myers
|
Mr.
Myers
|
Mr. Wenger
|
Mr. Wenger
|
| Additional 402(v) Disclosure |
Pursuant
to Section 953(a) of the Dodd-Frank Act and Item 402(v) of Regulation S-K, Fulton is providing the following information about
the relationship between executive compensation actually paid (“CAP”) to Fulton’s principal executive
officer (“PEO”) and non-PEO named executive officers (the “Non-PEO NEOs”) and certain aspects of
the financial performance of Fulton. The HR Committee does not utilize CAP as the basis for making compensation decisions. Please see
the CD&A with respect to additional information with respect to our compensation philosophy and how we align executive compensation
with our performance.
|
|
|
|
|
| Measure [Axis]: 1 |
|
|
|
|
|
| Pay vs Performance Disclosure [Table] |
|
|
|
|
|
| Measure Name |
Adjusted
EPS
|
|
|
|
|
| Non-GAAP Measure Description |
Adjusted
EPS is a Fulton selected measure. Values shown reflect EPS as calculated for purposes of
our executive compensation program for the applicable reporting year as set forth in detail
under “Non-GAAP Reconciliations” in Annex A to this Proxy Statement. No adjustments
to EPS were made for 2021.
|
|
|
|
|
| Measure [Axis]: 2 |
|
|
|
|
|
| Pay vs Performance Disclosure [Table] |
|
|
|
|
|
| Measure Name |
TSR
|
|
|
|
|
| Measure [Axis]: 3 |
|
|
|
|
|
| Pay vs Performance Disclosure [Table] |
|
|
|
|
|
| Measure Name |
Adjusted
ROE
|
|
|
|
|
| Measure [Axis]: 4 |
|
|
|
|
|
| Pay vs Performance Disclosure [Table] |
|
|
|
|
|
| Measure Name |
Adjusted
Operating Expenses/Average Assets
|
|
|
|
|
| Non-PEO NEO [Member] | Stock Award Value & Option Award Value [Member] |
|
|
|
|
|
| Pay vs Performance Disclosure [Table] |
|
|
|
|
|
| Adjustment to Compensation Amount |
$ 654,024
|
$ 441,951
|
$ 379,503
|
$ 462,213
|
$ 395,464
|
| Non-PEO NEO [Member] | Fair Value of Equity Awards Granted that Remain Outstanding and Unvested [Member] |
|
|
|
|
|
| Pay vs Performance Disclosure [Table] |
|
|
|
|
|
| Adjustment to Compensation Amount |
667,385
|
375,360
|
642,375
|
552,934
|
404,470
|
| Non-PEO NEO [Member] | Change in Fair Value of Outstanding and Unvested Equity Awards Granted [Member] |
|
|
|
|
|
| Pay vs Performance Disclosure [Table] |
|
|
|
|
|
| Adjustment to Compensation Amount |
50,245
|
177,116
|
111,252
|
57,715
|
285,212
|
| Non-PEO NEO [Member] | Fair Value of Equity Awards Granted and Vested [Member] |
|
|
|
|
|
| Pay vs Performance Disclosure [Table] |
|
|
|
|
|
| Adjustment to Compensation Amount |
98,658
|
80,075
|
|
|
|
| Non-PEO NEO [Member] | Change in Fair Value of Equity Awards Granted Vested [Member] |
|
|
|
|
|
| Pay vs Performance Disclosure [Table] |
|
|
|
|
|
| Adjustment to Compensation Amount |
(17,618)
|
27,582
|
(176,972)
|
(14,807)
|
55,530
|
| Non-PEO NEO [Member] | Fair Value of Equity Awards that Failed to Meet Vesting Conditions [Member] |
|
|
|
|
|
| Pay vs Performance Disclosure [Table] |
|
|
|
|
|
| Adjustment to Compensation Amount |
|
323,203
|
|
|
|
| Non-PEO NEO [Member] | Value of Dividends or other Earnings Paid on Stock or Option Awards Prior to the Vesting Date Not Otherwise Reflected in Total Compensation [Member] |
|
|
|
|
|
| Pay vs Performance Disclosure [Table] |
|
|
|
|
|
| Adjustment to Compensation Amount |
|
|
|
|
|
| Mr. Myers [Member] | PEO [Member] | Stock Award Value & Option Award Value [Member] |
|
|
|
|
|
| Pay vs Performance Disclosure [Table] |
|
|
|
|
|
| Adjustment to Compensation Amount |
2,558,162
|
1,329,526
|
954,757
|
|
|
| Mr. Myers [Member] | PEO [Member] | Fair Value of Equity Awards Granted that Remain Outstanding and Unvested [Member] |
|
|
|
|
|
| Pay vs Performance Disclosure [Table] |
|
|
|
|
|
| Adjustment to Compensation Amount |
2,998,283
|
1,432,754
|
1,616,090
|
|
|
| Mr. Myers [Member] | PEO [Member] | Change in Fair Value of Outstanding and Unvested Equity Awards Granted [Member] |
|
|
|
|
|
| Pay vs Performance Disclosure [Table] |
|
|
|
|
|
| Adjustment to Compensation Amount |
172,273
|
789,392
|
191,243
|
|
|
| Mr. Myers [Member] | PEO [Member] | Fair Value of Equity Awards Granted and Vested [Member] |
|
|
|
|
|
| Pay vs Performance Disclosure [Table] |
|
|
|
|
|
| Adjustment to Compensation Amount |
|
|
|
|
|
| Mr. Myers [Member] | PEO [Member] | Change in Fair Value of Equity Awards Granted Vested [Member] |
|
|
|
|
|
| Pay vs Performance Disclosure [Table] |
|
|
|
|
|
| Adjustment to Compensation Amount |
(63,752)
|
104,927
|
(299,218)
|
|
|
| Mr. Myers [Member] | PEO [Member] | Fair Value of Equity Awards that Failed to Meet Vesting Conditions [Member] |
|
|
|
|
|
| Pay vs Performance Disclosure [Table] |
|
|
|
|
|
| Adjustment to Compensation Amount |
|
|
|
|
|
| Mr. Myers [Member] | PEO [Member] | Value of Dividends or other Earnings Paid on Stock or Option Awards Prior to the Vesting Date Not Otherwise Reflected in Total Compensation [Member] |
|
|
|
|
|
| Pay vs Performance Disclosure [Table] |
|
|
|
|
|
| Adjustment to Compensation Amount |
|
|
|
|
|
| Mr. Wenger [Member] | PEO [Member] | Stock Award Value & Option Award Value [Member] |
|
|
|
|
|
| Pay vs Performance Disclosure [Table] |
|
|
|
|
|
| Adjustment to Compensation Amount |
|
|
|
2,076,061
|
1,305,528
|
| Mr. Wenger [Member] | PEO [Member] | Fair Value of Equity Awards Granted that Remain Outstanding and Unvested [Member] |
|
|
|
|
|
| Pay vs Performance Disclosure [Table] |
|
|
|
|
|
| Adjustment to Compensation Amount |
|
|
|
2,517,933
|
1,335,263
|
| Mr. Wenger [Member] | PEO [Member] | Change in Fair Value of Outstanding and Unvested Equity Awards Granted [Member] |
|
|
|
|
|
| Pay vs Performance Disclosure [Table] |
|
|
|
|
|
| Adjustment to Compensation Amount |
|
|
|
233,715
|
944,182
|
| Mr. Wenger [Member] | PEO [Member] | Fair Value of Equity Awards Granted and Vested [Member] |
|
|
|
|
|
| Pay vs Performance Disclosure [Table] |
|
|
|
|
|
| Adjustment to Compensation Amount |
|
|
|
|
|
| Mr. Wenger [Member] | PEO [Member] | Change in Fair Value of Equity Awards Granted Vested [Member] |
|
|
|
|
|
| Pay vs Performance Disclosure [Table] |
|
|
|
|
|
| Adjustment to Compensation Amount |
|
|
|
(61,901)
|
183,267
|
| Mr. Wenger [Member] | PEO [Member] | Fair Value of Equity Awards that Failed to Meet Vesting Conditions [Member] |
|
|
|
|
|
| Pay vs Performance Disclosure [Table] |
|
|
|
|
|
| Adjustment to Compensation Amount |
|
|
|
|
|
| Mr. Wenger [Member] | PEO [Member] | Value of Dividends or other Earnings Paid on Stock or Option Awards Prior to the Vesting Date Not Otherwise Reflected in Total Compensation [Member] |
|
|
|
|
|
| Pay vs Performance Disclosure [Table] |
|
|
|
|
|
| Adjustment to Compensation Amount |
|
|
|
|
|