Pay vs Performance Disclosure - USD ($)
Dec. 31, 2025
Dec. 31, 2024
Dec. 31, 2023
Dec. 31, 2022
Dec. 31, 2021
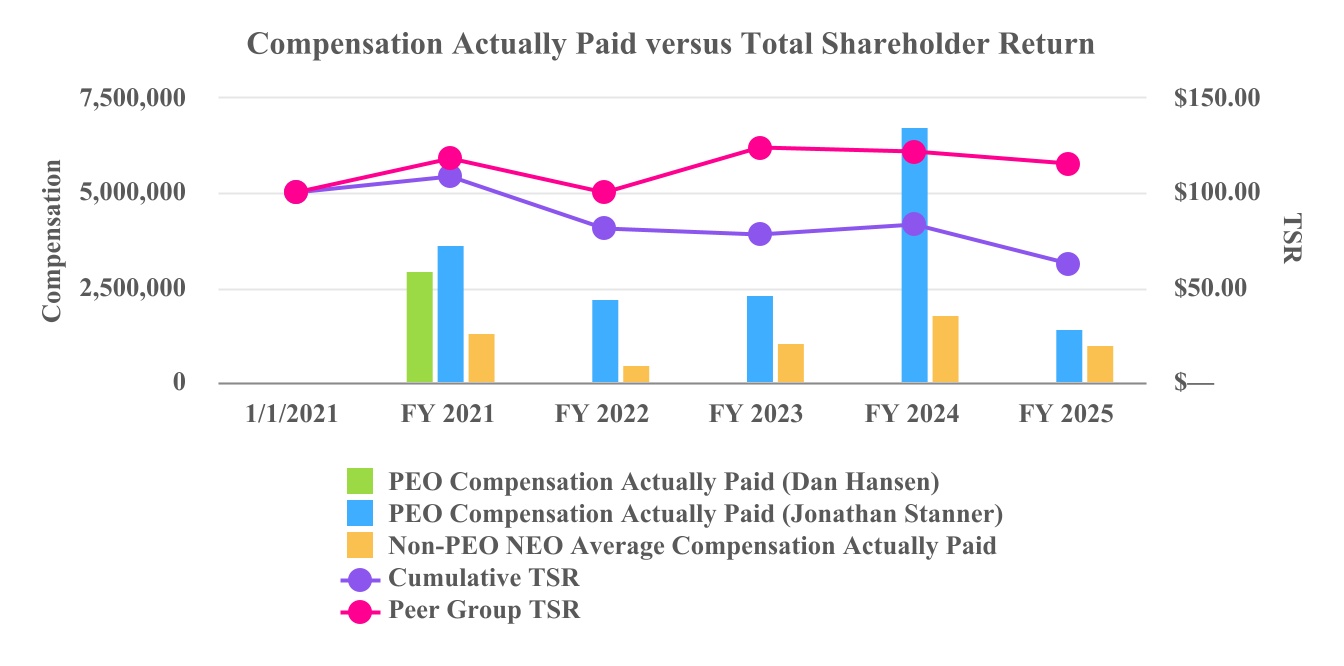
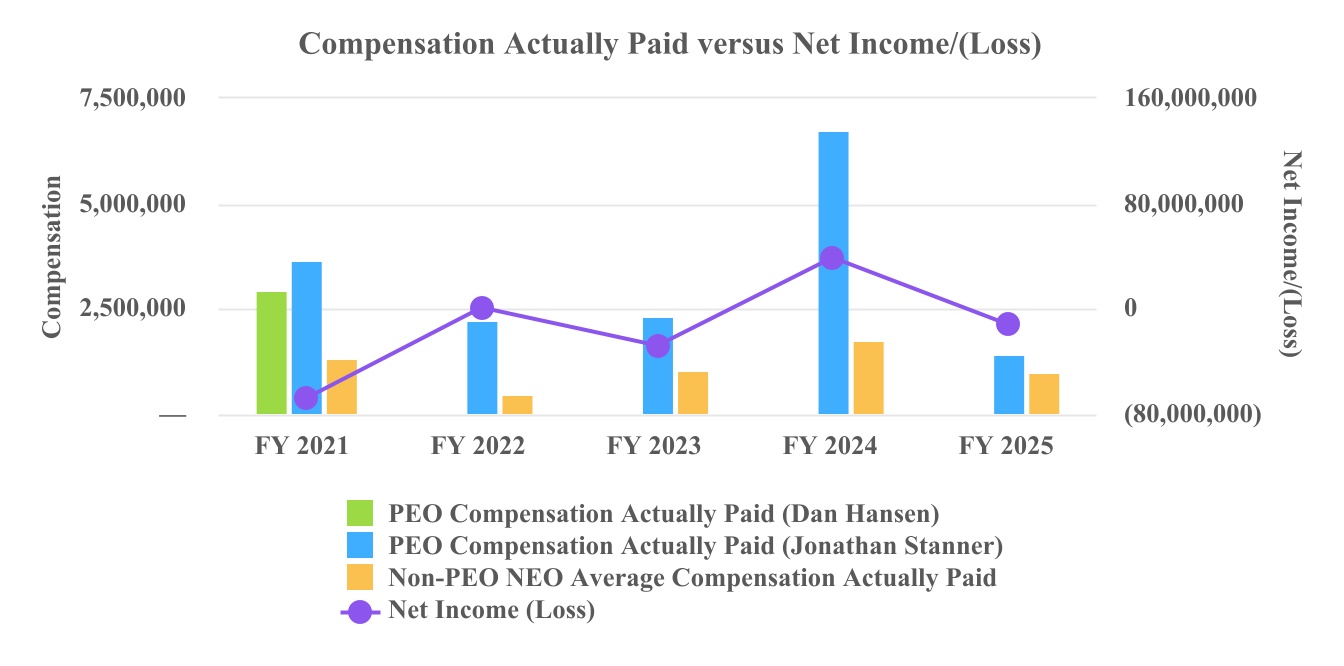
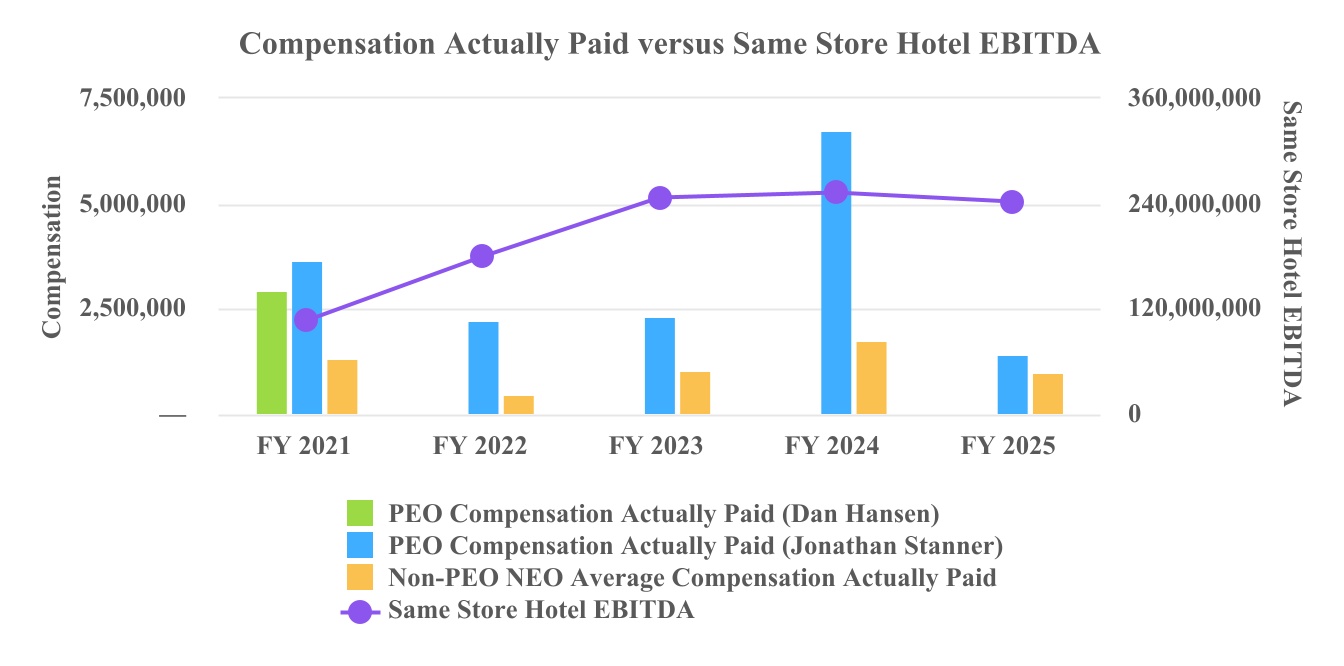
The following table sets forth information concerning the compensation of our NEOs for each of the fiscal years ended December 31, 2021, 2022, 2023, 2024 and 2025, and our financial performance for each such fiscal year:
| (a) | (b) | (bb) | (c) | (cc) | (d) | (e) | (f) | (g) | (h) | (i) | ||||||||||||||||||||||||||||||||||||||||||||||||||||
| Year | Summary Compensation Table Total for PEO (Daniel Hansen) ($) | Summary Compensation Table Total for PEO (Jonathan Stanner) ($) | Compensation Actually Paid to PEO (Daniel Hansen) ($)(1)(2) | Compensation Actually Paid to PEO (Jonathan Stanner) ($)(1)(2) | Average Summary Compensation Table Total for Non-PEO NEOs ($)(1) | Average Compensation Actually Paid to Non-PEO NEOs ($)(1)(2) | Value of Initial Fixed $100 Investment Based on: Total Shareholder Return ($) | Value of Initial Fixed $100 Investment Based on: Peer Group Total Shareholder Return ($)(3) | Net Income (Loss) ($) (in thousands) | Company Selected Measure (Same Store Hotel EBITDA) (in thousands)(4) | ||||||||||||||||||||||||||||||||||||||||||||||||||||
| 2025 | N/A | 5,461,700 | N/A | 1,446,346 | 1,643,778 | 1,004,876 | 62.84 | 115.35 | (11,677) | 241,641 | ||||||||||||||||||||||||||||||||||||||||||||||||||||
| 2024 | N/A | 5,393,317 | N/A | 6,749,702 | 1,591,272 | 1,776,374 | 83.24 | 121.59 | 38,891 | 252,456 | ||||||||||||||||||||||||||||||||||||||||||||||||||||
| 2023 | N/A | 5,652,211 | N/A | 2,346,004 | 1,641,500 | 1,064,556 | 77.88 | 124.07 | (28,116) | 246,743 | ||||||||||||||||||||||||||||||||||||||||||||||||||||
| 2022 | N/A | 5,425,056 | N/A | 2,237,567 | 1,218,111 | 497,241 | 80.88 | 100.12 | 1,217 | 179,563 | ||||||||||||||||||||||||||||||||||||||||||||||||||||
| 2021 | 3,577,809 | 4,932,109 | 2,957,229 | 3,659,557 | 2,011,423 | 1,309,123 | 108.32 | 118.22 | (68,584) | 106,027 | ||||||||||||||||||||||||||||||||||||||||||||||||||||
| Adjustments | PEO | Average Non-PEO NEOs | ||||||||||||
Deduction for Amounts Reported under the “Stock Awards” and “Option Awards” Columns in the Summary Compensation Table for Applicable FY | $ | (3,747,700) | $ | (882,033) | ||||||||||
Increase based on ASC 718 Fair Value of Awards Granted during Applicable FY that Remain Unvested as of Applicable FY End, determined as of Applicable FY End | 1,982,067 | 466,488 | ||||||||||||
Increase/deduction for Awards Granted during Prior FY that were Outstanding and Unvested as of Applicable FY End, determined based on change in ASC 718 Fair Value from Prior FY End to Applicable FY End | (2,925,393) | (374,030) | ||||||||||||
Increase/deduction for Awards Granted during Prior FY that Vested During Applicable FY, determined based on change in ASC 718 Fair Value from Prior FY End to Vesting Date | 474,380 | 105,459 | ||||||||||||
Increase based on Dividends or Other Earnings Paid during Applicable FY prior to Vesting Date | 201,292 | 45,214 | ||||||||||||
TOTAL ADJUSTMENTS | $ | (4,015,354) | $ | (638,902) | ||||||||||