Pay vs Performance Disclosure
Dec. 31, 2025
USD ($)
uSDollarsPerShare
Dec. 31, 2024
USD ($)
uSDollarsPerShare
Dec. 31, 2023
USD ($)
uSDollarsPerShare
Dec. 31, 2022
USD ($)
uSDollarsPerShare
Dec. 31, 2021
USD ($)
uSDollarsPerShare
| Value of Initial Fixed $100 Investment Based On: | ||||||||||||||||||||||||||
| Year | Summary Compensation Table Total for CEO | Compensation Actually Paid to CEO (1) | Average Summary Compensation Table Total for Non-CEO NEOs | Average Compensation Actually Paid to Non-CEO NEOs (1) | Total Stockholder Return | Peer Group Total Stockholder Return (2) | Net Income (in thousands) | Core FFO per Share (3) | ||||||||||||||||||
| 2025 | $ | 14,186,887 | $ | 6,246,134 | $ | 3,672,892 | $ | 1,906,593 | $ | 136.00 | $ | 137.83 | $ | 1,022,538 | $ | 8.21 | ||||||||||
| 2024 | $ | 12,687,241 | $ | 8,075,443 | $ | 3,819,705 | $ | 2,713,241 | $ | 149.33 | $ | 133.97 | $ | 900,232 | $ | 8.12 | ||||||||||
| 2023 | $ | 12,280,701 | $ | 13,297,537 | $ | 3,621,950 | $ | 3,779,198 | $ | 153.60 | $ | 123.21 | $ | 850,453 | $ | 8.10 | ||||||||||
| 2022 | $ | 11,628,744 | $ | 821,731 | $ | 2,946,484 | $ | 927,072 | $ | 135.02 | $ | 108.34 | $ | 921,156 | $ | 8.44 | ||||||||||
| 2021 | $ | 7,315,982 | $ | 30,315,331 | $ | 1,823,862 | $ | 5,938,587 | $ | 200.95 | $ | 143.24 | $ | 877,758 | $ | 6.91 | ||||||||||
| Year | CEO | Non-CEO NEOs (a) | ||||||
| 2025 | Joseph D. Margolis | Jeff Norman, Scott Stubbs, Zach Dickens, Samrat Sondhi and Noah Springer | ||||||
| 2024 | Joseph D. Margolis | Scott Stubbs, Zach Dickens, Samrat Sondhi and Noah Springer | ||||||
| 2023 | Joseph D. Margolis | Scott Stubbs, Zach Dickens, Samrat Sondhi and Noah Springer | ||||||
| 2022 | Joseph D. Margolis | Scott Stubbs, Gwyn G. McNeal, Samrat Sondhi and Noah Springer | ||||||
| 2021 | Joseph D. Margolis | Scott Stubbs, Matthew T. Herrington, Gwyn G. McNeal and Samrat Sondhi | ||||||
The amounts reported in the “Compensation Actually Paid to CEO” and “Average Compensation Actually Paid to Non-CEO NEOs” columns do not reflect the actual compensation paid to or realized by our CEO or our non-CEO NEOs during each applicable year. The calculation of compensation actually paid for purposes of this table includes point-in-time fair values of stock awards, and these values will fluctuate based on our stock price, various accounting valuation assumptions and projected performance related to our performance awards. See the Summary Compensation Table for certain other compensation of our CEO and our non-CEO NEOs for each applicable fiscal year and the Options Exercised, Stock Vested and 2023 PSUs Vested table for the value realized by each of them upon the vesting of stock awards during 2025.
To calculate the amounts in the compensation actually paid to our CEO and the average for the other NEOs in the table above, the following amounts were deducted from and added to (as applicable) the "total" compensation as reported in the Summary Compensation Table:
| 2025 | 2024 | 2023 | 2022 | 2021 | ||||||||||||||||||||||||||||||||||||||||
| Adjustments | CEO | Average for Non-CEO NEOs | CEO | Average for Non-CEO NEOs | CEO | Average for Non-CEO NEOs | CEO | Average for Non-CEO NEOs | CEO | Average for Non-CEO NEOs | ||||||||||||||||||||||||||||||||||
| Deduction for Amounts Reported under the “Stock Awards” Column in the Summary Compensation Table | $ | (11,138,715) | $ | (2,458,631) | $ | (9,649,642) | $ | (2,655,156) | $ | (9,059,042) | $ | (2,522,752) | $ | (8,024,201) | $ | (1,691,600) | $ | (4,278,669) | $ | (805,726) | ||||||||||||||||||||||||
| Increase based on ASC 718 Fair Value of Awards Granted during Applicable FY that Remain Unvested as of Applicable FY End, determined as of Applicable FY End | 9,432,899 | 2,088,495 | 9,739,646 | 2,679,931 | 8,801,236 | 2,450,949 | 5,935,053 | 1,258,891 | 11,965,824 | 2,253,324 | ||||||||||||||||||||||||||||||||||
| Increase/(Deduction) for Awards Granted during Prior FY that were Outstanding and Unvested as of Applicable FY End, determined based on change in ASC 718 Fair Value from Prior FY End to Applicable FY End | (6,276,491) | (1,404,539) | (4,508,614) | (1,092,394) | 1,090,112 | 191,883 | (8,330,837) | (1,512,653) | 15,273,519 | 2,663,506 | ||||||||||||||||||||||||||||||||||
| Increase/(Deduction) for Awards Granted during Prior FY that Vested During Applicable FY, determined based on change in ASC 718 Fair Value from Prior FY End to Vesting Date | 41,554 | 8,376 | (193,188) | (38,845) | 184,530 | 37,168 | (387,028) | (74,050) | 38,676 | 3,620 | ||||||||||||||||||||||||||||||||||
| Total Adjustments | $ | (7,940,753) | $ | (1,766,299) | $ | (4,611,798) | $ | (1,106,464) | $ | 1,016,836 | $ | 157,248 | $ | (10,807,013) | $ | (2,019,412) | $ | 22,999,350 | $ | 4,114,724 | ||||||||||||||||||||||||
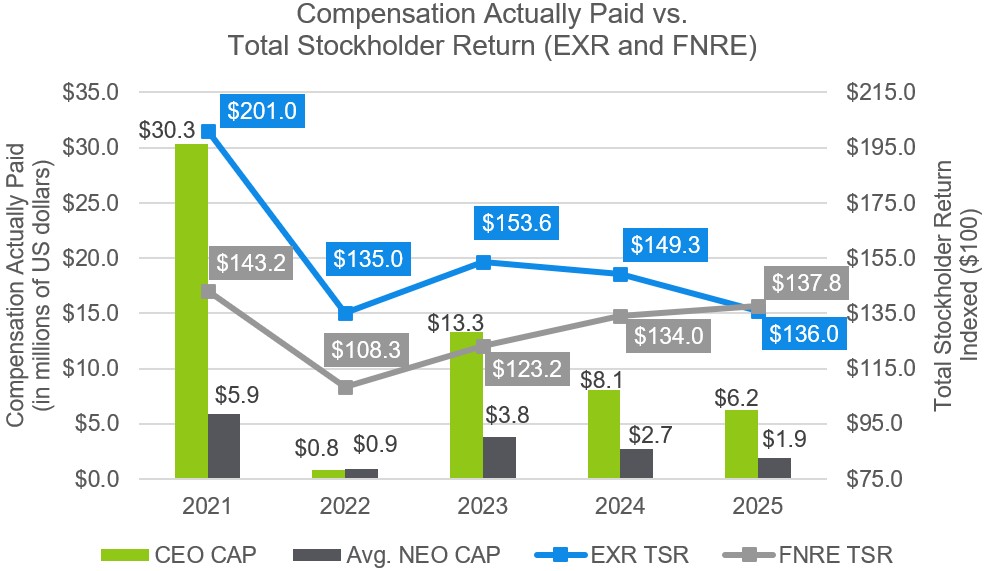
The graphs below compare the compensation actually paid to our CEO and the average of the compensation actually paid to our remaining CEOs, with our cumulative TSR, our peer group TSR, our net income, and our Core FFO per Share, which is our Company Selected Measure, in each case, for the fiscal years ended December 31, 2021, 2022, 2023, 2024,and 2025.
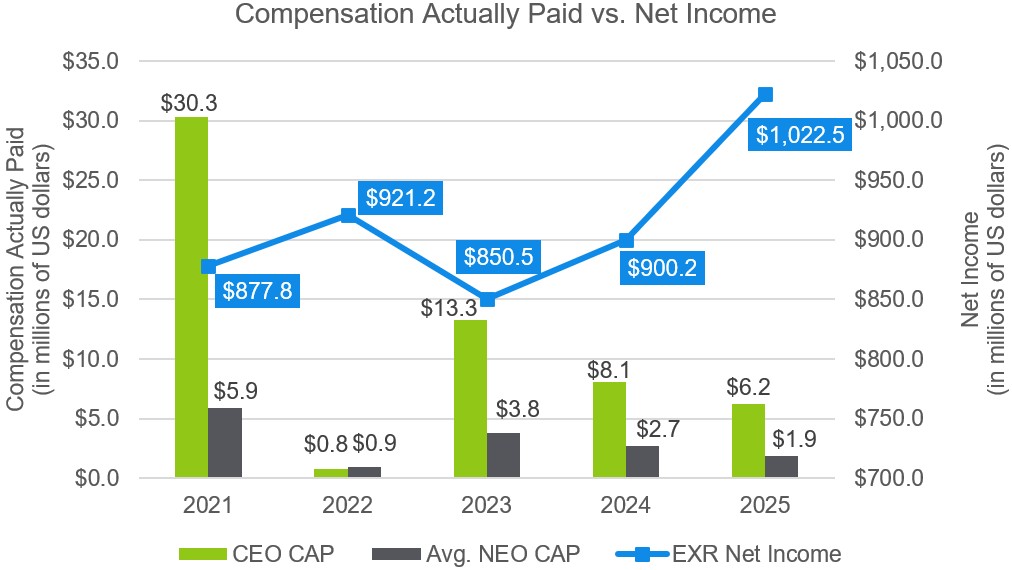
The graphs below compare the compensation actually paid to our CEO and the average of the compensation actually paid to our remaining CEOs, with our cumulative TSR, our peer group TSR, our net income, and our Core FFO per Share, which is our Company Selected Measure, in each case, for the fiscal years ended December 31, 2021, 2022, 2023, 2024,and 2025.
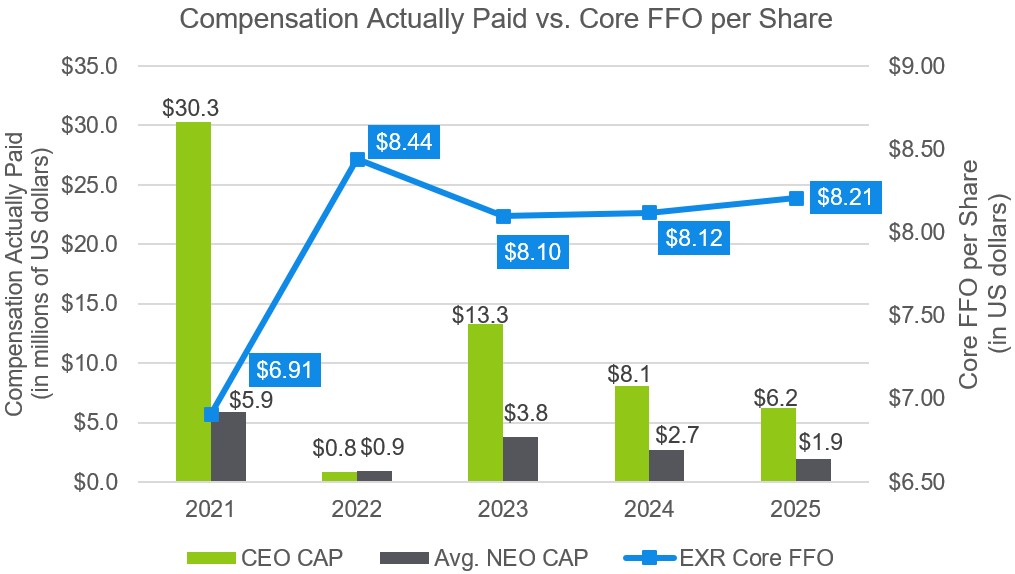
The graphs below compare the compensation actually paid to our CEO and the average of the compensation actually paid to our remaining CEOs, with our cumulative TSR, our peer group TSR, our net income, and our Core FFO per Share, which is our Company Selected Measure, in each case, for the fiscal years ended December 31, 2021, 2022, 2023, 2024,and 2025.
The graphs below compare the compensation actually paid to our CEO and the average of the compensation actually paid to our remaining CEOs, with our cumulative TSR, our peer group TSR, our net income, and our Core FFO per Share, which is our Company Selected Measure, in each case, for the fiscal years ended December 31, 2021, 2022, 2023, 2024,and 2025.
| Financial Performance Measures | ||
| Core FFO per Share | ||
| Relative Total Stockholder Return Ranking to the S&P 500 REITs (plus publicly traded storage REITs) | ||
| Same-Store Property Net Operating Income | ||
Adjustments include the following assumptions used to calculate the fair value of the awards at each valuation date in accordance with ASC 718:
For awards of restricted stock, adjustments reflected are based on the fair value of the awards as of the applicable valuation date calculated by multiplying the change in stock price at each fiscal year end presented by the number of shares of restricted stock outstanding on such valuation date.
For the PSUs that are tied to Core FFO per Share, adjustments reflected are based on the fair value of the awards as of the applicable valuation date calculated by multiplying the stock price at each fiscal year end by the number of PSUs outstanding and by the estimated probability of achieving the performance target that was used to calculate our ASC 718 expense for each fiscal year.
For the PSUs that are tied to relative total stockholder return and calculated in accordance with ASC718 using a Monte Carlo simulation, the adjustments reflected used the following valuation assumptions in order to calculate the fair value as of each fiscal year end (which is also the vesting date for those PSUs that vest based on the three-year period ending at such fiscal year end). Under the terms of the PSUs, dividends for the entire measurement period are paid in cash when the shares are released (and disclosed in the “All Other Compensation” column of the Summary Compensation Table for the year in which such dividends are paid), so the dividend yield was assumed to be 0%.
| Valuation Assumptions | ||||||||||||||
| As of December 31, | PSU-TSR Award Granted | Risk-free rate | Volatility | Expected term (in years) | ||||||||||
| 2025 | March 2025 | 3.4 | % | 25.8 | % | 2 | ||||||||
| 2025 | March 2024 | 3.5 | % | 26.0 | % | 1 | ||||||||
| 2024 | March 2024 | 4.2 | % | 28.8 | % | 2 | ||||||||
| 2025 | March 2023 | N/A | N/A | 0 | ||||||||||
| 2024 | March 2023 | 4.1 | % | 25.7 | % | 1 | ||||||||
| 2023 | March 2023 | 4.2 | % | 32.8 | % | 2 | ||||||||
For additional information about the assumptions used to value our equity awards, please see the notes to the financial statements in our Annual Report on Form 10-K for the year ended December 31, 2025, filed with the SEC on February 20, 2026, and our Annual Report on Form 10-K for prior years.
PAY-FOR-PERFORMANCE ALIGNMENT
The following table identifies the three most important financial performance measures used by our Compensation and Human Capital Committee to link the compensation for our CEO and other NEOs in 2025, to Company performance. The majority of executive compensation was weighted toward long-term performance and time-based awards, and the metrics used to determine our performance based awards is Core FFO per Share and relative total stockholder return ranking. For the non-equity incentive plan awards, the primary performance measure used is same-store property net operating income.