Pay vs Performance Disclosure
Dec. 31, 2025
USD ($)
Dec. 31, 2024
USD ($)
Dec. 31, 2023
USD ($)
Dec. 31, 2022
USD ($)
Dec. 31, 2021
USD ($)
Pay Versus Performance
As required by the Dodd-Frank Act and Item 402(v) of Regulation S-K, the Pay Versus Performance disclosure that follows provides information about the relationship between (i) Compensation Actually Paid, as calculated in accordance with Item 402(v) of Regulation S-K (“CAP”) to our Principal Executive Officer (“PEO”) and non-PEO NEOs, and (ii) certain financial performance measures of the Company. The Compensation Committee did not consider the pay versus performance disclosure below in making its compensation decisions for any of the years shown. For further information concerning TrustCo’s pay-for-performance philosophy and how the Company aligns executive compensation with performance, please see the Compensation Discussion and Analysis beginning on page 26 of this proxy statement.
Value of Initial Fixed $100 Investment Based On: | ||||||||||||||||||||||||||
Year | Summary Compensation Total for PEO(1)(2) ($) | Compensation Actually Paid to PEO(3) ($) | Average Summary Compensation Table Total for Non-PEO Named Executive Officers(4) ($) | Average Compensation Actually Paid to Non-PEO Named Executive Officers(5) ($) | Total Shareholder Return(6) ($) | Peer Group Total Shareholder Return(7) ($) | Net Income (in thousands)(8) ($) | ROAA(9) (%) | ||||||||||||||||||
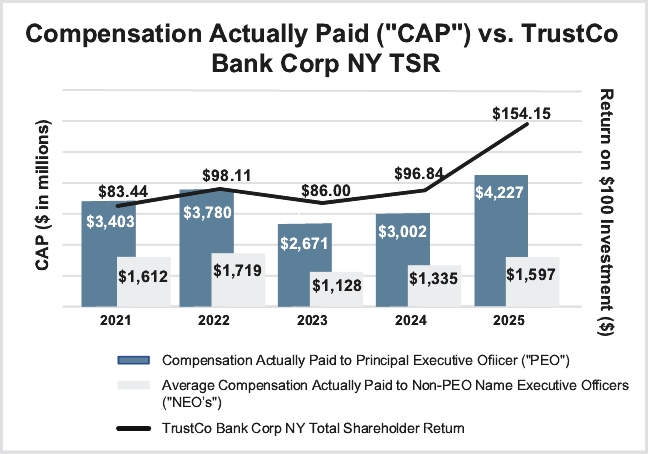
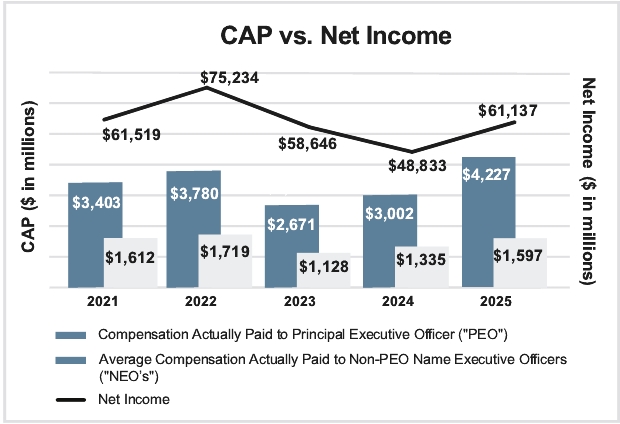
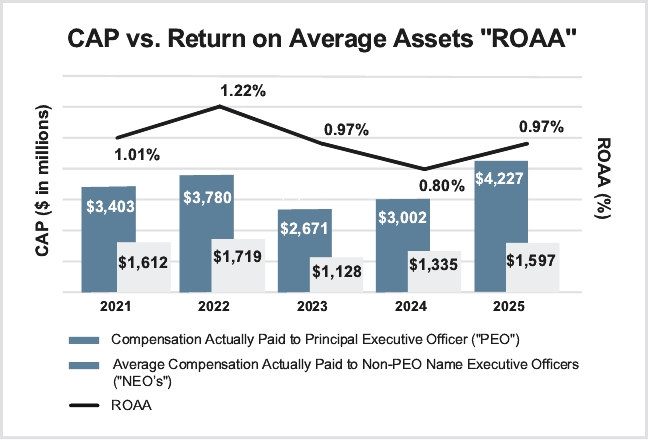
2025 | 3,646,851 | 4,226,690 | 1,443,018 | 1,597,219 | 154.15 | 145.06 | 61,137 | 0.97% | ||||||||||||||||||
2024 | 2,853,652 | 3,002,875 | 1,290,362 | 1,335,359 | 96.84 | 138.72 | 48,833 | 0.80 | ||||||||||||||||||
2023 | 3,060,935 | 2,670,974 | 1,275,501 | 1,128,333 | 86.00 | 121.01 | 58,646 | 0.97 | ||||||||||||||||||
2022 | 3,354,577 | 3,780,453 | 1,559,192 | 1,719,234 | 98.11 | 120.97 | 75,234 | 1.22 | ||||||||||||||||||
2021 | 3,184,330 | 3,402,912 | 1,464,713 | 1,612,100 | 83.44 | 134.24 | 61,519 | 1.01 | ||||||||||||||||||
(1) | The PEO for each year presented was Mr. McCormick, our Chairman, President and CEO. The individuals comprising the Non- PEO NEOs for each year presented are listed below: |
2025 | 2024 | 2023 | 2022 | 2021 | ||||||||||
Michael M. Ozimek | Michael M. Ozimek | Michael M. Ozimek | Michael M. Ozimek | Michael M. Ozimek | ||||||||||
Robert M. Leonard | Robert M. Leonard | Robert M. Leonard | Robert M. Leonard | Robert M. Leonard | ||||||||||
Kevin M. Curley | Kevin M. Curley | Kevin M. Curley | Kevin M. Curley | Kevin M. Curley | ||||||||||
Michael Hall | Scott Salvador | Scott Salvador | Scott Salvador | Scott Salvador | ||||||||||
(2) | The amounts reported in this column reflect the total compensation reported for Mr. McCormick for each corresponding year in the “‘Total” column of the Summary Compensation Table. Refer to the Executive Compensation Payments and Awards – 2025 Summary Compensation Table. |
(3) | The amounts reported in this column represent the amount of Compensation Actually Paid to Mr. McCormick, as computed in accordance with Item 402(v) of Regulation S-K. The amounts do not reflect the actual amount of compensation earned by, or paid to, Mr. McCormick during the applicable year. In accordance with the requirements of Item 402(v) of Regulation S-K, the following adjustments were made to Mr. McCormick’s total compensation for each year to determine the Compensation Actually Paid: |
Principal Executive Officer – Compensation Adjustments | ||||||||||||||||||||
Years | Reported Summary Compensation Table Total for PEO ($) | Reported Value of Equity Awards(a) ($) | Aggregate Equity Award Adjustments(b) ($) | Reported Change in the Actuarial Present Value of Pension Benefits(c) ($) | Aggregate Pension Benefits(d) ($) | Compensation Actually Paid to PEO ($) | ||||||||||||||
2025 | 3,646,851 | (975,022) | 1,580,719 | (25,858) | — | 4,226,690 | ||||||||||||||
2024 | 2,853,652 | (950,021) | 1,099,244 | — | — | 3,002,875 | ||||||||||||||
2023 | 3,060,935 | (999,995) | 640,268 | (30,234) | — | 2,670,974 | ||||||||||||||
2022 | 3,354,577 | (725,004) | 1,150,880 | — | — | 3,780,453 | ||||||||||||||
2021 | 3,184,330 | (875,026) | 1,093,608 | — | — | 3,402,912 | ||||||||||||||
(a) | The reported value of equity awards represents the grant date fair value of equity awards as reported in the “Stock Awards” column in the Summary Compensation Table for the applicable year. The Company has not granted any option awards since 2015. |
(b) | The equity award adjustments for each applicable year include the addition (or subtraction, as applicable) of the following: (i) the year-end fair value of any equity awards granted in the applicable year that are outstanding and unvested as of the end of the year; (ii) the amount of change in fair value as of the end of the applicable year (from the end of the prior fiscal year) of any awards granted in prior years that are outstanding and unvested as of the end of the applicable year; (iii) for awards that are granted and vest in the same applicable year, the fair value as of the vesting date; (iv) for awards granted in prior years that vest in the applicable year, the amount equal to the change in fair value as of the vesting date (from the end of the prior fiscal year); (v) for awards granted in prior years that are determined to fail to meet the applicable vesting conditions during the applicable year, a deduction for the amount equal to the fair value at the end of the prior fiscal year; and (vi) the dollar value of any dividends or other earnings paid on stock or option awards in the applicable year prior to the vesting date that are not otherwise reflected in the fair value of such award or included in any other component of total compensation for the applicable year. The valuation assumptions used to calculate fair values did not materially differ from those disclosed at the time of the grant. The amounts deducted or added in calculating the equity award adjustments are as follows: |
Principal Executive Officer – Equity Adjustments | |||||||||||||||||||||||
Years | Year End Fair Value of Equity Awards Granted in the Year ($) | Year Over Year Change in Fair Value of Outstanding and Unvested Equity Awards ($) | Fair Value as of Vesting Date of Equity Awards Granted and Vested in the Year ($) | Year Over Year Change in Fair Value of Equity Awards Granted in Prior Years that Vested in the Year ($) | Fair Value at the End of the Prior Year of Equity Awards that Failed to Meet Vesting Conditions in the Year ($) | Value of Dividends or Other Earnings Paid on Stock or Option Awards not Otherwise Reflected in Fair Value or Total Compensation ($) | Aggregate Equity Award Adjustments ($) | ||||||||||||||||
2025 | 1,026,431 | 366,089 | — | 188,199 | — | — | 1,580,719 | ||||||||||||||||
2024 | 870,091 | 99,578 | — | 129,575 | — | — | 1,099,244 | ||||||||||||||||
2023 | 1,080,354 | (232,334) | — | (207,752) | — | — | 640,268 | ||||||||||||||||
2022 | 716,427 | 197,933 | — | 236,520 | — | — | 1,150,880 | ||||||||||||||||
2021 | 863,362 | 228,725 | — | 1,521 | — | — | 1,093,608 | ||||||||||||||||
(c) | The amounts in this column represent the amounts reported in “Change in Pension and Nonqualified Deferred Compensation” column of the Summary Compensation Table for each applicable year. |
(d) | No adjustment for pension benefits is included in the table above. |
(4) | The amounts in this column represent the average of the amounts reported for the Company’s NEOs as a group (excluding Mr. McCormick) in the “Total” column of the Summary Compensation Table in each applicable year. |
(5) | The amounts in this column represent the average amount of Compensation Actually Paid to the NEOs as a group (excluding Mr. McCormick), as computed in accordance with Item 402(v) of Regulation S-K. The amounts do not reflect the actual average amount of compensation earned or paid to the NEOs as a group (excluding Mr. McCormick) during the applicable year. In accordance with the requirements of Item 402(v) of Regulation S-K, the following adjustments were made to average total compensation for the NEOs as a group (excluding Mr. McCormick) for each year to determine the average Compensation Actually Paid, using the same methodology described above in Footnote 3. |
Non-PEO Named Executive Officers – Compensation Adjustments | ||||||||||||||||||||
Years | Average Reported Summary Compensation Table Total for Non-PEO NEOs ($) | Average Reported Value of Equity Awards ($) | Average Equity Award Adjustments(a) ($) | Average Reported Change in the Actuarial Present Value of Pension Benefits ($) | Average Pension Benefit Adjustments(b) ($) | Average Compensation Actually Paid to Non -PEO NEOs ($) | ||||||||||||||
2025 | 1,443,018 | (312,520) | 470,640 | (8,444) | 4,525 | 1,597,219 | ||||||||||||||
2024 | 1,290,362 | (225,012) | 265,602 | — | 4,407 | 1,335,359 | ||||||||||||||
2023 | 1,275,501 | (193,762) | 59,753 | (15,883) | 2,724 | 1,128,333 | ||||||||||||||
2022 | 1,559,192 | (275,027) | 430,930 | — | 4,139 | 1,719,234 | ||||||||||||||
2021 | 1,464,713 | (275,026) | 358,694 | — | 63,719 | 1,612,100 | ||||||||||||||
(a) | The amounts deducted or added in calculating the equity award adjustments are as follows: |
Non-PEO Named Executive Officers – Equity Adjustments | |||||||||||||||||||||||
Year | Average Year End Fair Value of Equity Awards Granted in the Year ($) | Year Over Year Average Change in Fair Value of Outstanding and Unvested Equity Awards ($) | Average Fair Value as of Vesting Date of Equity Awards Granted and Vested in the Year ($) | Year over Year Average Change in Fair Value of Equity Awards Granted in Prior Years that Vested in the Year ($) | Average Fair Value at the End of the Prior Year of Equity Awards that Failed to Meet Vesting Conditions in the Year ($) | Average Value of Dividends or Other Earnings Paid on Stock or Option Awards not Otherwise Reflected in Fair Value or Total Compensation ($) | Total Average Equity Award Adjustments ($) | ||||||||||||||||
2025 | 328,997 | 93,312 | — | 48,331 | — | — | 470,640 | ||||||||||||||||
2024 | 206,081 | 25,993 | — | 33,528 | — | — | 265,602 | ||||||||||||||||
2023 | 222,085 | (80,057) | — | (82,275) | — | — | 59,753 | ||||||||||||||||
2022 | 271,776 | 68,828 | — | 90,326 | — | — | 430,930 | ||||||||||||||||
2021 | 271,360 | 86,753 | — | 581 | — | — | 358,694 | ||||||||||||||||
(b) | The amounts deducted or added in calculating the pension benefit adjustments are as follows: |
Year | Non-PEO Named Executive Officers – Pension Adjustments | Total Average Pension Benefit Adjustments ($) | |||||||||
Average Service Cost ($) | Average Prior Service Cost ($) | ||||||||||
2025 | 4,525 | — | 4,525 | ||||||||
2024 | 4,407 | — | 4,407 | ||||||||
2023 | 2,724 | — | 2,724 | ||||||||
2022 | 4,139 | — | 4,139 | ||||||||
2021 | 14,431 | 49,288 | 63,719 | ||||||||
(6) | Cumulative Total Shareholder Return (“TSR”) is calculated by dividing the sum of the cumulative amount of dividends for the measurement period, assuming dividend reinvestment, and the difference between the Company’s share price at the end of the measurement period versus the beginning of the measurement period. “Measurement period” is defined as: for 2021, the one-year period from market close on December 31, 2020 through December 31, 2021; for 2022, the two-year period from market close on December 31, 2020 through December 31, 2022; for 2023, the three-year period from market close on December 31, 2020 through December 31, 2023; for 2024, the four-year period from market close on December 31, 2020 through December 31, 2024; and for 2025, the five-year period from market close on December 31, 2020 through December 31, 2025. |
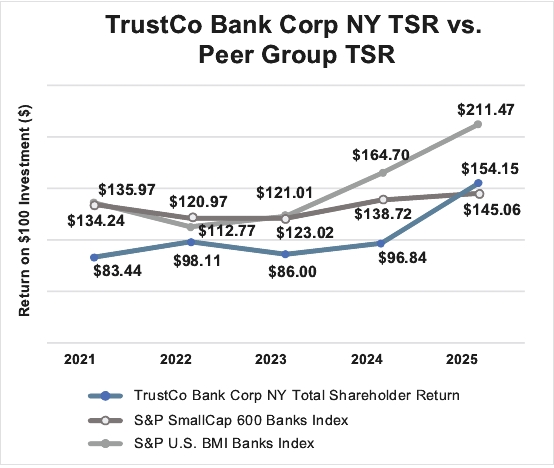
(7) | Represents the weighted peer group TSR, weighted according to the respective companies’ stock market capitalization at the beginning of each measurement period for which a return is indicated. The peer group used for this purpose is the following published industry index: S&P Small Cap 600 Banks Index, the same benchmark we used in the Stock Performance Graph in Exhibit 13 of our Annual Report on Form 10-K for the year ended December 31, 2025. Prior to 2025, the TSR peer group reflected the S&P Global BMI Banks Index. We have instead selected the S&P Small Cap 600 Banks Index because we think it is more representative of companies that we view as our peers for comparison, benchmarking, and other purposes. Had we used the values for the S&P Global BMI Banks Index for peer group TSR, the values would have been: 2021= $135.97; |
2022 = $112.77; 2023 = $123.02; 2024 = $164.70; and 2025 = $211.47. “Measurement period” is defined as: for 2021, the one-year period from market close on December 31, 2020 through December 31, 2021; for 2022, the two-year period from market close on December 31, 2020 through December 31, 2022; for 2023, the three-year period from market close on December 31, 2020 through December 31, 2024; for 2024, the four-year period from market close on December 31, 2020 through December 31, 2024, and for 2025, the five-year period from market close on December 31, 2020 through December 31, 2025.
(8) | The dollar amounts reported represent the amount of net income reflected in the Company’s audited financial statements for the applicable year. |
(9) | For each applicable year, ROAA is defined as that year’s net income as a percentage of average total assets for such year. While TrustCo uses numerous financial and non-financial performance measures for the purpose of evaluating performance for the Company’s compensation programs, TrustCo has determined that ROAA is the financial performance measure that, in the Company’s assessment, represents the most important performance measure (that is not otherwise required to be disclosed in the table) used to link Compensation Actually Paid to the Company’s NEO’s, for the most recently completed fiscal year, to Company performance. |
(1) | The PEO for each year presented was Mr. McCormick, our Chairman, President and CEO. The individuals comprising the Non- PEO NEOs for each year presented are listed below: |
2025 | 2024 | 2023 | 2022 | 2021 | ||||||||||
Michael M. Ozimek | Michael M. Ozimek | Michael M. Ozimek | Michael M. Ozimek | Michael M. Ozimek | ||||||||||
Robert M. Leonard | Robert M. Leonard | Robert M. Leonard | Robert M. Leonard | Robert M. Leonard | ||||||||||
Kevin M. Curley | Kevin M. Curley | Kevin M. Curley | Kevin M. Curley | Kevin M. Curley | ||||||||||
Michael Hall | Scott Salvador | Scott Salvador | Scott Salvador | Scott Salvador | ||||||||||
(7) | Represents the weighted peer group TSR, weighted according to the respective companies’ stock market capitalization at the beginning of each measurement period for which a return is indicated. The peer group used for this purpose is the following published industry index: S&P Small Cap 600 Banks Index, the same benchmark we used in the Stock Performance Graph in Exhibit 13 of our Annual Report on Form 10-K for the year ended December 31, 2025. Prior to 2025, the TSR peer group reflected the S&P Global BMI Banks Index. We have instead selected the S&P Small Cap 600 Banks Index because we think it is more representative of companies that we view as our peers for comparison, benchmarking, and other purposes. Had we used the values for the S&P Global BMI Banks Index for peer group TSR, the values would have been: 2021= $135.97; |
2022 = $112.77; 2023 = $123.02; 2024 = $164.70; and 2025 = $211.47. “Measurement period” is defined as: for 2021, the one-year period from market close on December 31, 2020 through December 31, 2021; for 2022, the two-year period from market close on December 31, 2020 through December 31, 2022; for 2023, the three-year period from market close on December 31, 2020 through December 31, 2024; for 2024, the four-year period from market close on December 31, 2020 through December 31, 2024, and for 2025, the five-year period from market close on December 31, 2020 through December 31, 2025.
(3) | The amounts reported in this column represent the amount of Compensation Actually Paid to Mr. McCormick, as computed in accordance with Item 402(v) of Regulation S-K. The amounts do not reflect the actual amount of compensation earned by, or paid to, Mr. McCormick during the applicable year. In accordance with the requirements of Item 402(v) of Regulation S-K, the following adjustments were made to Mr. McCormick’s total compensation for each year to determine the Compensation Actually Paid: |
Principal Executive Officer – Compensation Adjustments | ||||||||||||||||||||
Years | Reported Summary Compensation Table Total for PEO ($) | Reported Value of Equity Awards(a) ($) | Aggregate Equity Award Adjustments(b) ($) | Reported Change in the Actuarial Present Value of Pension Benefits(c) ($) | Aggregate Pension Benefits(d) ($) | Compensation Actually Paid to PEO ($) | ||||||||||||||
2025 | 3,646,851 | (975,022) | 1,580,719 | (25,858) | — | 4,226,690 | ||||||||||||||
2024 | 2,853,652 | (950,021) | 1,099,244 | — | — | 3,002,875 | ||||||||||||||
2023 | 3,060,935 | (999,995) | 640,268 | (30,234) | — | 2,670,974 | ||||||||||||||
2022 | 3,354,577 | (725,004) | 1,150,880 | — | — | 3,780,453 | ||||||||||||||
2021 | 3,184,330 | (875,026) | 1,093,608 | — | — | 3,402,912 | ||||||||||||||
(a) | The reported value of equity awards represents the grant date fair value of equity awards as reported in the “Stock Awards” column in the Summary Compensation Table for the applicable year. The Company has not granted any option awards since 2015. |
(b) | The equity award adjustments for each applicable year include the addition (or subtraction, as applicable) of the following: (i) the year-end fair value of any equity awards granted in the applicable year that are outstanding and unvested as of the end of the year; (ii) the amount of change in fair value as of the end of the applicable year (from the end of the prior fiscal year) of any awards granted in prior years that are outstanding and unvested as of the end of the applicable year; (iii) for awards that are granted and vest in the same applicable year, the fair value as of the vesting date; (iv) for awards granted in prior years that vest in the applicable year, the amount equal to the change in fair value as of the vesting date (from the end of the prior fiscal year); (v) for awards granted in prior years that are determined to fail to meet the applicable vesting conditions during the applicable year, a deduction for the amount equal to the fair value at the end of the prior fiscal year; and (vi) the dollar value of any dividends or other earnings paid on stock or option awards in the applicable year prior to the vesting date that are not otherwise reflected in the fair value of such award or included in any other component of total compensation for the applicable year. The valuation assumptions used to calculate fair values did not materially differ from those disclosed at the time of the grant. The amounts deducted or added in calculating the equity award adjustments are as follows: |
Principal Executive Officer – Equity Adjustments | |||||||||||||||||||||||
Years | Year End Fair Value of Equity Awards Granted in the Year ($) | Year Over Year Change in Fair Value of Outstanding and Unvested Equity Awards ($) | Fair Value as of Vesting Date of Equity Awards Granted and Vested in the Year ($) | Year Over Year Change in Fair Value of Equity Awards Granted in Prior Years that Vested in the Year ($) | Fair Value at the End of the Prior Year of Equity Awards that Failed to Meet Vesting Conditions in the Year ($) | Value of Dividends or Other Earnings Paid on Stock or Option Awards not Otherwise Reflected in Fair Value or Total Compensation ($) | Aggregate Equity Award Adjustments ($) | ||||||||||||||||
2025 | 1,026,431 | 366,089 | — | 188,199 | — | — | 1,580,719 | ||||||||||||||||
2024 | 870,091 | 99,578 | — | 129,575 | — | — | 1,099,244 | ||||||||||||||||
2023 | 1,080,354 | (232,334) | — | (207,752) | — | — | 640,268 | ||||||||||||||||
2022 | 716,427 | 197,933 | — | 236,520 | — | — | 1,150,880 | ||||||||||||||||
2021 | 863,362 | 228,725 | — | 1,521 | — | — | 1,093,608 | ||||||||||||||||
(c) | The amounts in this column represent the amounts reported in “Change in Pension and Nonqualified Deferred Compensation” column of the Summary Compensation Table for each applicable year. |
(d) | No adjustment for pension benefits is included in the table above. |
(5) | The amounts in this column represent the average amount of Compensation Actually Paid to the NEOs as a group (excluding Mr. McCormick), as computed in accordance with Item 402(v) of Regulation S-K. The amounts do not reflect the actual average amount of compensation earned or paid to the NEOs as a group (excluding Mr. McCormick) during the applicable year. In accordance with the requirements of Item 402(v) of Regulation S-K, the following adjustments were made to average total compensation for the NEOs as a group (excluding Mr. McCormick) for each year to determine the average Compensation Actually Paid, using the same methodology described above in Footnote 3. |
Non-PEO Named Executive Officers – Compensation Adjustments | ||||||||||||||||||||
Years | Average Reported Summary Compensation Table Total for Non-PEO NEOs ($) | Average Reported Value of Equity Awards ($) | Average Equity Award Adjustments(a) ($) | Average Reported Change in the Actuarial Present Value of Pension Benefits ($) | Average Pension Benefit Adjustments(b) ($) | Average Compensation Actually Paid to Non -PEO NEOs ($) | ||||||||||||||
2025 | 1,443,018 | (312,520) | 470,640 | (8,444) | 4,525 | 1,597,219 | ||||||||||||||
2024 | 1,290,362 | (225,012) | 265,602 | — | 4,407 | 1,335,359 | ||||||||||||||
2023 | 1,275,501 | (193,762) | 59,753 | (15,883) | 2,724 | 1,128,333 | ||||||||||||||
2022 | 1,559,192 | (275,027) | 430,930 | — | 4,139 | 1,719,234 | ||||||||||||||
2021 | 1,464,713 | (275,026) | 358,694 | — | 63,719 | 1,612,100 | ||||||||||||||
(a) | The amounts deducted or added in calculating the equity award adjustments are as follows: |
Non-PEO Named Executive Officers – Equity Adjustments | |||||||||||||||||||||||
Year | Average Year End Fair Value of Equity Awards Granted in the Year ($) | Year Over Year Average Change in Fair Value of Outstanding and Unvested Equity Awards ($) | Average Fair Value as of Vesting Date of Equity Awards Granted and Vested in the Year ($) | Year over Year Average Change in Fair Value of Equity Awards Granted in Prior Years that Vested in the Year ($) | Average Fair Value at the End of the Prior Year of Equity Awards that Failed to Meet Vesting Conditions in the Year ($) | Average Value of Dividends or Other Earnings Paid on Stock or Option Awards not Otherwise Reflected in Fair Value or Total Compensation ($) | Total Average Equity Award Adjustments ($) | ||||||||||||||||
2025 | 328,997 | 93,312 | — | 48,331 | — | — | 470,640 | ||||||||||||||||
2024 | 206,081 | 25,993 | — | 33,528 | — | — | 265,602 | ||||||||||||||||
2023 | 222,085 | (80,057) | — | (82,275) | — | — | 59,753 | ||||||||||||||||
2022 | 271,776 | 68,828 | — | 90,326 | — | — | 430,930 | ||||||||||||||||
2021 | 271,360 | 86,753 | — | 581 | — | — | 358,694 | ||||||||||||||||
(b) | The amounts deducted or added in calculating the pension benefit adjustments are as follows: |
Year | Non-PEO Named Executive Officers – Pension Adjustments | Total Average Pension Benefit Adjustments ($) | |||||||||
Average Service Cost ($) | Average Prior Service Cost ($) | ||||||||||
2025 | 4,525 | — | 4,525 | ||||||||
2024 | 4,407 | — | 4,407 | ||||||||
2023 | 2,724 | — | 2,724 | ||||||||
2022 | 4,139 | — | 4,139 | ||||||||
2021 | 14,431 | 49,288 | 63,719 | ||||||||
Financial Performance Measures
The most important financial performance measures used by TrustCo to link Compensation Actually Paid to NEOs for the most recent fiscal year, to the Company’s performance are as follows:
• | Return on Average Assets |
• | Adjusted Efficiency Ratio |
• | Tier 1 Risk-Based Capital Ratio |
• | Return on Average Equity |
• | Earnings per Share |
• | Nonperforming Loans to Total Loans |
(b) | The amounts deducted or added in calculating the pension benefit adjustments are as follows: |
Year | Non-PEO Named Executive Officers – Pension Adjustments | Total Average Pension Benefit Adjustments ($) | |||||||||
Average Service Cost ($) | Average Prior Service Cost ($) | ||||||||||
2025 | 4,525 | — | 4,525 | ||||||||
2024 | 4,407 | — | 4,407 | ||||||||
2023 | 2,724 | — | 2,724 | ||||||||
2022 | 4,139 | — | 4,139 | ||||||||
2021 | 14,431 | 49,288 | 63,719 | ||||||||
(b) | The equity award adjustments for each applicable year include the addition (or subtraction, as applicable) of the following: (i) the year-end fair value of any equity awards granted in the applicable year that are outstanding and unvested as of the end of the year; (ii) the amount of change in fair value as of the end of the applicable year (from the end of the prior fiscal year) of any awards granted in prior years that are outstanding and unvested as of the end of the applicable year; (iii) for awards that are granted and vest in the same applicable year, the fair value as of the vesting date; (iv) for awards granted in prior years that vest in the applicable year, the amount equal to the change in fair value as of the vesting date (from the end of the prior fiscal year); (v) for awards granted in prior years that are determined to fail to meet the applicable vesting conditions during the applicable year, a deduction for the amount equal to the fair value at the end of the prior fiscal year; and (vi) the dollar value of any dividends or other earnings paid on stock or option awards in the applicable year prior to the vesting date that are not otherwise reflected in the fair value of such award or included in any other component of total compensation for the applicable year. The valuation assumptions used to calculate fair values did not materially differ from those disclosed at the time of the grant. The amounts deducted or added in calculating the equity award adjustments are as follows: |
Principal Executive Officer – Equity Adjustments | |||||||||||||||||||||||
Years | Year End Fair Value of Equity Awards Granted in the Year ($) | Year Over Year Change in Fair Value of Outstanding and Unvested Equity Awards ($) | Fair Value as of Vesting Date of Equity Awards Granted and Vested in the Year ($) | Year Over Year Change in Fair Value of Equity Awards Granted in Prior Years that Vested in the Year ($) | Fair Value at the End of the Prior Year of Equity Awards that Failed to Meet Vesting Conditions in the Year ($) | Value of Dividends or Other Earnings Paid on Stock or Option Awards not Otherwise Reflected in Fair Value or Total Compensation ($) | Aggregate Equity Award Adjustments ($) | ||||||||||||||||
2025 | 1,026,431 | 366,089 | — | 188,199 | — | — | 1,580,719 | ||||||||||||||||
2024 | 870,091 | 99,578 | — | 129,575 | — | — | 1,099,244 | ||||||||||||||||
2023 | 1,080,354 | (232,334) | — | (207,752) | — | — | 640,268 | ||||||||||||||||
2022 | 716,427 | 197,933 | — | 236,520 | — | — | 1,150,880 | ||||||||||||||||
2021 | 863,362 | 228,725 | — | 1,521 | — | — | 1,093,608 | ||||||||||||||||
(a) | The amounts deducted or added in calculating the equity award adjustments are as follows: |
Non-PEO Named Executive Officers – Equity Adjustments | |||||||||||||||||||||||
Year | Average Year End Fair Value of Equity Awards Granted in the Year ($) | Year Over Year Average Change in Fair Value of Outstanding and Unvested Equity Awards ($) | Average Fair Value as of Vesting Date of Equity Awards Granted and Vested in the Year ($) | Year over Year Average Change in Fair Value of Equity Awards Granted in Prior Years that Vested in the Year ($) | Average Fair Value at the End of the Prior Year of Equity Awards that Failed to Meet Vesting Conditions in the Year ($) | Average Value of Dividends or Other Earnings Paid on Stock or Option Awards not Otherwise Reflected in Fair Value or Total Compensation ($) | Total Average Equity Award Adjustments ($) | ||||||||||||||||
2025 | 328,997 | 93,312 | — | 48,331 | — | — | 470,640 | ||||||||||||||||
2024 | 206,081 | 25,993 | — | 33,528 | — | — | 265,602 | ||||||||||||||||
2023 | 222,085 | (80,057) | — | (82,275) | — | — | 59,753 | ||||||||||||||||
2022 | 271,776 | 68,828 | — | 90,326 | — | — | 430,930 | ||||||||||||||||
2021 | 271,360 | 86,753 | — | 581 | — | — | 358,694 | ||||||||||||||||