Pay vs Performance Disclosure - USD ($)
Dec. 31, 2025
Dec. 31, 2024
Dec. 31, 2023
Dec. 31, 2022
Dec. 31, 2021
Pay Versus Performance
PAY VERSUS PERFORMANCE TABLE - DEFINITIONS
Salary, Bonus, Non-Equity Incentive Plan Compensation and All Other Compensation are calculated in the same manner for purposes of CAP and the Summary Compensation Table ("SCT"). The primary difference between the calculation of CAP and SCT total compensation relates to stock and option awards. In the SCT, stock and option awards are reflected using the grant date fair value of stock and option awards granted during the year. CAP values reflect the change in fair value of stock and option awards year over year that are unvested as of the end of the year, or vested or were forfeited during the year.
PAY VERSUS PERFORMANCE TABLE
The following table sets forth information concerning the “compensation actually paid” (“CAP”) to our NEOs for each of the fiscal years ended December 2021, 2022, 2023, 2024 and 2025, and our financial performance for each of these fiscal years. “Compensation actually paid” is determined, however, by making certain adjustments pursuant to SEC regulatory requirements and, as a result, does not reflect the compensation earned by or paid to our executive officers during a covered year. For further information concerning the Company’s pay-for-performance philosophy and how the Company aligns executive compensation with the Company’s performance, refer to “Compensation Discussion and Analysis”.
YEAR(1) | SCT TOTAL COMPENSATION FOR CEO ($) | CAP TO CEO ($)(2) | AVERAGE SCT TOTAL COMPENSATION FOR OTHER NEOs ($) | AVERAGE CAP TO OTHER NEOS ($)(2) | CUMULATIVE TSR (BASED ON VALUE OF $100 INVESTMENT) ($) | PEER GROUP CUMULATIVE TSR (BASED ON VALUE OF $100 INVESTMENT) ($)(3) | GAAP NET INCOME (in MILLIONS) ($) | ADJUSTED EBITDA (IN MILLIONS) ($)(4) | ||||||||||||||||||
2025 | 4,167,842 | 2,581,430 | 2,058,193 | 1,431,106 | 1,850.92 | 502.93 | (62) | 122 | ||||||||||||||||||
2024 | 4,945,893 | 2,831,415 | 2,329,983 | 1,111,147 | 1,853.14 | 285.85 | 188 | 408 | ||||||||||||||||||
2023 | 6,053,361 | 32,628,380 | 3,380,078 | 17,569,191 | 3,138.45 | 248.36 | 722 | 1,033 | ||||||||||||||||||
2022 | 11,121,908 | 19,343,862 | 2,625,826 | 11,160,871 | 1,342.32 | 191.60 | 1,449 | 1,741 | ||||||||||||||||||
2021 | 3,549,785 | 5,021,653 | 2,641,391 | 8,435,227 | 536.94 | 153.36 | 289 | 534 | ||||||||||||||||||
(1) | Mr. Eidson was our CEO in fiscal years 2023, 2024 and 2025 and an NEO in fiscal years 2021 and 2022. Our Other NEOs, Messrs. Munsey, Whitehead, Horn, and Manno, served during each disclosed fiscal year except for Mr. Munsey, who was not an NEO in fiscal year 2021, Mr. Horn who was not an NEO in fiscal year 2023, and Mr. Manno who was not an NEO in fiscal years 2021-2023. |
(2) | Refer to table below for amounts deducted from and added to the SCT. Fair values of awards were computed in accordance with Financial Accounting Standards Board (“FASB”) Accounting Standards Codification, (“ASC”) Topic 718, “Compensation-Stock Compensation” (“FASB ASC Topic 718”). Fair values of non-market-based awards were adjusted for actual performance through each fiscal year end. In determining probable payout for these awards, fair value adjustments assume target performance for future fiscal years in which metrics have not yet been established as the metrics are established annually for each year within the applicable 3-year performance period. |
(3) | In 2025, as the result of the merger between Arch Resources, Inc. and CONSOL Energy Inc. in the proxy peer group, these companies were replaced with the merged company name Core Natural Resources, Inc. For the full list of companies included in our 2025 peer group, see “Compensation Disclosure and Analysis”. |
In 2024, Compass Minerals International, Inc. and Commercial Metals Co. were removed from the proxy peer group, primarily due to their company size, revenues and market capitalization. Ryerson Holding Corporation, ATI Inc. and Kaiser Aluminum Corporation were added to the proxy peer group, primarily due to comparable company size, revenues and market capitalization. Schnitzer Steel Industries, Inc. changed its name to Radius Recycling, Inc., TimkenSteel Corp. changed its name to Metallus Inc. and Worthington Industries, Inc. spun off into two companies, one of which was Worthington Steel, Inc. and remained in our proxy peer group. If using the same peer group as 2023, the peer group cumulative TSR (based on the value of a $100 investment) would have been $320.00 in 2024. |
In 2022 and 2023, we made no changes to our proxy peer group as compared to 2021. |
(4) | See “Relationship Between Pay and Adjusted EBITDA” below for further discussion on how Adjusted EBITDA is derived from the audited financials. |
SCT TOTAL ($)(1) | STOCK AWARDS DEDUCTED ($)(2) | STOCK AWARDS ADDED ($)(3)(8) | DIVIDENDS ADDED ($)(4) | STOCK AWARDS GRANTED IN PRIOR YEARS: UNVESTED AS OF FYE ($)(5)(8) | STOCK AWARDS GRANTED IN PRIOR YEARS: VESTED IN CURRENT FY ($)(6)(8) | STOCK AWARDS GRANTED IN PRIOR YEARS: FORFEITED IN CURRENT FY ($)(7)(8) | TOTAL CAP ($) | |||||||||||||||||||
CEO | ||||||||||||||||||||||||||
2025 | 4,167,842 | (2,660,357) | 1,976,640 | — | (774,463) | (128,232) | — | 2,581,430 | ||||||||||||||||||
2024 | 4,945,893 | (2,941,754) | 1,327,415 | — | (5,120,287) | 4,620,148 | — | 2,831,415 | ||||||||||||||||||
2023 | 6,053,361 | (3,172,948) | 6,311,039 | 196,035 | 22,671,129 | 569,764 | — | 32,628,380 | ||||||||||||||||||
2022 | 11,121,908 | (8,049,839) | 12,141,978 | 455,702 | — | 3,674,113 | — | 19,343,862 | ||||||||||||||||||
2021 | 3,549,785 | — | — | — | 5,941,529 | 340,296 | (4,809,957) | 5,021,653 | ||||||||||||||||||
Average Other NEOs | ||||||||||||||||||||||||||
2025 | 2,058,193 | (1,180,238) | 876,983 | — | (267,424) | (56,408) | — | 1,431,106 | ||||||||||||||||||
2024 | 2,329,983 | (1,055,657) | 400,326 | — | (1,645,689) | 1,497,063 | (414,879) | 1,111,147 | ||||||||||||||||||
2023 | 3,380,078 | (1,534,672) | 2,834,884 | 114,542 | 10,364,937 | 2,438,145 | (28,723) | 17,569,191 | ||||||||||||||||||
2022 | 2,625,826 | (1,027,679) | 2,507,722 | 467,703 | 6,406,150 | 181,149 | — | 11,160,871 | ||||||||||||||||||
2021 | 2,641,391 | (1,075,574) | 6,026,247 | — | 821,166 | 21,997 | — | 8,435,227 | ||||||||||||||||||
(1) | Values reflected in this column for the CEO and Average Other NEOs represent the Total Compensation as reported in the Summary Compensation Table (SCT) of the proxy statement for the annual meeting of stockholders in each fiscal year. |
(2) | Values reflected in this column for the CEO and Average Other NEOs represent amounts reported in the Stock Awards and Option Awards columns of the SCT of the proxy statement for the annual meeting of stockholders in each fiscal year, which are deducted from the SCT total in the respective fiscal year. |
(3) | Values reflected in this column for the CEO and Average Other NEOs represent the fair values of equity compensation granted during the respective fiscal year and valued as of such fiscal year end. These amounts are added to the SCT total in the respective fiscal year. |
(4) | Values reflected in this column for the CEO and Average Other NEOs represent any cash dividend equivalents earned on unvested shares during each fiscal year, which are added to the SCT total in the respective fiscal year. These amounts are added to the SCT total in the respective fiscal year. |
(5) | For stock awards granted in prior fiscal years that were unvested at the end of the current fiscal year, the values reflected in this column for the CEO and Average Other NEOs represent the total change in fair value from the end of the prior fiscal year to the end of the current fiscal year. The change in fair value is added or subtracted from the SCT total in the respective fiscal year. |
(6) | For stock awards granted in prior fiscal years that vested during the current fiscal year, the values reflected in this column for the CEO and Average Other NEOs represent the total change in fair value from the end of the prior fiscal year to the vesting date in the current fiscal year. The change in fair value is added or subtracted from the SCT total in the respective fiscal year. |
(7) | For stock awards granted in prior fiscal years that forfeited during the current fiscal year, the values reflected in this column for the CEO and Average Other NEOs represent the fair value of the forfeited awards determined at the end of the prior fiscal year. The fair value is subtracted from the SCT total in the respective fiscal year. |
(8) | The fair values of stock awards added or deducted were computed in accordance with FASB ASC Topic 718. Performance awards with market metrics were remeasured at each fiscal year-end during the vesting period or vesting date using the Monte Carlo Simulation model with variables for volatility, risk free rate and dividend yield. Fair values of non-market-based awards were adjusted for actual performance through each fiscal yearend. In determining probable payout for these awards, fair value adjustments assume target performance for future fiscal years in which metrics have not yet been established as the metrics are established annually for each year within the applicable 3-year performance period. |
(1) | Mr. Eidson was our CEO in fiscal years 2023, 2024 and 2025 and an NEO in fiscal years 2021 and 2022. Our Other NEOs, Messrs. Munsey, Whitehead, Horn, and Manno, served during each disclosed fiscal year except for Mr. Munsey, who was not an NEO in fiscal year 2021, Mr. Horn who was not an NEO in fiscal year 2023, and Mr. Manno who was not an NEO in fiscal years 2021-2023. |
(3) | In 2025, as the result of the merger between Arch Resources, Inc. and CONSOL Energy Inc. in the proxy peer group, these companies were replaced with the merged company name Core Natural Resources, Inc. For the full list of companies included in our 2025 peer group, see “Compensation Disclosure and Analysis”. |
In 2024, Compass Minerals International, Inc. and Commercial Metals Co. were removed from the proxy peer group, primarily due to their company size, revenues and market capitalization. Ryerson Holding Corporation, ATI Inc. and Kaiser Aluminum Corporation were added to the proxy peer group, primarily due to comparable company size, revenues and market capitalization. Schnitzer Steel Industries, Inc. changed its name to Radius Recycling, Inc., TimkenSteel Corp. changed its name to Metallus Inc. and Worthington Industries, Inc. spun off into two companies, one of which was Worthington Steel, Inc. and remained in our proxy peer group. If using the same peer group as 2023, the peer group cumulative TSR (based on the value of a $100 investment) would have been $320.00 in 2024. |
In 2022 and 2023, we made no changes to our proxy peer group as compared to 2021. |
SCT TOTAL ($)(1) | STOCK AWARDS DEDUCTED ($)(2) | STOCK AWARDS ADDED ($)(3)(8) | DIVIDENDS ADDED ($)(4) | STOCK AWARDS GRANTED IN PRIOR YEARS: UNVESTED AS OF FYE ($)(5)(8) | STOCK AWARDS GRANTED IN PRIOR YEARS: VESTED IN CURRENT FY ($)(6)(8) | STOCK AWARDS GRANTED IN PRIOR YEARS: FORFEITED IN CURRENT FY ($)(7)(8) | TOTAL CAP ($) | |||||||||||||||||||
CEO | ||||||||||||||||||||||||||
2025 | 4,167,842 | (2,660,357) | 1,976,640 | — | (774,463) | (128,232) | — | 2,581,430 | ||||||||||||||||||
2024 | 4,945,893 | (2,941,754) | 1,327,415 | — | (5,120,287) | 4,620,148 | — | 2,831,415 | ||||||||||||||||||
2023 | 6,053,361 | (3,172,948) | 6,311,039 | 196,035 | 22,671,129 | 569,764 | — | 32,628,380 | ||||||||||||||||||
2022 | 11,121,908 | (8,049,839) | 12,141,978 | 455,702 | — | 3,674,113 | — | 19,343,862 | ||||||||||||||||||
2021 | 3,549,785 | — | — | — | 5,941,529 | 340,296 | (4,809,957) | 5,021,653 | ||||||||||||||||||
Average Other NEOs | ||||||||||||||||||||||||||
2025 | 2,058,193 | (1,180,238) | 876,983 | — | (267,424) | (56,408) | — | 1,431,106 | ||||||||||||||||||
2024 | 2,329,983 | (1,055,657) | 400,326 | — | (1,645,689) | 1,497,063 | (414,879) | 1,111,147 | ||||||||||||||||||
2023 | 3,380,078 | (1,534,672) | 2,834,884 | 114,542 | 10,364,937 | 2,438,145 | (28,723) | 17,569,191 | ||||||||||||||||||
2022 | 2,625,826 | (1,027,679) | 2,507,722 | 467,703 | 6,406,150 | 181,149 | — | 11,160,871 | ||||||||||||||||||
2021 | 2,641,391 | (1,075,574) | 6,026,247 | — | 821,166 | 21,997 | — | 8,435,227 | ||||||||||||||||||
(1) | Values reflected in this column for the CEO and Average Other NEOs represent the Total Compensation as reported in the Summary Compensation Table (SCT) of the proxy statement for the annual meeting of stockholders in each fiscal year. |
(2) | Values reflected in this column for the CEO and Average Other NEOs represent amounts reported in the Stock Awards and Option Awards columns of the SCT of the proxy statement for the annual meeting of stockholders in each fiscal year, which are deducted from the SCT total in the respective fiscal year. |
(3) | Values reflected in this column for the CEO and Average Other NEOs represent the fair values of equity compensation granted during the respective fiscal year and valued as of such fiscal year end. These amounts are added to the SCT total in the respective fiscal year. |
(4) | Values reflected in this column for the CEO and Average Other NEOs represent any cash dividend equivalents earned on unvested shares during each fiscal year, which are added to the SCT total in the respective fiscal year. These amounts are added to the SCT total in the respective fiscal year. |
(5) | For stock awards granted in prior fiscal years that were unvested at the end of the current fiscal year, the values reflected in this column for the CEO and Average Other NEOs represent the total change in fair value from the end of the prior fiscal year to the end of the current fiscal year. The change in fair value is added or subtracted from the SCT total in the respective fiscal year. |
(6) | For stock awards granted in prior fiscal years that vested during the current fiscal year, the values reflected in this column for the CEO and Average Other NEOs represent the total change in fair value from the end of the prior fiscal year to the vesting date in the current fiscal year. The change in fair value is added or subtracted from the SCT total in the respective fiscal year. |
(7) | For stock awards granted in prior fiscal years that forfeited during the current fiscal year, the values reflected in this column for the CEO and Average Other NEOs represent the fair value of the forfeited awards determined at the end of the prior fiscal year. The fair value is subtracted from the SCT total in the respective fiscal year. |
(8) | The fair values of stock awards added or deducted were computed in accordance with FASB ASC Topic 718. Performance awards with market metrics were remeasured at each fiscal year-end during the vesting period or vesting date using the Monte Carlo Simulation model with variables for volatility, risk free rate and dividend yield. Fair values of non-market-based awards were adjusted for actual performance through each fiscal yearend. In determining probable payout for these awards, fair value adjustments assume target performance for future fiscal years in which metrics have not yet been established as the metrics are established annually for each year within the applicable 3-year performance period. |
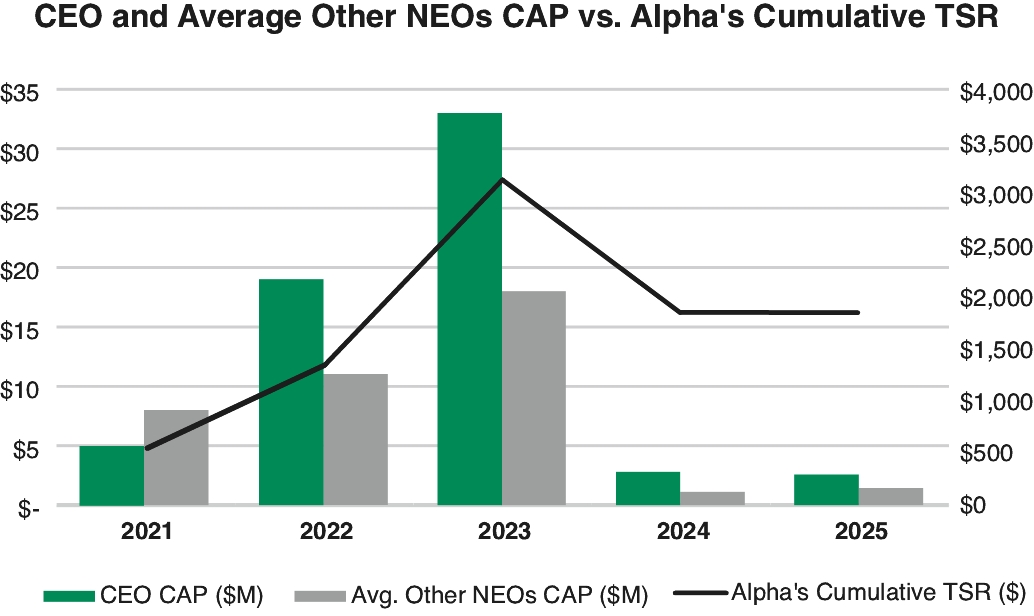
Relationship between Pay and TSR
The graph below reflects the relationship between the CEO and Average Other NEOs CAP and the Company’s cumulative TSR (assuming an initial fixed investment of $100) for the fiscal years ended December 31, 2021, 2022, 2023, 2024 and 2025:
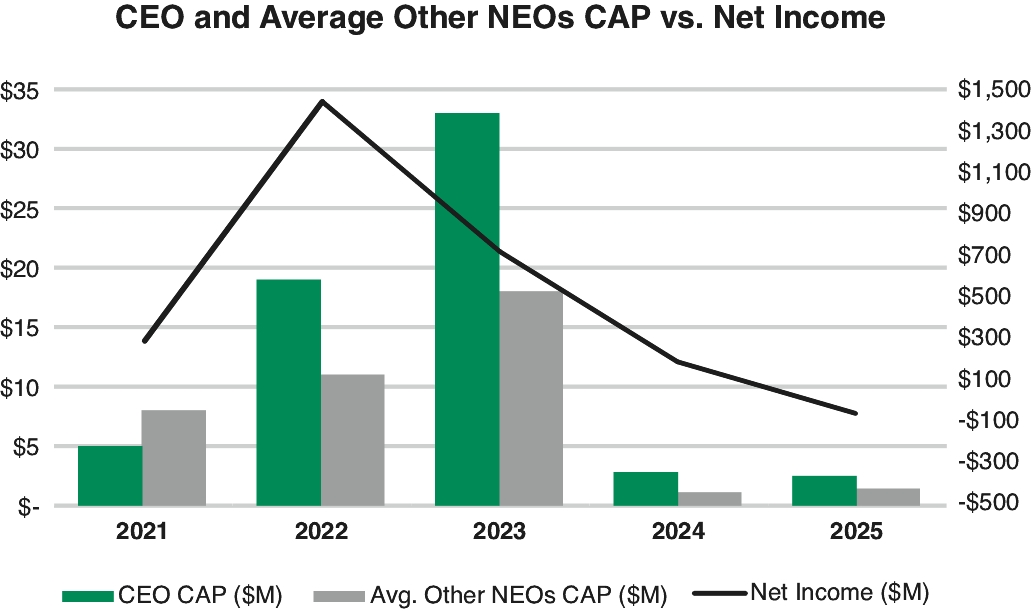
Relationship between Pay and GAAP Net Income
The graph below reflects the relationship between the CEO and Average Other NEOs CAP and the Company’s GAAP Net Income for the fiscal years ended December 31, 2021, 2022, 2023, 2024 and 2025:
Relationship between Pay and Adjusted EBITDA
The graph below reflects the relationship between the CEO and Average Other NEOs CAP and the Company’s Adjusted EBITDA for the fiscal years ended December 31, 2021, 2022, 2023, 2024 and 2025:
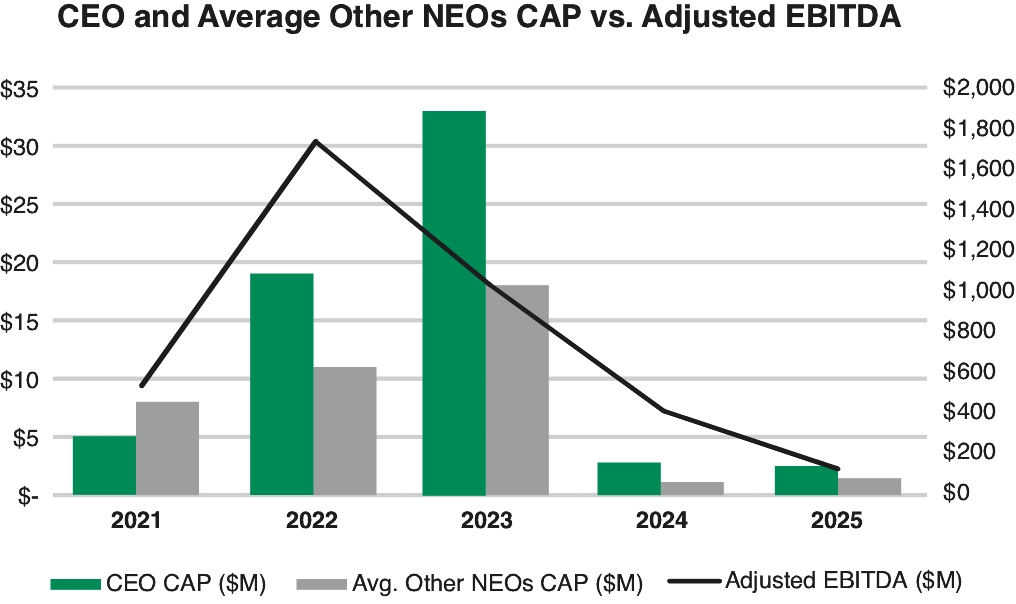
Adjusted EBITDA was calculated as follows: Income from Continuing Operations plus Interest Expense, Income Tax Expense, Depreciation, Depletion and Amortization, and Amortization of Acquired Intangibles, less Interest Income and Income Tax Benefit (“EBITDA”), and excluding the following (i) AIB, Operations Incentive Bonus (“OIB”), and
stock compensation expenses, (ii) Impairment of tangible and intangible assets and related charges, (iii) Gains or Losses associated with Asset Retirement Obligations (“ARO”), (iv) Costs, Revenues, Gains or Losses associated with board approved future and completed business combinations, capital market transactions, reorganizations and/or restructuring programs (including severance/separation costs), and (v) extraordinary, unusual, infrequent or non-recurring items not encompassed in the above exclusions, as determined by the board.
Refer to the Annual Report for reconciliation of net income (loss) to Adjusted EBITDA for the year ended December 31, 2025.
Relationship between Company Versus Peer Group Cumulative TSR
The graph below reflects the relationship between our cumulative TSR and the peer group’s cumulative TSR assuming an initial fixed investment of $100 at fiscal year-end (“FYE”) 2020 for the fiscal years ended December 31, 2021, 2022, 2023, 2024 and 2025:
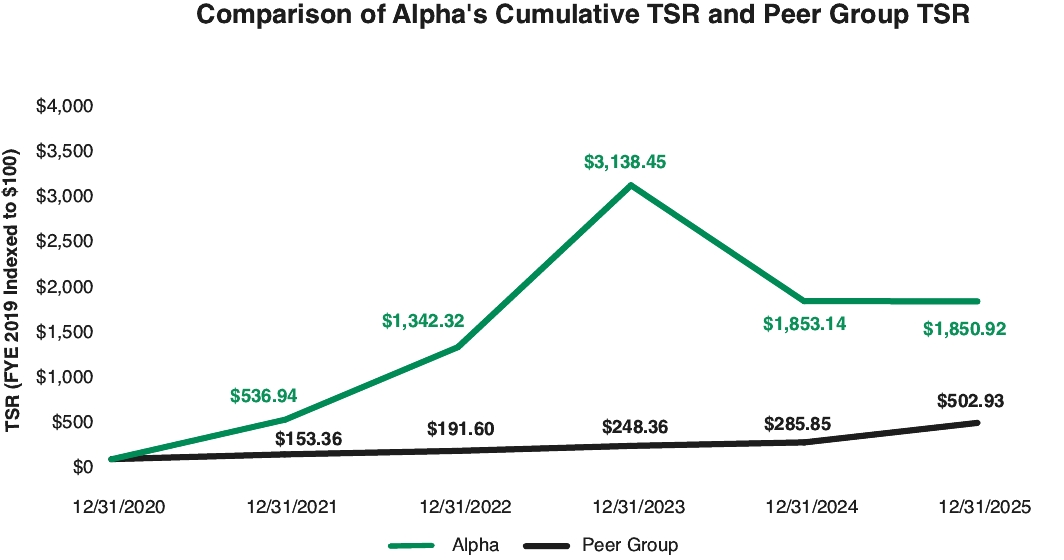
See “Executive Compensation Process—Peer Group” for information on our peer group.
Other Important Performance Measures
We use a mix of financial and non-financial performance measures in our annual short-term incentive and long-term incentive programs as discussed in more detail in the CD&A.
The following were the most important financial performance measures (and non-financial performance measures), as determined by the Company, that link compensation actually paid to our NEOs to the Company’s performance for the most recently completed fiscal year:
• | Adjusted EBITDA (a financial metric) |
• | Cost of Coal Sales (a financial metric) |
• | Non-Fatal Days Lost (NFDL) (a safety metric) |
• | Water quality exceedances including selenium (an environmental metric) |
• | Production goal – feet per shift (FPS) used for measuring productivity at our underground operations |
• | Production goal – yards per day (YPD) used for measuring productivity at our surface operations |