Pay Versus Performance
As required by Section 953(a) of the Dodd-Frank Act and Item 402(v) of Regulation S-K, the below disclosure provides information regarding the relationship between executive “compensation actually paid” for our Principal Executive Officer (“PEO”) and other Named Executive Officer (“Non-PEO NEO”) and certain financial performance of the Company for the years shown.
|
Value of Initial Fixed $100 |
||||||||||||||||||||||||
|
Summary |
Average Summary |
Average |
Investment Based on: |
|||||||||||||||||||||
|
Compensation |
Compensation |
Compensation |
Compensation |
Total |
Net Income/ |
|||||||||||||||||||
|
Table Total |
Actually |
Table Total for |
Actually Paid to |
Shareholder |
(Loss) |
|||||||||||||||||||
|
Year |
for PEO(1) |
Paid PEO(2) |
Non-PEO NEO(1) |
Non-PEO NEO(2) |
Return (3) |
In ($000s) |
||||||||||||||||||
|
2025 |
$ | 1,673,404 | $ | 13,996,475 | $ | 839,526 | $ | 5,383,259 | $ | 170.85 | $ | (21,260 | ) | |||||||||||
|
2024 |
$ | 1,060,841 | $ | 1,220,664 | $ | 608,400 | $ | 657,152 | $ | 22.68 | $ | (11,624 | ) | |||||||||||
|
2023 |
$ | 738,166 | $ | (29,333 | ) | $ | 455,686 | $ | 219,302 | $ | 25.08 | $ | (17,882 | ) | ||||||||||
|
2022 |
$ | 1,416,069 | $ | (977,377 | ) | $ | 728,341 | $ | 836 | $ | 45.77 | $ | 15,811 | |||||||||||
|
2021 |
$ | 2,836,108 | $ | 1,806,539 | $ | 1,250,901 | $ | 906,679 | $ | 92.06 | $ | 14575 | ||||||||||||
|
(1) |
Our PEO for each of fiscal years 2025, 2024, 2023, 2022 and 2021 was Dr. Young. Our Non-PEO NEO for each of such fiscal years was Mr. Fischer. |
|
(2) |
The following table sets forth the amounts adjusted from the Summary Compensation table total to derive the Compensation Actually Paid for each fiscal year shown. |
|
(3) |
The amounts shown reflect the Company’s total shareholder return measured based on a fixed $100 investment made on December 31, 2020, the last trading day before the earliest fiscal year shown in the table. |
|
Add |
Change in Yearend |
Change in Value |
Subtract Value of |
|||||
|
Year-end Value |
Value of Awards |
through Vesting |
Awards Granted in |
|||||
|
of Awards Granted |
Granted in Prior |
of Awards Granted |
Prior Year that |
|||||
|
Summary |
in Fiscal Year |
Year Unvested as |
in Prior Year |
Failed to Meet |
||||
|
Compensation |
Subtract |
Unvested at |
of Fiscal |
Vested During |
Vesting Conditions |
Compensation |
||
|
Table Total |
Stock Awards |
Fiscal Yearend |
Yearend |
Fiscal Year |
in Fiscal Year |
Actually Paid |
||
|
Year |
Executive |
($) |
($) |
($) |
($) |
($) |
($) |
($) |
|
2025 |
PEO |
1,673,404 | (983,482) | 4,006,715 | 8,095,220 | 1,204,618 | — | 13,996,475 |
|
Non-PEO NEO |
839,526 | (366,917) | 1,488,668 | 2,992,533 | 429,449 | — | 5,383,259 | |
|
2024 |
PEO |
1,060,841 | (404,029) | 619,285 | (36,290) | (19,143) | — | 1,220,664 |
|
Non-PEO NEO |
608,400 | (166,538) | 234,911 | (12,883) | (6,738) | — | 657,152 | |
|
2023 |
PEO |
738,166 | (221,354) | 268,308 | (330,785) | (483,668) | — | (29,333) |
|
Non-PEO NEO |
455,686 | (76,824) | 93,120 | (119,105) | (133,575) | — | 219,302 | |
| 2022 | PEO | 1,416,069 | (514,257) | 489,662 | (1,288,940) | (1,079,912) | — | (977,377) |
| Non-PEO NEO | 728,341 | (178,480) | 169,944 | (384,373) | (334,596) | — | 836 | |
| 2021 | PEO | 2,836,108 | (1,888,762) | 1,300,180 | (289,295) | (151,692) | — | 1,806,539 |
| Non-PEO NEO | 1,250,901 | (709,697) | 490,717 | (79,477) | (45,765) | — | 906,679 |
NOTE: There were no awards granted and vesting in the same fiscal year.
|
Add |
Change in Yearend |
Change in Value |
Subtract Value of |
|||||
|
Year-end Value |
Value of Awards |
through Vesting |
Awards Granted in |
|||||
|
of Awards Granted |
Granted in Prior |
of Awards Granted |
Prior Year that |
|||||
|
Summary |
in Fiscal Year |
Year Unvested as |
in Prior Year |
Failed to Meet |
||||
|
Compensation |
Subtract |
Unvested at |
of Fiscal |
Vested During |
Vesting Conditions |
Compensation |
||
|
Table Total |
Stock Awards |
Fiscal Yearend |
Yearend |
Fiscal Year |
in Fiscal Year |
Actually Paid |
||
|
Year |
Executive |
($) |
($) |
($) |
($) |
($) |
($) |
($) |
|
2025 |
PEO |
1,673,404 | (983,482) | 4,006,715 | 8,095,220 | 1,204,618 | — | 13,996,475 |
|
Non-PEO NEO |
839,526 | (366,917) | 1,488,668 | 2,992,533 | 429,449 | — | 5,383,259 | |
|
2024 |
PEO |
1,060,841 | (404,029) | 619,285 | (36,290) | (19,143) | — | 1,220,664 |
|
Non-PEO NEO |
608,400 | (166,538) | 234,911 | (12,883) | (6,738) | — | 657,152 | |
|
2023 |
PEO |
738,166 | (221,354) | 268,308 | (330,785) | (483,668) | — | (29,333) |
|
Non-PEO NEO |
455,686 | (76,824) | 93,120 | (119,105) | (133,575) | — | 219,302 | |
| 2022 | PEO | 1,416,069 | (514,257) | 489,662 | (1,288,940) | (1,079,912) | — | (977,377) |
| Non-PEO NEO | 728,341 | (178,480) | 169,944 | (384,373) | (334,596) | — | 836 | |
| 2021 | PEO | 2,836,108 | (1,888,762) | 1,300,180 | (289,295) | (151,692) | — | 1,806,539 |
| Non-PEO NEO | 1,250,901 | (709,697) | 490,717 | (79,477) | (45,765) | — | 906,679 |
NOTE: There were no awards granted and vesting in the same fiscal year.
Relationship Between Compensation Actually Paid and Performance Measures
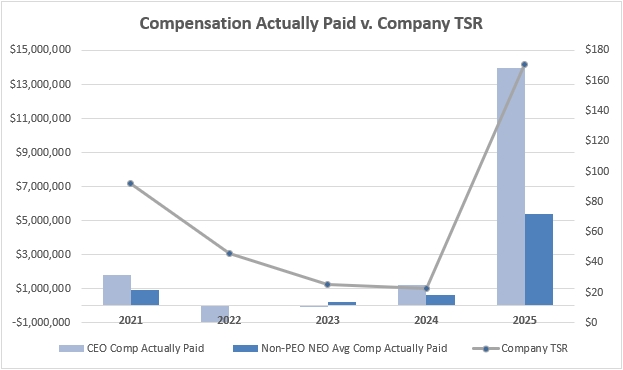
The chart below highlights the alignment between “compensation actually paid” to our Named Executive Officers and our total shareholder return performance for the past three fiscal years.
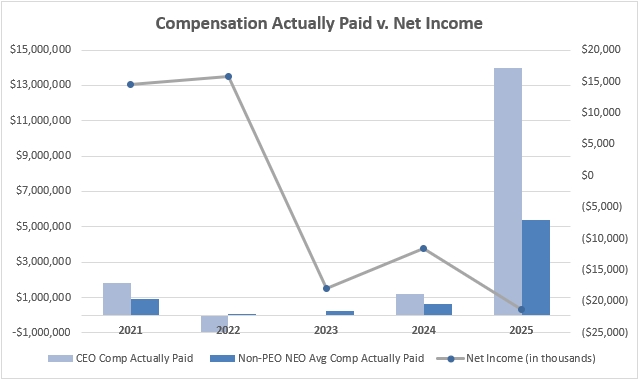
The chart below highlights the alignment between “compensation actually paid” to our Named Executive Officers and our net income performance for the past three fiscal years.