Pay vs Performance Disclosure
Dec. 31, 2025
USD ($)
Dec. 31, 2024
USD ($)
Dec. 31, 2023
USD ($)
Dec. 31, 2022
USD ($)
Dec. 31, 2021
USD ($)
Pay Versus Performance
One of the key principles by which we govern our executive compensation program is to support a solid performance culture through short-term and long-term variable compensation. In 2025, performance-based compensation represented 83% or more of each of our named executive officers’ target total direct compensation. As a result of this weighting toward variable, performance-based compensation, the financial performance of the Company, including stock performance, plays an integral role in determining compensation actually paid to each of our named executive officers each year.
| Fiscal Year (a) |
Summary Compensation Table Total for PEO (1) (b) |
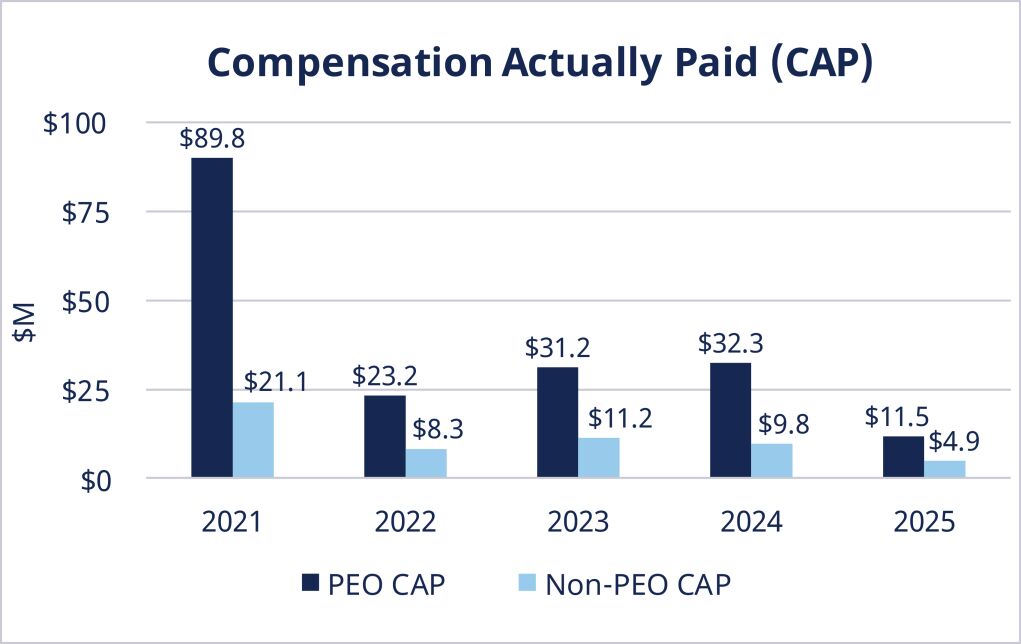
Compensation Actually Paid to PEO (2) (c) |
|
Average Compensation Actually Paid to Non-PEO NEOs (2) (e) |
Value of Initial Fixed $100 Investment Based on |
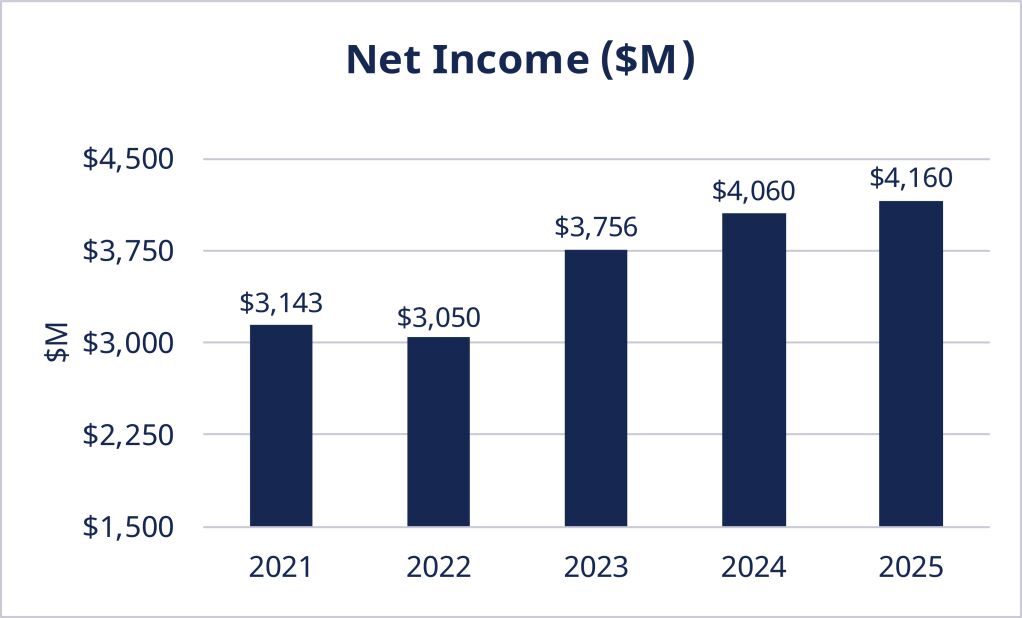
Net Income (4) (h) |
|
|||||||||||||||||||||||||
Average Summary Compensation Table Total for Non-PEO NEOs (1) (d) |
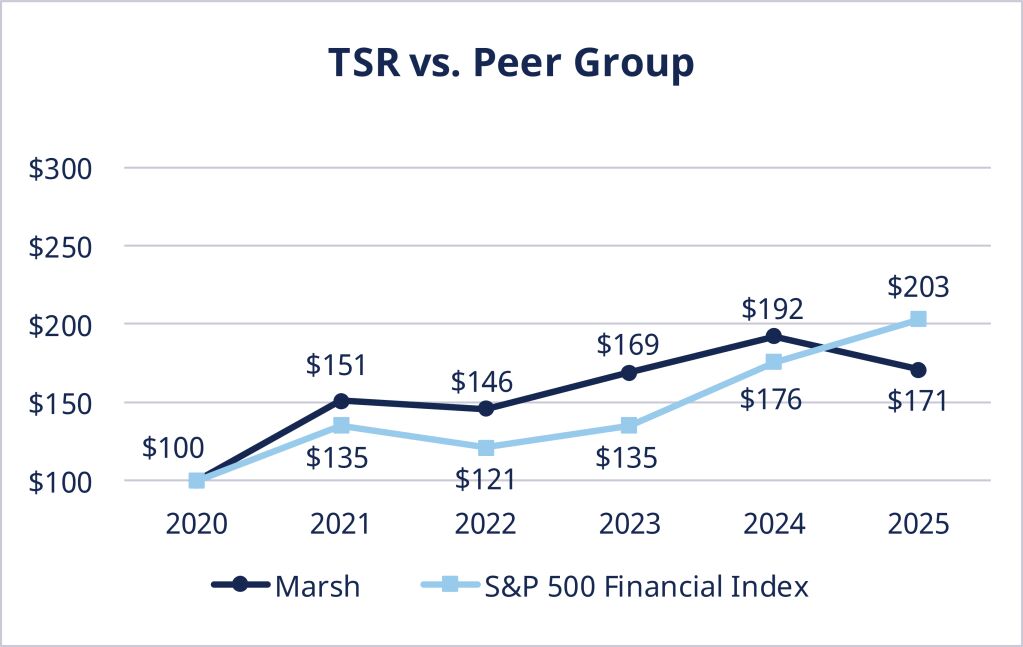
Total Shareholder Return (3) (f) |
Peer Group Total Shareholder Return (3) (g) |
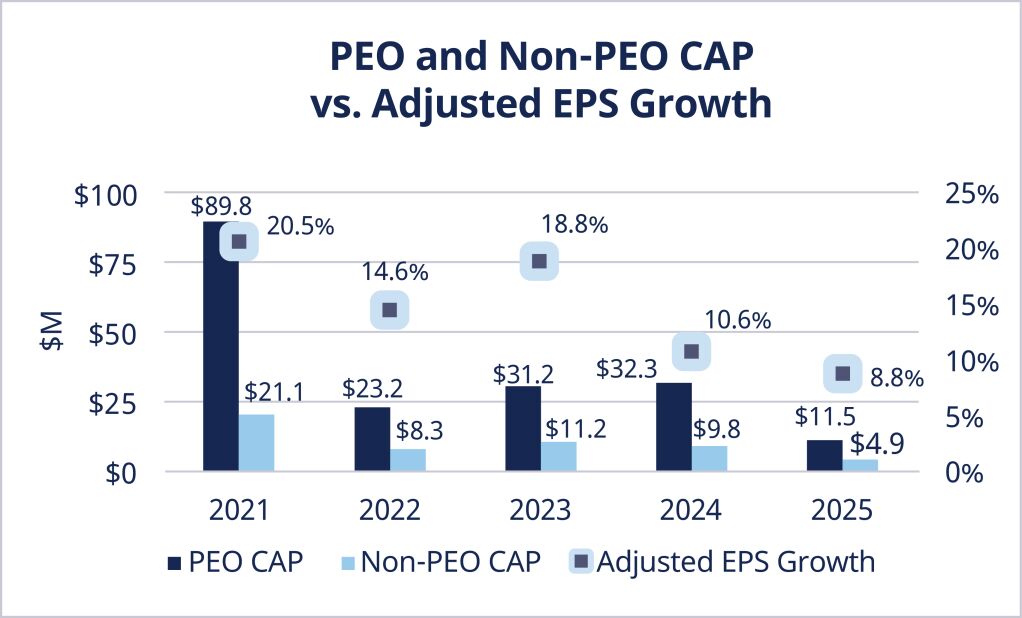
Adjusted EPS Growth as Further Adjusted for Executive Compensation Purposes (5) (i) |
|||||||||||||||||||||||||||||
| 2025 |
25,051,051 |
11,535,337 |
7,130,165 |
4,904,905 |
171 |
203 |
4,160.0 |
8.8% |
||||||||||||||||||||||||
| 2024 |
22,807,539 |
32,339,406 |
7,546,124 |
9,819,968 |
192 |
176 |
4,060.0 |
10.6% |
||||||||||||||||||||||||
| 2023 |
19,054,956 |
31,181,865 |
7,172,630 |
11,156,213 |
169 |
135 |
3,756.0 |
18.8% |
||||||||||||||||||||||||
| 2022 |
30,924,435 |
23,167,779 |
8,088,411 |
8,272,370 |
146 |
121 |
3,050.0 |
14.6% |
||||||||||||||||||||||||
| 2021 |
21,519,703 |
89,772,223 |
6,997,689 |
21,130,889 |
151 |
135 |
3,143.0 |
20.5% |
||||||||||||||||||||||||
(1) |
In 2025, 2024 and 2023, John Q. Doyle was our Principal Executive Officer (PEO) and in 2021 and 2022, Daniel S. Glaser was our Principal Executive Officer. Our other NEOs consisted of (i) for 2021: Mark C. McGivney, John Q. Doyle, Peter C. Hearn and Martine Ferland; (ii) for 2022: Mark C. McGivney, John Q. Doyle, Martin C. South and Martine Ferland, (iii) for 2023: Mark C. McGivney, Martin C South, Martine Ferland and Dean M. Klisura and (iv) for 2024 and 2025: Mark C. McGivney, Martin C. South, Patrick Tomlinson and Dean M. Klisura. |
(2) |
Represents the amount of “Compensation Actually Paid” to our NEOs as computed in accordance with Item 402(v) or Regulation S-K. The dollar amounts do not reflect the actual amount of compensation earned or paid to our NEOs during the applicable year. The following tables show the amounts deducted from and added to the Summary Compensation Table total for the PEO and for the average Summary Compensation Table Total for non-PEO NEOs. |
| PEO |
|
|
|
|
|
|||||||||||||||
Fiscal Year |
PEO Summary Compensation Table (SCT) Total |
Additions/ (Subtractions) for Fair Value of Equity Awards Granted during Fiscal Year Reported in SCT (a) |
Additions/ (Subtractions) for Change in Pension Value Reported in SCT (a) |
Adjustments to PEO Summary Compensation Table Total (b) |
PEO Compensation Actually Paid |
|||||||||||||||
| 2025 |
25,051,051 |
(17,584,489) |
0 |
4,068,775 |
11,535,337 |
|||||||||||||||
| 2024 |
22,807,539 |
(14,421,635) |
0 |
23,953,502 |
32,339,406 |
|||||||||||||||
| Average Non-PEO NEOs |
|
|
|
|||||||||||||||||
Fiscal Year |
Average Non-PEO Summary Compensation Table (SCT) Total |
Additions/ (Subtractions) for Fair Value of Equity Awards Granted during Fiscal Year Reported in SCT (a) |
Additions/ (Subtractions) for Change in Pension Value Reported in SCT (a) |
Adjustments to Average Non-PEO Summary Compensation Table Total (b) |
Average Non-PEO Compensation Actually Paid |
|||||||||||||||
| 2025 |
7,130,165 |
(2,913,378) |
(40,717) |
728,835 |
4,904,905 |
|||||||||||||||
| 2024 |
7,546,124 |
(2,937,798) |
(10,844) |
5,222,486 |
9,819,968 |
|||||||||||||||
(a) |
Includes the grant date fair value of stock awards and option awards, computed in accordance with FASB ASC Topic 718, as well as the aggregate change in the actuarial present value of the NEOs accumulated benefit under the Company’s defined benefit pension plans. |
(b) |
Includes the value of equity awards, calculated in accordance with Item 402(v) of Regulation S-K. The equity component of CAP is further detailed in the tables below for the Company’s PEO and average non-PEO NEOs, for fiscal year 2024. We did not report a service cost for the Company’s pension plans. |
| PEO |
|
|
|
|
|
|||||||||||||||
Fiscal Year |
Year-End FairValue of Equity Awards Granted During the Fiscal Year that are Outstanding and Unvested |
Change in Fair Value of Prior Year Awards that are Outstanding and Unvested |
Change in Fair Value (from Prior Year-End) of Prior Year Awards that Vested During the Fiscal Year |
Dividends Paid on Stock or Stock Option Awards Not Otherwise Reflected in Fair Value of Total Compensation |
Total Adjustments |
|||||||||||||||
| 2025 |
38,237,182 |
(50,556,740) |
16,126,649 |
261,685 |
4,068,775 |
|||||||||||||||
| 2024 |
16,961,136 |
(5,907,710) |
12,694,817 |
205,258 |
23,953,502 |
|||||||||||||||
| Average Non-PEO NEOs |
|
|
|
|||||||||||||||||
Fiscal Year |
Year-End Fair Value of Equity Awards Granted During the Fiscal Year that are Outstanding and Unvested |
Change in Fair Value of Prior Year Awards that are Outstanding and Unvested |
Change in Fair Value (from Prior Year-End) of Prior Year Awards that Vested During the Fiscal Year |
Dividends Paid on Stock or Stock Option Awards Not Otherwise Reflected in Fair Value of Total Compensation |
Total Adjustments |
|||||||||||||||
| 2025 |
7,338,017 |
(12,079,990) |
5,365,650 |
105,157 |
728,835 |
|||||||||||||||
| 2024 |
3,418,980 |
(3,142,951) |
4,849,277 |
97,180 |
5,222,486 |
|||||||||||||||
(3) |
Reflects cumulative total stockholder return assuming $100 invested in the Company’s common stock versus the S&P 500 Financial index on December 31, 2020 with dividends reinvested. The peer group used for this purpose is the S&P 500 Financial index. |
(4) |
Reflects “Net Income” as required to be disclosed in the Company’s audited financial statements, included in the Company’s Annual Report on Form 10-K for the years ended December 31, 2025, 2024, 2023, 2022 and 2021, respectively. |
(5) |
Adjusted EPS as further adjusted for executive compensation purposes is a non-GAAP measure. For the definition, please refer to the “Definitions of Financial Performance Measures” section on page 48 of the Compensation Discussion and Analysis. |
(2) |
Represents the amount of “Compensation Actually Paid” to our NEOs as computed in accordance with Item 402(v) or Regulation S-K. The dollar amounts do not reflect the actual amount of compensation earned or paid to our NEOs during the applicable year. The following tables show the amounts deducted from and added to the Summary Compensation Table total for the PEO and for the average Summary Compensation Table Total for non-PEO NEOs. |
| PEO |
|
|
|
|
|
|||||||||||||||
Fiscal Year |
PEO Summary Compensation Table (SCT) Total |
Additions/ (Subtractions) for Fair Value of Equity Awards Granted during Fiscal Year Reported in SCT (a) |
Additions/ (Subtractions) for Change in Pension Value Reported in SCT (a) |
Adjustments to PEO Summary Compensation Table Total (b) |
PEO Compensation Actually Paid |
|||||||||||||||
| 2025 |
25,051,051 |
(17,584,489) |
0 |
4,068,775 |
11,535,337 |
|||||||||||||||
| 2024 |
22,807,539 |
(14,421,635) |
0 |
23,953,502 |
32,339,406 |
|||||||||||||||
(a) |
Includes the grant date fair value of stock awards and option awards, computed in accordance with FASB ASC Topic 718, as well as the aggregate change in the actuarial present value of the NEOs accumulated benefit under the Company’s defined benefit pension plans. |
(b) |
Includes the value of equity awards, calculated in accordance with Item 402(v) of Regulation S-K. The equity component of CAP is further detailed in the tables below for the Company’s PEO and average non-PEO NEOs, for fiscal year 2024. We did not report a service cost for the Company’s pension plans. |
| PEO |
|
|
|
|
|
|||||||||||||||
Fiscal Year |
Year-End FairValue of Equity Awards Granted During the Fiscal Year that are Outstanding and Unvested |
Change in Fair Value of Prior Year Awards that are Outstanding and Unvested |
Change in Fair Value (from Prior Year-End) of Prior Year Awards that Vested During the Fiscal Year |
Dividends Paid on Stock or Stock Option Awards Not Otherwise Reflected in Fair Value of Total Compensation |
Total Adjustments |
|||||||||||||||
| 2025 |
38,237,182 |
(50,556,740) |
16,126,649 |
261,685 |
4,068,775 |
|||||||||||||||
| 2024 |
16,961,136 |
(5,907,710) |
12,694,817 |
205,258 |
23,953,502 |
|||||||||||||||
(2) |
Represents the amount of “Compensation Actually Paid” to our NEOs as computed in accordance with Item 402(v) or Regulation S-K. The dollar amounts do not reflect the actual amount of compensation earned or paid to our NEOs during the applicable year. The following tables show the amounts deducted from and added to the Summary Compensation Table total for the PEO and for the average Summary Compensation Table Total for non-PEO NEOs. |
| Average Non-PEO NEOs |
|
|
|
|||||||||||||||||
Fiscal Year |
Average Non-PEO Summary Compensation Table (SCT) Total |
Additions/ (Subtractions) for Fair Value of Equity Awards Granted during Fiscal Year Reported in SCT (a) |
Additions/ (Subtractions) for Change in Pension Value Reported in SCT (a) |
Adjustments to Average Non-PEO Summary Compensation Table Total (b) |
Average Non-PEO Compensation Actually Paid |
|||||||||||||||
| 2025 |
7,130,165 |
(2,913,378) |
(40,717) |
728,835 |
4,904,905 |
|||||||||||||||
| 2024 |
7,546,124 |
(2,937,798) |
(10,844) |
5,222,486 |
9,819,968 |
|||||||||||||||
(a) |
Includes the grant date fair value of stock awards and option awards, computed in accordance with FASB ASC Topic 718, as well as the aggregate change in the actuarial present value of the NEOs accumulated benefit under the Company’s defined benefit pension plans. |
(b) |
Includes the value of equity awards, calculated in accordance with Item 402(v) of Regulation S-K. The equity component of CAP is further detailed in the tables below for the Company’s PEO and average non-PEO NEOs, for fiscal year 2024. We did not report a service cost for the Company’s pension plans. |
| Average Non-PEO NEOs |
|
|
|
|||||||||||||||||
Fiscal Year |
Year-End Fair Value of Equity Awards Granted During the Fiscal Year that are Outstanding and Unvested |
Change in Fair Value of Prior Year Awards that are Outstanding and Unvested |
Change in Fair Value (from Prior Year-End) of Prior Year Awards that Vested During the Fiscal Year |
Dividends Paid on Stock or Stock Option Awards Not Otherwise Reflected in Fair Value of Total Compensation |
Total Adjustments |
|||||||||||||||
| 2025 |
7,338,017 |
(12,079,990) |
5,365,650 |
105,157 |
728,835 |
|||||||||||||||
| 2024 |
3,418,980 |
(3,142,951) |
4,849,277 |
97,180 |
5,222,486 |
|||||||||||||||
Tabular List of Most Important Performance Measures
The table below shows the Company’s three most important performance measures used to link “Compensation Actually Paid” to our NEOs for fiscal year 2025.
| Most Important Performance Measures (3 to 7 metrics without ranking) |
|
|||
| TSR |
|
|
| |
| Adjusted EPS as further adjusted for executive compensation purposes |
|
|
| |
| Operating NOI growth |
|
|
| |
non-GAAP
measure. For the definition, please refer to the “Definitions of Financial Performance Measures” section on page 48 of the Compensation Discussion and Analysis.