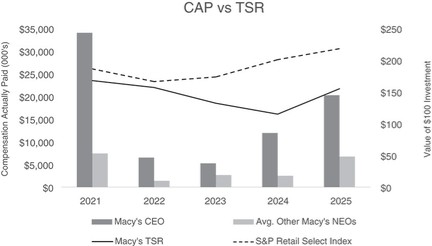
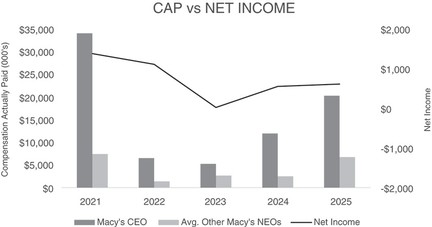
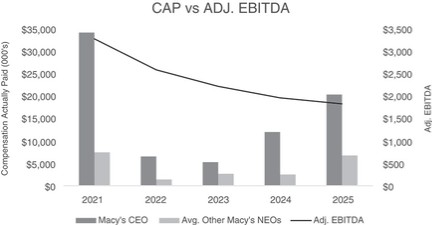
As required by SEC rules, we are providing the following information about the relationship between executive “compensation actually paid” (calculated in accordance with such rules) and certain performance of the Company. The following table sets forth information regarding compensation for our Principal Executive Officer (PEO) and average compensation for our other NEOs (the Non-PEO Named Executive Officers) versus our Company performance for the past five years.
AVERAGE | AVERAGE | VALUE OF INITIAL FIXED $100 | |||||||||||||||
SUMMARY | COMPENSATION | INVESTMENT BASED ON: | |||||||||||||||
COMPENSATION | ACTUALLY | PEER | |||||||||||||||
TABLE TOTAL | PAID TO | GROUP | |||||||||||||||
SUMMARY | COMPENSATION | FOR NON-PEO | NON-PEO | TOTAL | TOTAL | NET | ADJUSTED | ||||||||||
COMPENSATION | ACTUALLY | NAMED | NAMED | SHARE- | SHARE- | INCOME | EBITDA (4) | ||||||||||
TABLE TOTAL | PAID TO PEO | EXECUTIVE | EXECUTIVE | HOLDER | HOLDER | ($ IS IN | ($ IS IN | ||||||||||
YEAR | | FOR PEO | | (1) | | OFFICERS (2) | | OFFICERS(2) | | RETURN | | RETURN (3) | | MILLIONS) | | MILLIONS) | |
2025 | 14,104,067 | 20,520,165 | 4,872,290 | 6,811,096 | 156.83 | 220.77 | 642 | 1,842 | |||||||||
2024 | 16,452,108 | 12,081,365 | 3,560,945 | 2,521,885 | 116.33 | 203.27 | 582 | 1,977 | |||||||||
2023 | (5) | 11,563,739 | 5,299,241 | 4,005,741 | 2,684,364 | 133.73 | 175.69 | 45 | 2,236 | ||||||||
2022 | 11,055,991 | 6,582,240 | 2,906,394 | 1,397,507 | 158.85 | 168.26 | 1,146 | 2,607 | |||||||||
2021 | 12,290,931 | 34,457,910 | 3,480,607 | 7,504,335 | 169.84 | 188.51 | 1,419 | 3,305 | |||||||||
(1) | Mr. Spring (2024-2025 PEO) and Mr. Gennette (2021-2023 PEO) were the only executive officers included as a PEO for each fiscal year covered in the table. |
Amounts deducted from the Summary Compensation Table Total for PEO to calculate Compensation Actually Paid to PEO for 2025 include $311,392 reflecting aggregate change in actuarial present value of benefit under defined benefit and actuarial pension plans, $9,007,868 for value of stock awards and $0 for value of option awards.
Amounts added to (or subtracted from) Summary Compensation Table Compensation Total for PEO to calculate Compensation Actually Paid to PEO include $15,492,503 for year-end fair value of RSU, PRSU and option awards granted in the year that remain outstanding and unvested at end of year, ($283,645) for change in fair value (from prior year-end to year-end) for RSU, PRSU and option awards granted in prior years that were outstanding and unvested at end of year, $305,878 for change in fair value (from prior year-end to vesting date) of RSU, PRSU and option awards that vested during the year, $0 for fair value of PRSU awards that failed to meet vesting conditions in the year and $220,623 for dividend equivalents.
| (2) | The Named Executive Officers included in the calculation of Average Summary Compensation Table Total for Non-PEO Named Executive Officers were for 2025 – Messrs. Bron, Edwards and Mitchell and Mses. Kirgan and Preston. |
Amounts (as averages) deducted from the Summary Compensation Table Total for Non-PEO Named Executive Officers to calculate Compensation Actually Paid to Non-PEO Named Executive Officers for 2025 include $0 reflecting aggregate change in actuarial present value of benefit under defined benefit and actuarial pension plans, $1,962,077 for value of stock awards and $0 for value of option awards.
Amounts added to (or subtracted from) Average Summary Compensation Table Compensation Total for Non-PEO Named Executive Officers to calculate Average Compensation Actually Paid to Non-PEO Named Executive Officers for 2025 include $3,490,372 for year-end fair value of RSU, PRSU and option awards granted in the year that remain outstanding and unvested at end of year, $337,188 for change in fair value (from prior year-end to year-end) for RSU, PRSU and option awards granted in prior years that were outstanding and unvested at end of year, $13,286 for change in fair value (from prior year-end to vesting date) of RSU, PRSU and option awards that vested during the year, $0 for fair value of PRSU awards that failed to meet vesting conditions in the year and $60,037 for dividend equivalents.
Fair value at the relevant times of PRSU awards subject to achievement of performance conditions is based on the Company’s estimate of the probable outcome of units being earned. Assumptions used to estimate fair value of stock and option awards are the same as those disclosed as of the date of grant of the award.
(3) | The peer group is the S&P Retail Select Industry Index. |
(4) | We chose Adjusted EBITDA as our Company selected measure for evaluating Pay versus Performance because it is a key metric in our Annual Incentive Plan and Long-term Incentive Plan. See “Non-GAAP Metrics” in “Compensation Discussion and Analysis” for definition of Adjusted EBITDA. |
(5) | The amounts for the PEO and impacted NEOs for 2023 reflect repayment of erroneously awarded compensation under the Company’s Compensation Clawback Policy as a result of revisions to correct an error to previously issued financial statements. See “Recovery of Erroneously Awarded Compensation.” |
(1) | Mr. Spring (2024-2025 PEO) and Mr. Gennette (2021-2023 PEO) were the only executive officers included as a PEO for each fiscal year covered in the table. |
| (2) | The Named Executive Officers included in the calculation of Average Summary Compensation Table Total for Non-PEO Named Executive Officers were for 2025 – Messrs. Bron, Edwards and Mitchell and Mses. Kirgan and Preston. |
(3) | The peer group is the S&P Retail Select Industry Index. |
Amounts deducted from the Summary Compensation Table Total for PEO to calculate Compensation Actually Paid to PEO for 2025 include $311,392 reflecting aggregate change in actuarial present value of benefit under defined benefit and actuarial pension plans, $9,007,868 for value of stock awards and $0 for value of option awards.
Amounts added to (or subtracted from) Summary Compensation Table Compensation Total for PEO to calculate Compensation Actually Paid to PEO include $15,492,503 for year-end fair value of RSU, PRSU and option awards granted in the year that remain outstanding and unvested at end of year, ($283,645) for change in fair value (from prior year-end to year-end) for RSU, PRSU and option awards granted in prior years that were outstanding and unvested at end of year, $305,878 for change in fair value (from prior year-end to vesting date) of RSU, PRSU and option awards that vested during the year, $0 for fair value of PRSU awards that failed to meet vesting conditions in the year and $220,623 for dividend equivalents.
Amounts (as averages) deducted from the Summary Compensation Table Total for Non-PEO Named Executive Officers to calculate Compensation Actually Paid to Non-PEO Named Executive Officers for 2025 include $0 reflecting aggregate change in actuarial present value of benefit under defined benefit and actuarial pension plans, $1,962,077 for value of stock awards and $0 for value of option awards.
Amounts added to (or subtracted from) Average Summary Compensation Table Compensation Total for Non-PEO Named Executive Officers to calculate Average Compensation Actually Paid to Non-PEO Named Executive Officers for 2025 include $3,490,372 for year-end fair value of RSU, PRSU and option awards granted in the year that remain outstanding and unvested at end of year, $337,188 for change in fair value (from prior year-end to year-end) for RSU, PRSU and option awards granted in prior years that were outstanding and unvested at end of year, $13,286 for change in fair value (from prior year-end to vesting date) of RSU, PRSU and option awards that vested during the year, $0 for fair value of PRSU awards that failed to meet vesting conditions in the year and $60,037 for dividend equivalents.
Fair value at the relevant times of PRSU awards subject to achievement of performance conditions is based on the Company’s estimate of the probable outcome of units being earned. Assumptions used to estimate fair value of stock and option awards are the same as those disclosed as of the date of grant of the award.
Performance Measures
The most important financial performance measures used to link compensation actually paid to the Company’s NEOs with the Company’s performance for 2025 are as follows:
| ● | Adjusted EBITDA |
| ● | Total revenue |
| ● | Relative total shareholder return |
(4) | We chose Adjusted EBITDA as our Company selected measure for evaluating Pay versus Performance because it is a key metric in our Annual Incentive Plan and Long-term Incentive Plan. See “Non-GAAP Metrics” in “Compensation Discussion and Analysis” for definition of Adjusted EBITDA. |