Pay vs Performance Disclosure - USD ($)
Dec. 31, 2025
Dec. 31, 2024
Dec. 31, 2023
Dec. 31, 2022
Dec. 31, 2021
Pay Versus Performance
Pursuant to the SEC’s pay versus performance (“PVP”) disclosure rules, the following Pay Versus Performance table (“PVP Table”) provides
SEC-required
information about compensation for 2025 for this Proxy Statement’s named executive officers, as well as compensation for 2024, 2023, 2022 and 2021 for our named executive officers from our 2025, 2024, 2023 and 2022 Proxy Statements, respectively (each of 2021, 2022, 2023, 2024 and 2025, a “Covered Year”). We refer to all of the named executive officers covered in the PVP Table below, collectively, as the “PVP NEOs”. The PVP Table also provides information about the results for certain measures of financial performance during those same Covered Years. In reviewing this information, there are a few important things we believe you should consider: • |
The information in columns (b) and (d) of the PVP Table comes directly from our Summary Compensation Tables for the relevant years; and |
• |
As required by the SEC’s PVP rules, we label the information in columns (c) and (e) of the PVP Table as “compensation actually paid” (or “CAP”) to the applicable PVP NEOs. However, these CAP amounts may not necessarily reflect “take home pay” or the final compensation that our PVP NEOs actually earned or walked away with for their service in the Covered Years. Instead, the SEC’s concept of CAP reflects a combination of realized pay and realizable or accrued pay. As a result, CAP amounts are calculated in a manner different than information that we have presented elsewhere in this Proxy Statement, especially with respect to the valuation of outstanding equity awards. |
As discussed above in “Compensation Discussion and Analysis – 2025 Compensation Program – Annual Incentive Compensation Design”, the Company did not use any financial performance measures to link compensation actually paid to our NEOs in 2025 to Company performance. Therefore, we have not disclosed any “Company-Selected Measure” for purposes of the table or analysis below, nor have we disclosed any financial performance measures as being the most important financial performance measures used by the Company to link compensation actually paid to our NEOs in 2025 to Company performance.
We did not provide any direct or indirect compensation to our current CEO or CIO for their service as our current CEO or CIO in 2025 nor, to our knowledge, did Curbline Properties. The Company continues to be responsible for the compensation of our named executive officers who are employed by the Company (namely Messrs. Morgan and Kitlowski), and the Committee continues to oversee the design and administration of, and changes to, the Company’s compensation programs with respect to these executives.
Pay Versus Performance Table
(a) |
(b) |
(c) |
(d) |
(e) |
(f) |
(g) |
(h) | ||||||||||||||||||||||||||||
| |
|
|
|
|
VALUE OF INITIAL FIXED $100 INVESTMENT BASED ON |
| |||||||||||||||||||||||||||||
YEAR |
SUMMARY COMPENSATION TABLE (“SCT”) TOTAL FOR PEO ($)(1) |
COMPENSATION ACTUALLY PAID TO PEO ($)(1)(2) |
AVERAGE SCT TOTAL FOR NON-PEO PVP NEOS ($)(1) |
AVERAGE COMPENSATION ACTUALLY PAID TO NON-PEO PVP NEOS ($)(1)(2) |
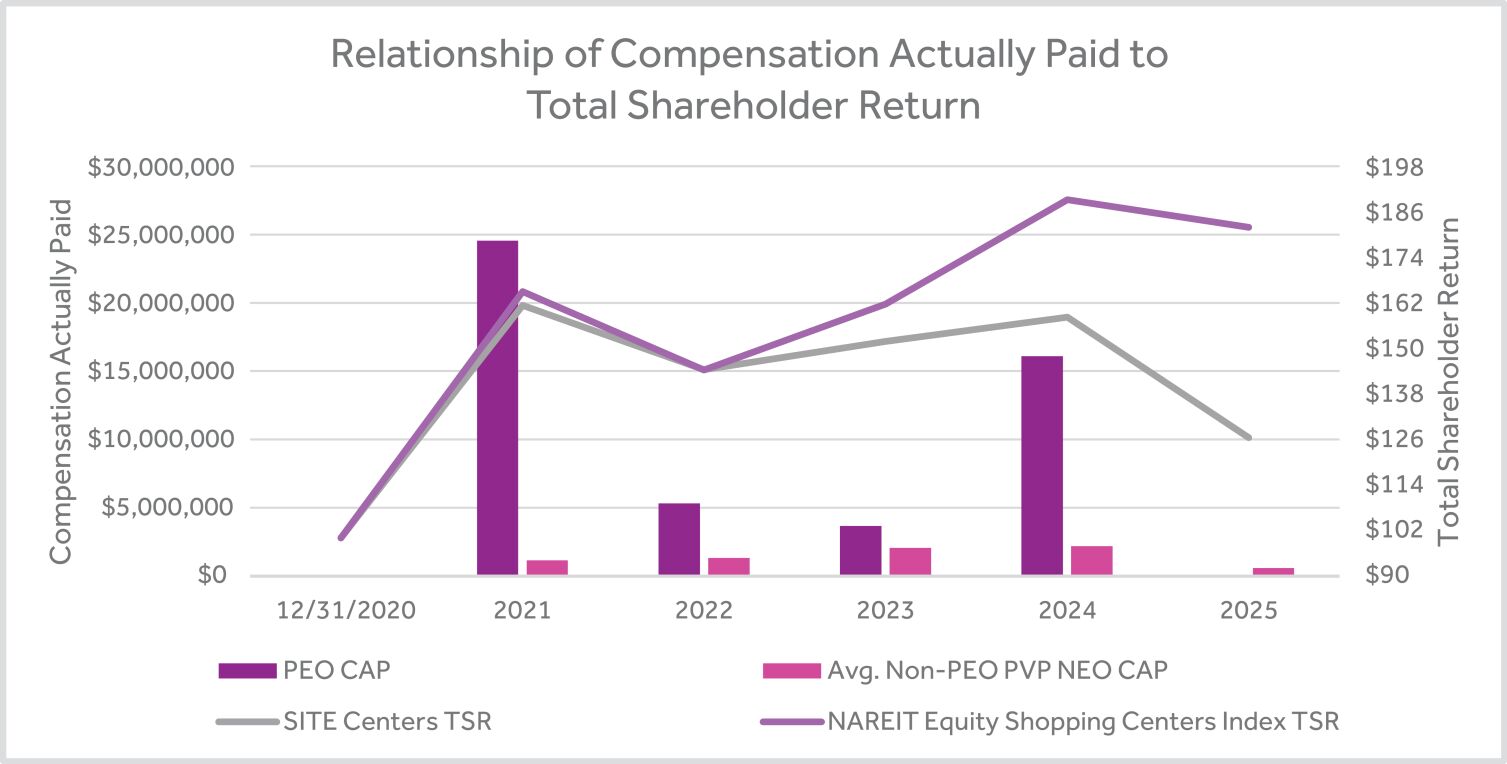
TOTAL SHAREHOLDER RETURN ($)(3) |
PEER GROUP TOTAL SHAREHOLDER RETURN ($)(4) |
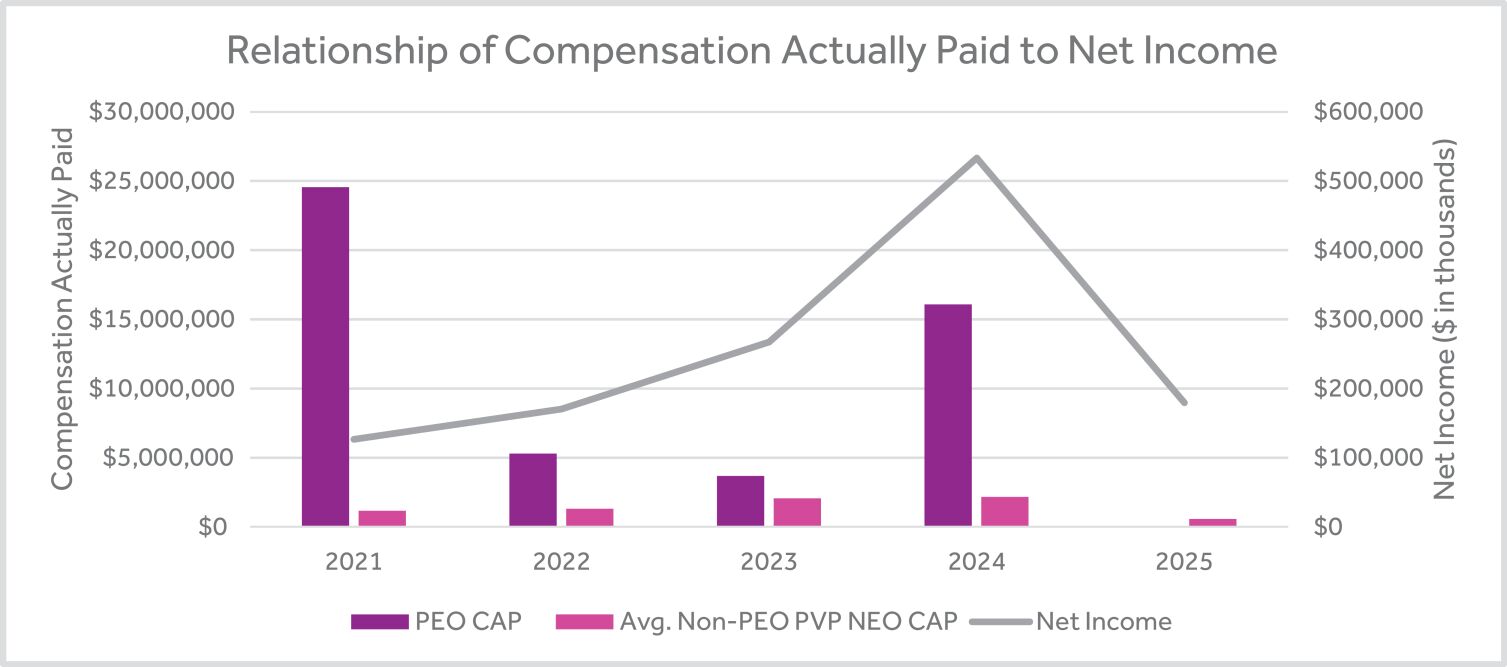
NET INCOME ($)(5) | ||||||||||||||||||||||||||||
2025 |
0 |
0 |
657,416 |
582,232 |
126.51 |
182.01 |
177,861 |
||||||||||||||||||||||||||||
2024 |
7,934,301 |
16,089,694 |
1,596,314 |
2,185,760 |
158.26 |
189.29 |
531,824 |
||||||||||||||||||||||||||||
2023 |
6,740,650 |
3,657,129 |
2,405,897 |
2,049,666 |
151.85 |
161.74 |
265,703 |
||||||||||||||||||||||||||||
2022 |
6,799,485 |
5,305,017 |
1,500,884 |
1,309,320 |
144.47 |
144.36 |
168,719 |
||||||||||||||||||||||||||||
2021 |
6,910,219 |
24,547,349 |
1,625,444 |
2,093,387 |
161.37 |
165.05 |
124,935 |
||||||||||||||||||||||||||||
(1) |
David Lukes was our principal executive officer (“PEO”) for the full year for each of the Covered Years. For 2025, our non-PEO PVP NEOs (“Non-PEO NEOs”) were Gerald Morgan, John Cattonar and Aaron Kitlowski. For 2024, our Non-PEO NEOs were Gerald Morgan, Conor Fennerty, John Cattonar, Aaron Kitlowski and Christa Vesy. For each of 2023, 2022 and 2021, our Non-PEO NEOs were Conor Fennerty, John Cattonar and Christa Vesy. |
(2) |
For 2025, in determining both the CAP for our PEO and the average CAP for our Non-PEO PVP NEOs for purposes of this PVP Table, we deducted from or added back to the total amount of compensation reported in column (b) and column (d) for such Covered Year the following amounts: |
ITEM AND VALUE ADDED (DEDUCTED) |
2025 ($) | ||||
For David R. Lukes: |
|||||
- SCT “Stock Awards” column value |
(0 |
) | |||
+ Covered Year-end fair value of outstanding equity awards granted in Covered Year |
0 |
||||
+/- Change in fair value (from prior year-end to Covered Year-end) of equity awards outstanding at Covered Year-end that were granted prior to Covered Year |
0 |
||||
+ Fair value as of vesting date of equity awards granted and vested in Covered Year |
0 |
||||
+/- Change in fair value (from prior year-end to vest date in Covered Year) of equity awards granted prior to Covered Year that vested in Covered Year |
0 |
||||
+ Includable dividend equivalents paid on equity awards during Covered Year |
0 |
||||
TOTAL ADDED (DEDUCTED) |
0 |
||||
For Non-PEO Named Executive Officers (Average): |
|||||
- SCT “Stock Awards” column value |
(0 |
) | |||
+ Covered Year-end fair value of outstanding equity awards granted in Covered Year |
0 |
||||
+/- Change in fair value (from prior year-end to Covered Year-end) of equity awards outstanding at Covered Year-end that were granted prior to Covered Year |
(284,567 |
) | |||
+ Fair value as of vesting date of equity awards granted and vested in Covered Year |
0 |
||||
+/- Change in fair value (from prior year-end to vest date in Covered Year) of equity awards granted prior to Covered Year that vested in Covered Year |
(7,170 |
) | |||
- Prior year-end fair value of prior-year equity awards forfeited in Covered Year |
(0 |
) | |||
+ Includable dividend equivalents paid on equity awards during Covered Year |
216,553 |
||||
TOTAL ADDED (DEDUCTED) |
(75,184 |
) | |||
Please note that while similar adjustment information was provided in our 2025 proxy statement for Covered Year 2024, our 2024 proxy statement for Covered Year 2023 and in our 2023 proxy statement for Covered Years 2021 and 2022, under applicable SEC guidance, repeating such adjustment information is not required in this Proxy Statement because in our view it is not material to our shareholders’ understanding of the information reported in the PVP Table for 2025 or the relationships disclosures provided below. |
(3) |
For each Covered Year, our absolute TSR was calculated based on the percentage change in value of our common shares, par value $0.10 per share, measured as the quotient of (a) the sum of (i) the cumulative amount of dividends for the period beginning with our closing share price on the NYSE on December 31, 2020 through and including the last day of the Covered Year (each one-year, two-year, three-year, four-year and five-year period, a “Measurement Period”), assuming dividends paid on common shares during the year (including the distribution of Curbline Properties shares at the time of its spin-off in October 2024) were deemed reinvested in additional common shares, plus (ii) the difference between our closing share price at the end versus the beginning of the Measurement Period, divided by (b) our closing share price at the beginning of the Measurement Period. Each of these percentage changes was then applied to a deemed fixed investment of $100 at the beginning of each Measurement Period to produce the Covered Year-end values of such investment as of the end of 2025, 2024, 2023, 2022 and 2021, as applicable. Because Covered Years are presented in the table in reverse chronological order (from top to bottom), the table should be read from bottom to top for purposes of understanding cumulative returns over time. |
(4) |
For purposes of this PVP disclosure, our peer group is the FTSE NAREIT Equity Shopping Centers Index (the “PVP Peer Group”). For each Covered Year, the PVP Peer Group cumulative TSR was calculated based on a deemed fixed investment of $100 in the index through each Measurement Period, assuming dividend reinvestment. |
(5) |
In thousands. These net income results were calculated in accordance with U.S. GAAP. |
(1) |
David Lukes was our principal executive officer (“PEO”) for the full year for each of the Covered Years. For 2025, our non-PEO PVP NEOs (“Non-PEO NEOs”) were Gerald Morgan, John Cattonar and Aaron Kitlowski. For 2024, our Non-PEO NEOs were Gerald Morgan, Conor Fennerty, John Cattonar, Aaron Kitlowski and Christa Vesy. For each of 2023, 2022 and 2021, our Non-PEO NEOs were Conor Fennerty, John Cattonar and Christa Vesy. |
(2) |
For 2025, in determining both the CAP for our PEO and the average CAP for our Non-PEO PVP NEOs for purposes of this PVP Table, we deducted from or added back to the total amount of compensation reported in column (b) and column (d) for such Covered Year the following amounts: |
ITEM AND VALUE ADDED (DEDUCTED) |
2025 ($) | ||||
For David R. Lukes: |
|||||
- SCT “Stock Awards” column value |
(0 |
) | |||
+ Covered Year-end fair value of outstanding equity awards granted in Covered Year |
0 |
||||
+/- Change in fair value (from prior year-end to Covered Year-end) of equity awards outstanding at Covered Year-end that were granted prior to Covered Year |
0 |
||||
+ Fair value as of vesting date of equity awards granted and vested in Covered Year |
0 |
||||
+/- Change in fair value (from prior year-end to vest date in Covered Year) of equity awards granted prior to Covered Year that vested in Covered Year |
0 |
||||
+ Includable dividend equivalents paid on equity awards during Covered Year |
0 |
||||
TOTAL ADDED (DEDUCTED) |
0 |
||||
For Non-PEO Named Executive Officers (Average): |
|||||
- SCT “Stock Awards” column value |
(0 |
) | |||
+ Covered Year-end fair value of outstanding equity awards granted in Covered Year |
0 |
||||
+/- Change in fair value (from prior year-end to Covered Year-end) of equity awards outstanding at Covered Year-end that were granted prior to Covered Year |
(284,567 |
) | |||
+ Fair value as of vesting date of equity awards granted and vested in Covered Year |
0 |
||||
+/- Change in fair value (from prior year-end to vest date in Covered Year) of equity awards granted prior to Covered Year that vested in Covered Year |
(7,170 |
) | |||
- Prior year-end fair value of prior-year equity awards forfeited in Covered Year |
(0 |
) | |||
+ Includable dividend equivalents paid on equity awards during Covered Year |
216,553 |
||||
TOTAL ADDED (DEDUCTED) |
(75,184 |
) | |||