Pay vs Performance Disclosure
Dec. 31, 2025
USD ($)
$ / shares
Dec. 31, 2024
USD ($)
$ / shares
Dec. 31, 2023
USD ($)
$ / shares
Dec. 31, 2022
USD ($)
$ / shares
Dec. 31, 2021
USD ($)
$ / shares
| Year | Summary Compensation Table Total for PEO | Compensation Actually Paid to PEO (1) | Average Summary Compensation Table Total for Non-PEO NEOs | Average Compensation Actually Paid to Non-PEO NEOs (1) | Value of Initial Fixed $100 Investment Based On: | Net Income ($000s) | Diluted Earnings Per Share | |||||||||||||||||||
| TSR | Peer Group TSR | |||||||||||||||||||||||||
| 2025 | $ | 3,620,031 | $ | 3,011,220 | $ | 1,356,400 | $ | 1,159,510 | $ | 173 | $ | 146 | $ | 201,374 | $ | 5.31 | ||||||||||
| 2024 | $ | 3,586,197 | $ | 5,829,737 | $ | 1,392,171 | $ | 2,155,594 | $ | 130 | $ | 122 | $ | 185,266 | $ | 4.83 | ||||||||||
| 2023 | $ | 3,445,438 | $ | 2,116,497 | $ | 1,355,463 | $ | 898,728 | $ | 100 | $ | 103 | $ | 194,059 | $ | 5.07 | ||||||||||
| 2022 | $ | 4,160,216 | $ | 4,835,417 | $ | 1,766,407 | $ | 1,995,112 | $ | 108 | $ | 111 | $ | 203,043 | $ | 5.31 | ||||||||||
| 2021 | $ | 2,450,066 | $ | 3,099,999 | $ | 1,045,830 | $ | 1,276,627 | $ | 102 | $ | 130 | $ | 133,055 | $ | 3.86 | ||||||||||
| Compensation Actually Paid to PEO | |||||||||||||||||||||||||||||
| 2025 | 2024 | 2023 | 2022 | 2021 | |||||||||||||||||||||||||
| Total compensation in the Summary Compensation Table | $ | 3,620,031 | $ | 3,586,197 | $ | 3,445,438 | $ | 4,160,216 | $ | 2,450,066 | |||||||||||||||||||
| Deduction for stock award values included in the Summary Compensation Table | (1,307,773) | (1,140,318) | (1,272,594) | (2,080,526) | (777,478) | ||||||||||||||||||||||||
| Deduction for stock option values included in the Summary Compensation Table | (328,046) | (394,300) | (382,804) | (299,997) | (221,873) | ||||||||||||||||||||||||
| Addition for the fair value as of the end of the year of awards granted during the year that are outstanding and unvested at the end of the year | 1,398,252 | 2,612,109 | 1,133,826 | 2,825,436 | 1,370,239 | ||||||||||||||||||||||||
| Change in fair value as of the end of the year, from the end of the prior year, of any awards granted in any prior year that are outstanding and unvested as of the end of the year | (365,966) | 331,899 | (505,980) | 168,262 | 269,631 | ||||||||||||||||||||||||
| Change in fair value as of the vesting date, from the end of the prior year, of awards granted in a prior year that vested in the current year | (5,278) | 834,150 | (301,389) | 62,026 | 87,429 | ||||||||||||||||||||||||
| Subtraction for the prior year fair value of awards granted in a prior year that failed to meet the applicable vesting conditions during the year | — | — | — | — | (78,015) | ||||||||||||||||||||||||
| Compensation Actually Paid | $ | 3,011,220 | $ | 5,829,737 | $ | 2,116,497 | $ | 4,835,417 | $ | 3,099,999 | |||||||||||||||||||
| Average Compensation Actually Paid to Non-PEO NEOs | |||||||||||||||||||||||||||||
| 2025 | 2024 | 2023 | 2022 | 2021 | |||||||||||||||||||||||||
| Total compensation in the Summary Compensation Table | $ | 1,356,400 | $ | 1,392,171 | $ | 1,355,463 | $ | 1,766,407 | $ | 1,045,830 | |||||||||||||||||||
| Deduction for stock award values included in the Summary Compensation Table | (407,607) | (374,019) | (406,492) | (904,799) | (270,804) | ||||||||||||||||||||||||
| Deduction for stock option values included in the Summary Compensation Table | (102,238) | (129,327) | (122,279) | (98,125) | (77,282) | ||||||||||||||||||||||||
| Addition for the fair value as of the end of the year of awards granted during the year that are outstanding and unvested at the end of the year | 435,802 | 856,756 | 362,170 | 1,151,323 | 477,273 | ||||||||||||||||||||||||
| Change in fair value as of the end of the year, from the end of the prior year, of any awards granted in any prior year that are outstanding and unvested as of the end of the year | (121,271) | 143,803 | (185,159) | 58,608 | 94,328 | ||||||||||||||||||||||||
| Change in fair value as of the vesting date, from the end of the prior year, of awards granted in a prior year that vested in the current year | (1,576) | 266,210 | (104,975) | 21,698 | 34,388 | ||||||||||||||||||||||||
| Subtraction for the prior year fair value of awards granted in a prior year that failed to meet the applicable vesting conditions during the year | — | — | — | — | (27,106) | ||||||||||||||||||||||||
| Compensation Actually Paid | $ | 1,159,510 | $ | 2,155,594 | $ | 898,728 | $ | 1,995,112 | $ | 1,276,627 | |||||||||||||||||||
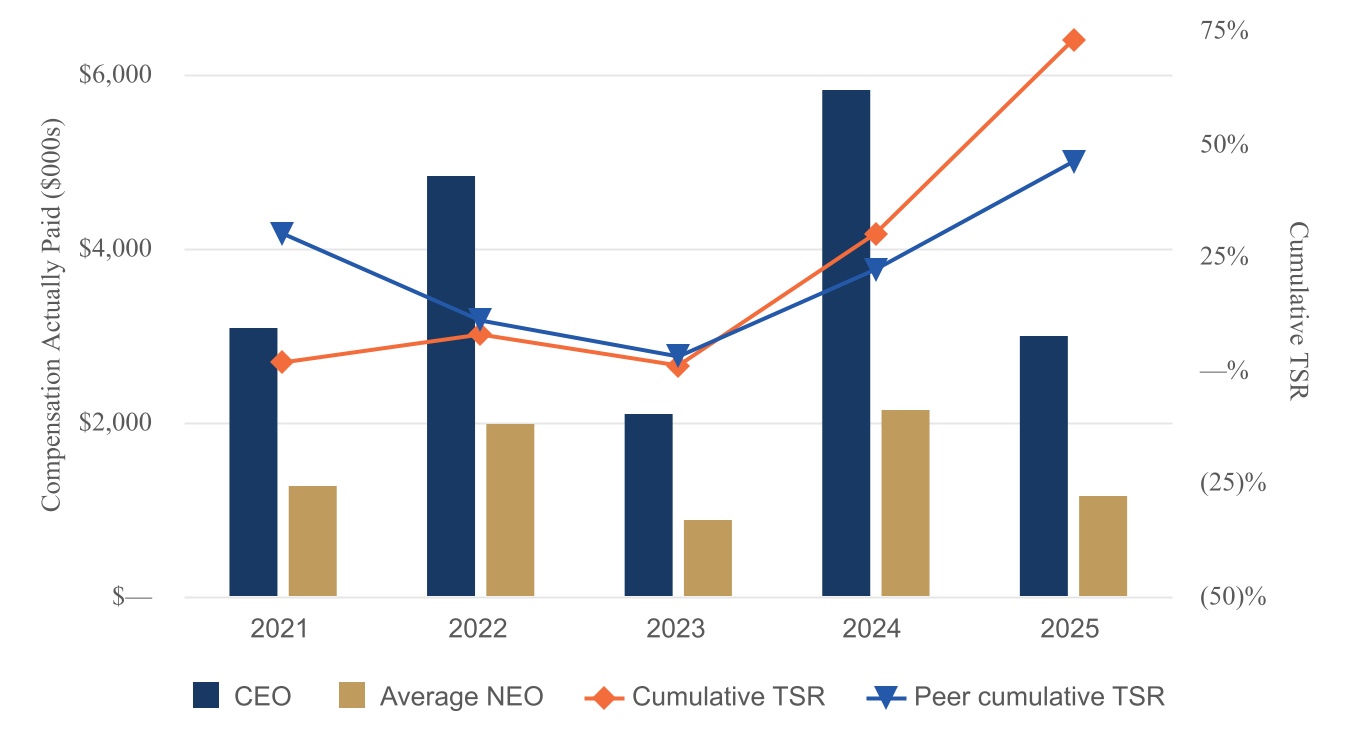
Compensation Actually Paid versus Cumulative TSR
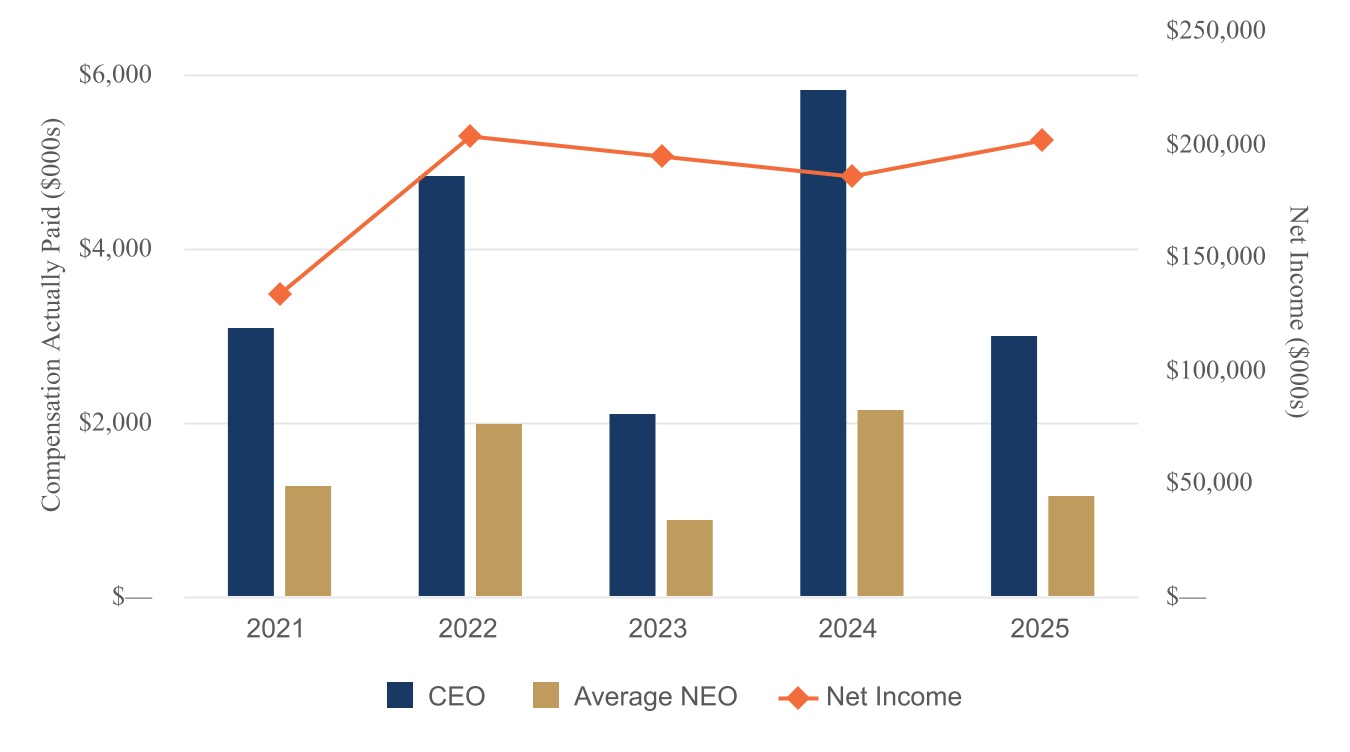
Compensation Actually Paid versus Net Income
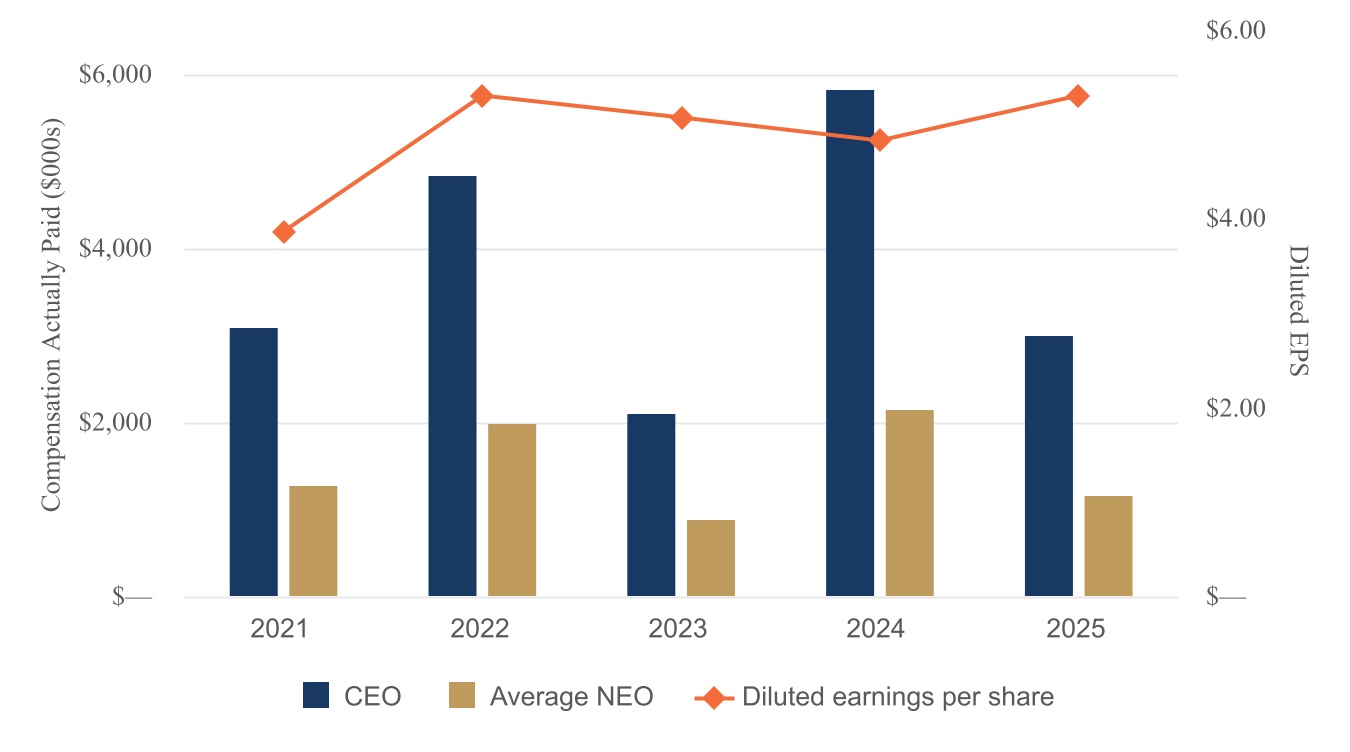
Compensation Actually Paid versus EPS
Compensation Actually Paid versus Cumulative TSR
| Important Financial Performance Measures | ||
| Earnings per share | ||
| Return on average tangible common equity | ||
| Nonperforming assets to total assets | ||
| Loan growth | ||
Our pay for performance philosophy results in a significant portion of total compensation for the NEOs being comprised of performance-based awards with both short and long-term targets. The financial performance metrics used in the performance awards are selected by the Human Capital and Compensation Committee to align compensation with stockholder interests and long-term value creation, while ensuring a competitive wage as compared to our peers. This has resulted in a significant level of compensation at-risk for the NEOs. In 2025, our CEOs and other NEOs total compensation included 73% and 59%, respectively, that was at risk.
Compensation actually paid to our NEOs includes the end-of-year fair value of awards granted during the year, changes in the fair value of awards granted in prior fiscal years, and other changes related to forfeited awards, as applicable.
Select items that impacted compensation actually paid and our financial measures in the table and graph above include:
•In 2021, the Company completed an acquisition that resulted in an additional provision for credit losses and merger expenses for the year. The Company also closed certain branch locations and recognized a related impairment charge. In support of its customers, the Company was an active participant in the Paycheck Protection Program that generated additional interest and fee income on loans. The total stockholder return for the both the Company and the peer index rebounded in 2021 with double digit returns. STIP payouts in 2021 were above target but below exceptional levels and the three-year cumulative LTIP performance payouts were at 59% of target out of a maximum award of 200%. No LTIP shares were awarded based on the three-year cumulative total stockholder return in 2021.
•In 2022, rising interest rates benefited the Company’s asset-sensitive balance sheet, resulting in an increase to net income and EPS. The Company’s total stockholder return increased in 2022, while the peer index declined. STIP payouts in 2022 were at the exceptional level and LTIP performance awards were at 132% of the aggregate target level. As noted in the compensation discussion and analysis, the NEOs also received a one-time Special Award in 2022 to increase retention.
•In 2023, net interest income continued to expand due to organic growth and an increase in market interest rates. In the industry, three large regional banks failed at the beginning of the year. The rise in short-term rates and robust deposit competition after the bank failures increased deposit costs. The provision for credit losses increased from a historically low level in 2022 and noninterest expense expanded due to higher deposit servicing costs and employee compensation and benefits. The total stockholder return for both the Company and the peer index were negative in 2023 as a result of the market disruption following the bank failures. STIP payments in 2023 were below the exceptional level due to the decline in EPS in 2023 from 2022. The LTIP performance awards were at 169% of the aggregate target level and were reflective of the three-year cumulative EPS and TSR targets.
•In 2024, organic growth and an increased yield on interest-earning assets was partially offset by the rise in short-term interest rates in 2024 that increased the cost of deposits and other interest-bearing liabilities. In the fourth quarter 2024, the Federal Reserve decreased the target federal funds rate 100 basis points, following a 100 basis points increase in 2023. The provision for credit losses decreased in 2024 primarily due to improved credit quality, including a reduction in net charge-offs. Noninterest expense increased primarily due to compensation and benefits (annual merit increases and the recruitment of new relationship bankers), deposit servicing costs, and expenses related to a core system conversion. Total stockholder return for the Company surpassed the peer index with both indices achieving double digit returns. STIP payments in 2024 were below the exceptional level primarily due to lower than planned loan growth. The LTIP performance awards were at 181% of the aggregate target level and were reflective of the three-year cumulative EPS and TSR targets.
•In 2025, the Company grew net interest income from a combination of strong deposit growth, higher investment balances and a favorable spread on acquired loans and deposits, partially offset by lower interest rates paid on interest-earning assets. Nonperforming assets increased in 2025 primarily related to seven commercial real estate loans to special purpose entities affiliated with two commercial banking relationships in Southern California that share some common ownership. In the fourth quarter 2025, six of the seven properties serving as collateral for the loans had been transferred into other real-estate owned with a net gain. Total stockholder return for the Company surpassed the peer index by over 25% for the cumulative five-year return. STIP payments in 2025 were between the target and exceptional level primarily due to the increase in nonperforming assets. The LTIP performance awards were at 74% of the aggregate target level and were reflective of the three-year cumulative EPS and TSR targets.