Pay vs Performance Disclosure - USD ($)
Dec. 31, 2025
Dec. 31, 2024
Dec. 31, 2023
Dec. 31, 2022
Dec. 31, 2021
As required by Section 953(a) of the Dodd-Frank Wall Street Reform and Consumer Protection Act and Item 402(v) of SEC Regulation S-K, Arcosa is providing the information below, including a table disclosing specified executive compensation and financial performance measures for the five most recently completed fiscal years.
Summary Compensation Table Total to PEO ($)(1) | Compensation Actually Paid to PEO ($)(1)(5) | Average Summary Compensation Table Total to Non-PEO NEOs ($)(2) | Average Compensation Actually Paid to Non-PEO NEOs ($)(2)(6) | Value of Initial Fixed $100 Investment Based On: | Net Income ($)(4) | Company Selected Measure: Adjusted EBITDA ($)(7) | ||||||||||||||||||||
| Year | Company TSR ($) | Peer Group TSR(3) ($) | ||||||||||||||||||||||||
| 2025 | 8,092,216 | 10,588,863 | 2,253,482 | 2,822,713 | 196 | 239 | 208,400,000 | 583,300,000 | ||||||||||||||||||
| 2024 | 7,296,479 | 13,935,808 | 1,806,200 | 3,061,030 | 178 | 217 | 93,700,000 | 447,000,000 | ||||||||||||||||||
| 2023 | 6,474,120 | 16,822,141 | 2,192,382 | 3,890,255 | 152 | 174 | 159,200,000 | 367,600,000 | ||||||||||||||||||
| 2022 | 6,322,796 | 8,628,851 | 1,540,270 | 1,742,629 | 100 | 115 | 245,800,000 | 325,100,000 | ||||||||||||||||||
| 2021 | 5,632,354 | 6,069,101 | 1,041,392 | 811,732 | 96 | 144 | 69,600,000 | 283,300,000 | ||||||||||||||||||
(1) Mr. Carrillo is the PEO, the principal executive officer, reflected in the columns above.
(2) The non-PEO named executive officers ("Non-PEO NEOs") reflected in the columns above represent Messrs. Beasley (Former CFO 2018-2021), Cole, Collins, Essl, and Stevenson, and Ms. Peck for 2021; and Messrs. Cole, Collins, Essl, and Stevenson, and Ms. Peck for 2022, 2023, 2024, and 2025.
(3) The "Peer Group" is the Russell 3000 Index Construction and Materials Sector.
(4) 2022 Adjusted Net Income is $106.8M, which is adjusted for the gain on the sale of the Storage Tanks business, net of taxes, and impact of acquisition and divestiture related expenses, net of taxes.
(5) The following table provides the Compensation Actually Paid (CAP) to the PEO in 2025:
| Year | 2025 ($) | |||||||
| Summary Compensation Total | 8,092,216 | |||||||
| - Grant Date Fair Value of Stock Awards Granted in Fiscal Year | (5,127,741) | |||||||
| + Fair Value of Stock Awards Granted in the Year | 7,049,768 | |||||||
| + Year over Year Change in Fair Value of Outstanding and Unvested Stock Awards | 2,152,147 | |||||||
| + Year over Year Change in Fair Value of Stock Awards Granted in Prior Years that Vested in the Year | (1,587,485) | |||||||
| + Fair Value at the End of the Prior Year of Stock Awards that Failed to Meet Vesting Conditions in the Year | — | |||||||
| + Value of Dividends Paid on Stock Awards not Otherwise reflected in Fair Value or Total Compensation | 9,958 | |||||||
Compensation Actually Paid (a) | 10,588,863 | |||||||
(a) Reflects the value of equity calculated in accordance with the SEC methodology for determining CAP for each year shown. Details of each of the adjustments as required by item 402(v)(2)(iii)(C)(1)(i) – (vi) are shown in the table.
(6) The following table provides the average Compensation Actually Paid (CAP) to Non-PEO NEOs in 2025:
| Year | 2025 ($) | |||||||
| Summary Compensation Total | 2,253,482 | |||||||
| - Grant Date Fair Value of Stock Awards Granted in Fiscal Year | (1,066,098) | |||||||
| + Fair Value of Stock Awards Granted in the Year | 1,508,011 | |||||||
| + Year over Year Change in Fair Value of Outstanding and Unvested Stock Awards | 399,408 | |||||||
| + Year over Year Change in Fair Value of Stock Awards Granted in Prior Years that Vested in the Year | (275,644) | |||||||
| + Fair Value at the End of the Prior Year of Stock Awards that Failed to Meet Vesting Conditions in the Year | — | |||||||
| + Value of Dividends Paid on Stock Awards not Otherwise reflected in Fair Value or Total Compensation | 3,554 | |||||||
Compensation Actually Paid (a) | 2,822,713 | |||||||
(a) Reflects the value of equity calculated in accordance with the SEC methodology for determining CAP. Details of each of the adjustments as required by item 402(v)(2)(iii)(C)(1)(i) – (vi) are shown in the table.
(7) See Annex A for a reconciliation of Non-GAAP measures to the most comparable GAAP measures.
| Year | 2025 ($) | |||||||
| Summary Compensation Total | 8,092,216 | |||||||
| - Grant Date Fair Value of Stock Awards Granted in Fiscal Year | (5,127,741) | |||||||
| + Fair Value of Stock Awards Granted in the Year | 7,049,768 | |||||||
| + Year over Year Change in Fair Value of Outstanding and Unvested Stock Awards | 2,152,147 | |||||||
| + Year over Year Change in Fair Value of Stock Awards Granted in Prior Years that Vested in the Year | (1,587,485) | |||||||
| + Fair Value at the End of the Prior Year of Stock Awards that Failed to Meet Vesting Conditions in the Year | — | |||||||
| + Value of Dividends Paid on Stock Awards not Otherwise reflected in Fair Value or Total Compensation | 9,958 | |||||||
Compensation Actually Paid (a) | 10,588,863 | |||||||
| Year | 2025 ($) | |||||||
| Summary Compensation Total | 2,253,482 | |||||||
| - Grant Date Fair Value of Stock Awards Granted in Fiscal Year | (1,066,098) | |||||||
| + Fair Value of Stock Awards Granted in the Year | 1,508,011 | |||||||
| + Year over Year Change in Fair Value of Outstanding and Unvested Stock Awards | 399,408 | |||||||
| + Year over Year Change in Fair Value of Stock Awards Granted in Prior Years that Vested in the Year | (275,644) | |||||||
| + Fair Value at the End of the Prior Year of Stock Awards that Failed to Meet Vesting Conditions in the Year | — | |||||||
| + Value of Dividends Paid on Stock Awards not Otherwise reflected in Fair Value or Total Compensation | 3,554 | |||||||
Compensation Actually Paid (a) | 2,822,713 | |||||||
(a) Reflects the value of equity calculated in accordance with the SEC methodology for determining CAP. Details of each of the adjustments as required by item 402(v)(2)(iii)(C)(1)(i) – (vi) are shown in the table.
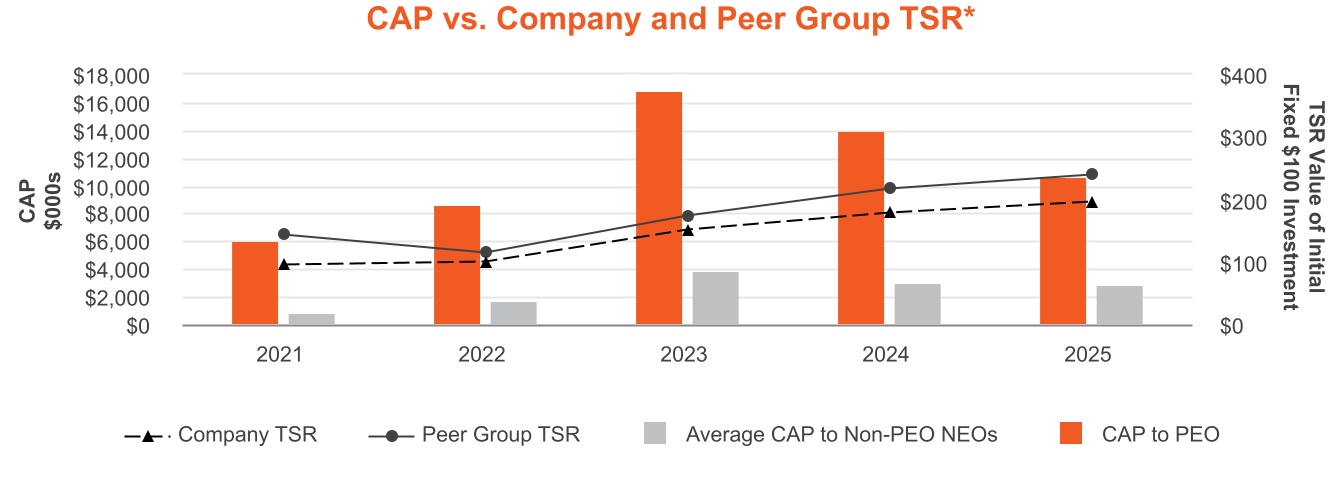
*The value of initial Fixed $100 investment based on TSR.
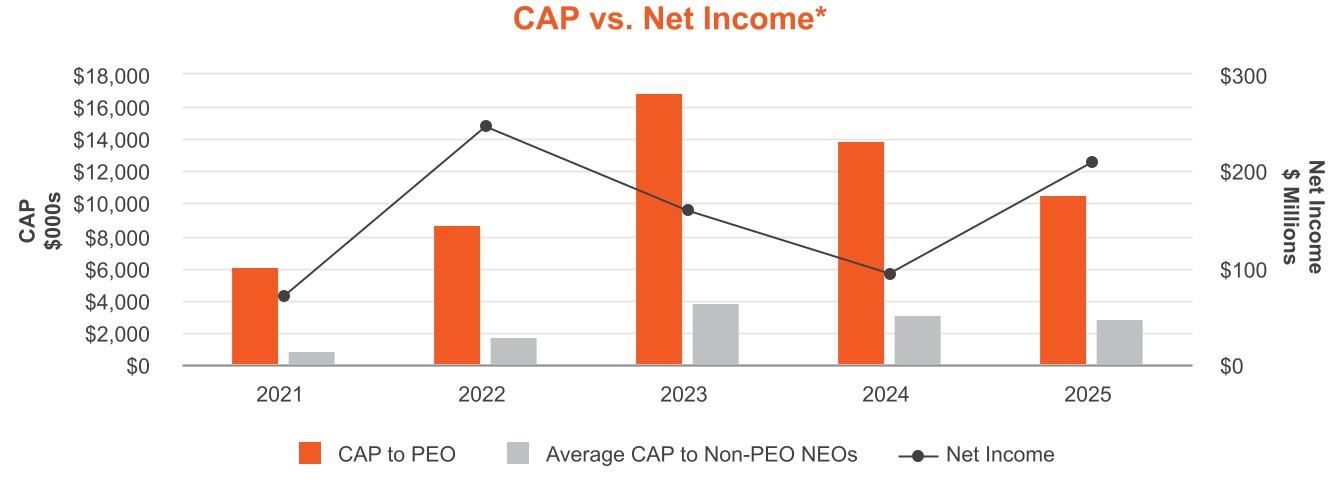
* 2022 Adjusted Net Income is $106.8M, which is adjusted for the gain on the sale of the Storage Tanks business, net of taxes, and impact of acquisition and divestiture related expenses, net of taxes.
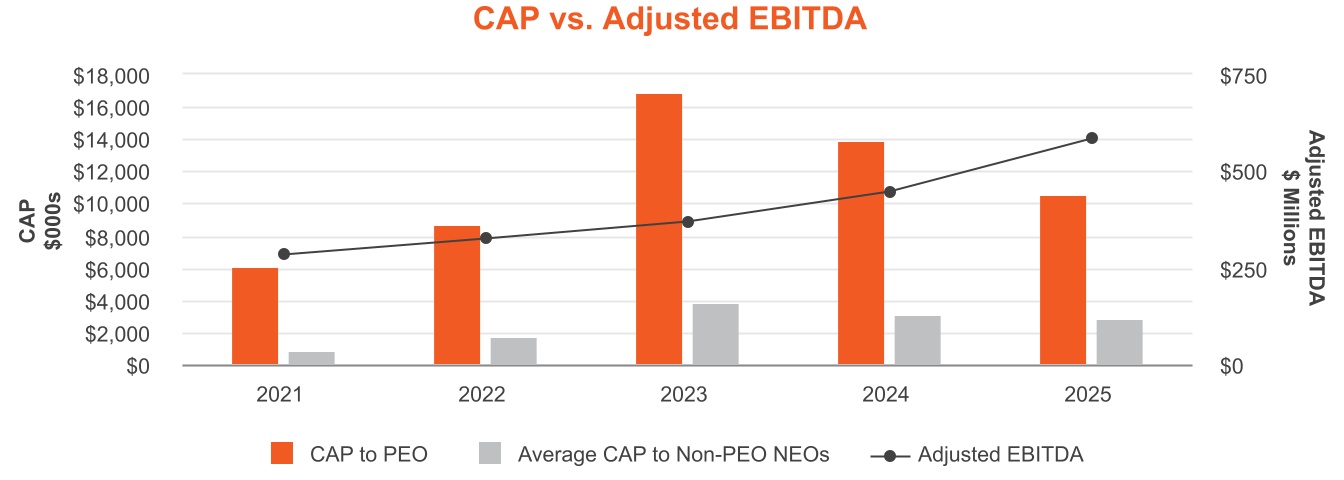
The following charts provide a graphical depiction of the relationship between the CAP and the selected financial measures in addition to the relationship between Arcosa and the Peer Group's TSR. The 2021 CAP to Non-PEO NEOs reflects the forfeiture of Mr. Beasley’s 2021 stock award upon his departure from Arcosa, causing a decrease in the average CAP for the Non-PEO NEOs for 2021. The 2023 and 2024 CAP for both the PEO and the Non-PEO NEOs in each of the charts reflects an increase in stock price and an increase in the estimated performance of outstanding PBRSUs. The 2023 and 2024 average CAP to Non-PEO NEOs also includes the increase in value of the one-time retention equity grant made to Mr. Essl and Ms. Peck.