Pay vs Performance Disclosure
number in Millions
number in Millions
Dec. 31, 2025
USD ($)
Dec. 31, 2024
USD ($)
Dec. 31, 2023
USD ($)
Dec. 31, 2022
USD ($)
Dec. 31, 2021
USD ($)
The following table sets forth information with respect to the relationship between “compensation actually paid” to our NEOs, as calculated in accordance with Item 402(v) of Regulation S-K, during the years ended December 31, 2025, 2024, 2023, 2022 and 2021 and certain measures of Akamai’s financial performance:
| Year | Summary Compensation Table Total for PEO ($)(1) | Compensation Actually Paid to PEO ($)(2) | Average Summary Compensation Table Total for Non-PEO NEOs ($)(3) | Average Compensation Actually Paid to Non-PEO NEOs ($)(4) | Value of Initial Fixed $100 Investment Based On: | Net Income (in millions) ($)(7) | Revenue (adjusted for foreign exchange) (millions)(8) | |||||||||||||||||||
| Total Shareholder Return ($)(5) | Peer Group Total Shareholder Return ($)(6) | |||||||||||||||||||||||||
| (a) | (b) | (c) | (d) | (e) | (f) | (g) | (h) | (i) | ||||||||||||||||||
| 2025 | 15,954,172 | 12,405,175 | 6,173,737 | 4,953,935 | 83 | 258 | 452 | 4,138 | ||||||||||||||||||
| 2024 | 15,064,923 | 1,715,819 | 5,525,306 | 948,813 | 91 | 208 | 505 | 4,033 | ||||||||||||||||||
| 2023 | 13,384,975 | 26,216,684 | 5,081,479 | 9,458,077 | 113 | 152 | 548 | 3,819 | ||||||||||||||||||
| 2022 | 11,982,771 | 3,458,806 | 4,380,444 | 1,992,238 | 80 | 97 | 524 | 3,611 | ||||||||||||||||||
| 2021 | 11,951,574 | 15,731,346 | 4,290,989 | 3,045,520 | 111 | 135 | 652 | 3,340 | ||||||||||||||||||
(2)The dollar amounts reported in column (c) represent the amount of “compensation actually paid” to Dr. Leighton, as computed in accordance with Item 402(v) of Regulation S-K. The dollar amounts do not reflect the actual amount of compensation earned by or paid to Dr. Leighton during the applicable year. In accordance with the requirements of Item 402(v) of Regulation S-K, the following adjustments were made to Dr. Leighton’s total compensation for each year to determine the compensation actually paid:
| PEO | 2025 | 2024 | 2023 | 2022 | 2021 | ||||||||||||
| Summary Compensation Table (“SCT”) Total | 15,954,172 | 15,064,923 | 13,384,975 | 11,982,771 | 11,951,574 | ||||||||||||
Subtract: grant date fair values of equity awards reported in “Stock Awards” column of the SCT for the covered fiscal year (“FY”) | (15,954,171) | (15,064,922) | (13,384,974) | (11,982,770) | (11,951,573) | ||||||||||||
Add: fair values as of the end of the covered FY of all equity awards granted during the covered FY that are outstanding and unvested as of the end of such covered FY | 16,059,626 | 10,455,199 | 20,398,512 | 8,045,760 | 11,728,701 | ||||||||||||
Add: the change in fair value (whether positive or negative) as of the end of the covered FY of any equity awards granted in any prior FY that are outstanding and unvested as of the end of such covered FY | (5,434,677) | (8,781,847) | 4,190,798 | (4,463,964) | 354,691 | ||||||||||||
Add: for awards that are granted and vest in the same FY, the fair value as of the vesting date | 2,268,956 | 1,088,508 | 2,340,475 | 929,828 | 2,104,593 | ||||||||||||
Add: the change in fair value (whether positive or negative) as of the vesting date (from the end of the prior FY) of any awards granted in any prior FY for which all applicable vesting conditions were satisfied at the end of or during the covered FY | (488,731) | (1,046,042) | (713,102) | (1,052,819) | 1,543,360 | ||||||||||||
Subtract: for any awards granted in any prior FY that failed to meet the applicable vesting conditions during the covered FY, the fair value at the end of the prior FY | 0 | 0 | 0 | 0 | 0 | ||||||||||||
| Compensation Actually Paid to PEO | 12,405,175 | 1,715,819 | 26,216,684 | 3,458,806 | 15,731,346 | ||||||||||||
(4)The dollar amounts reported in column (e) represent the average amount of “compensation actually paid” to the NEOs as a group (excluding Dr. Leighton), as computed in accordance with Item 402(v) of Regulation S-K. The dollar amounts do not reflect the actual amount of compensation earned by or paid to the NEOs during the applicable year. In accordance with the requirements of Item 402(v) of Regulation S-K, the following adjustments were made to the average total compensation of the NEOs as a group (other than Dr. Leighton) for each year to determine the compensation actually paid:
| Non-PEO NEOs | 2025 | 2024 | 2023 | 2022 | 2021 | ||||||||||||
| Average Summary Compensation Table Total | 6,173,737 | 5,525,306 | 5,081,479 | 4,380,444 | 4,290,989 | ||||||||||||
Subtract: average grant date fair values of equity awards reported in “Stock Awards” column of the SCT for the covered FY | (5,634,194) | (5,003,517) | (4,564,229) | (3,864,492) | (3,775,373) | ||||||||||||
Add: average fair value as of the end of the covered FY of all equity awards granted during the covered FY that are outstanding and unvested as of the end of such covered FY | 5,743,998 | 3,485,302 | 7,110,263 | 2,574,199 | 2,642,420 | ||||||||||||
Add: the average change in fair value (whether positive or negative) as of the end of the covered FY of any equity awards granted in any prior FY that are outstanding and unvested as of the end of such covered FY | (1,897,163) | (3,096,499) | 1,286,940 | (1,161,319) | 74,157 | ||||||||||||
Add: for awards that are granted and vest in the same FY, the average fair value as of the vesting date | 735,425 | 342,574 | 730,130 | 289,287 | 686,227 | ||||||||||||
Add: the average change in fair value (whether positive or negative) as of the vesting date of any awards granted in any prior FY for which all applicable vesting conditions were satisfied at the end of or during the covered FY | (167,869) | (304,353) | (186,506) | (225,881) | 387,129 | ||||||||||||
Subtract: for any awards granted in any prior FY that failed to meet the applicable vesting conditions during the covered FY, the average fair value at the end of the prior FY | 0 | 0 | 0 | 0 | (1,260,029) | ||||||||||||
| Average Compensation Actually Paid to Non-PEO NEOs | 4,953,935 | 948,813 | 9,458,077 | 1,992,238 | 3,045,520 | ||||||||||||
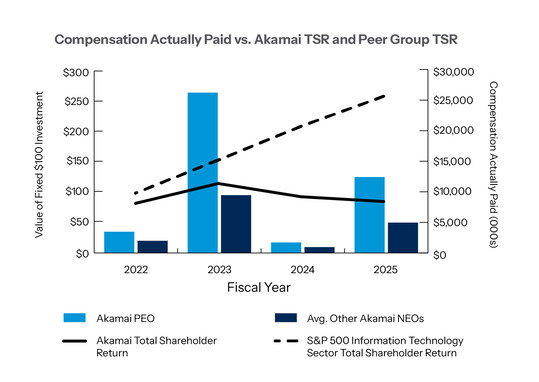
Compensation Actually Paid and Cumulative TSR
The following graph shows the relationship between the amount of compensation actually paid to Dr. Leighton and the average amount of compensation actually paid to the Company’s other NEOs as a group (in each case, as computed in accordance with Item 402(v) of Regulation S-K) and the Company’s cumulative TSR over the five years presented in the Pay Versus Performance table as well as the Company’s peer group TSR over the five years presented in the Pay Versus Performance table.
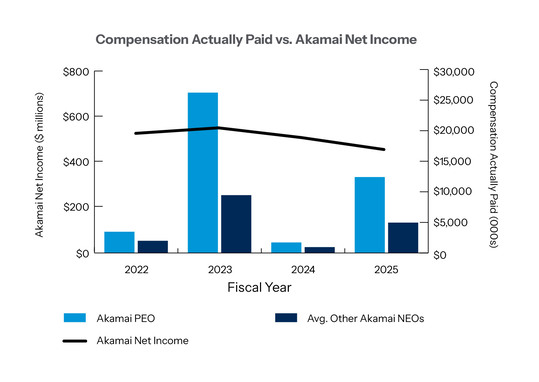
Compensation Actually Paid and Net Income
The following graph shows the relationship between the amount of compensation actually paid to Dr. Leighton and the average amount of compensation actually paid to the Company’s other NEOs as a group (in each case, as computed in accordance with Item 402(v) of Regulation S-K) and the Company’s net income over the five years presented in the Pay Versus Performance table. The Company does not use net income as a performance measure in its executive compensation program.
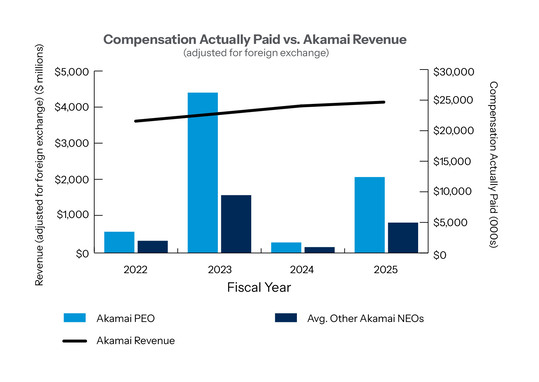
Compensation Actually Paid and Revenue (adjusted for foreign exchange)
The following graph shows the relationship between the amount of compensation actually paid to Dr. Leighton and the average amount of compensation actually paid to the Company’s other NEOs as a group (in each case, as computed in accordance with Item 402(v) of Regulation S-K) and the Company’s revenue (adjusted for foreign exchange) over the five years presented in the Pay Versus Performance table.
Compensation Actually Paid and Cumulative TSR
The following graph shows the relationship between the amount of compensation actually paid to Dr. Leighton and the average amount of compensation actually paid to the Company’s other NEOs as a group (in each case, as computed in accordance with Item 402(v) of Regulation S-K) and the Company’s cumulative TSR over the five years presented in the Pay Versus Performance table as well as the Company’s peer group TSR over the five years presented in the Pay Versus Performance table.
Financial Performance Measures
The metrics that the Company uses for both our long-term and short-term incentive awards are selected based on an objective of incentivizing our NEOs to increase long-term value of the Company for our shareholders. The most important financial performance measures used by the Company to link executive compensation actually paid (as computed in accordance with Item 402(v) of Regulation S-K) to the Company’s NEOs, for the most recently completed fiscal year, to the Company’s performance are as follows:
•Revenue (adjusted for foreign exchange);
•Non-GAAP earnings per share; and
•Non-GAAP operating income.
(8)The dollar amounts reported represent the amount of revenue (adjusted for foreign exchange), which is defined as revenue calculated in accordance with GAAP, adjusted for the impact of fluctuations in foreign exchange rates and other non-recurring or unusual items that may arise from time to time. While the Company uses numerous financial and non-financial performance measures for the purpose of evaluating performance for the Company’s compensation programs, the Company has determined that revenue, as adjusted for foreign exchange, is the financial performance measure that, in the Company’s assessment, represents the most important financial performance measure that is not otherwise required to be disclosed in the Pay Versus Performance table used by the Company to link compensation actually paid to the Company’s NEOs (as computed in accordance with Item 402(v) of Regulation S-K), for the most recently completed fiscal year, to Company performance. The Company utilizes revenue, as adjusted for foreign exchange, as a performance metric in the Company’s short-term incentive compensation program, as well as for the PRSUs that are awarded to the NEOs.