v3.26.1
Pay vs Performance Disclosure
12 Months Ended
Dec. 31, 2025
USD ($)
Dec. 31, 2024
USD ($)
Dec. 31, 2023
USD ($)
Dec. 31, 2022
USD ($)
Dec. 31, 2021
USD ($)
Pay vs Performance Disclosure          
Pay vs Performance Disclosure, Table

As described in greater detail in “Executive Compensation – Compensation Discussion and Analysis,” our executive compensation program reflects a variable pay-for-performance philosophy. The following table and related disclosures provide further “pay versus performance” disclosure with respect to our chief executive officer, also referred to as our principal executive officer (PEO), and our other named executive officers (NEOs), as contemplated by Item 402(v) of Regulation S-K.

Year

Summary Compensation Table Total to PEO1


Compensation Actually Paid to PEO2


Average Summary Compensation Table Total For Non-PEO NEOs3


Average Compensation Actually Paid to Non-PEO NEOs4


Value of Initial Fixed $100 Investment Based On:


Net Income (millions)7


Year-Over-Year CV Bookings Growth8


Company TSR5


Peer Group TSR6


(a)

(b)


(c)


(d)


(e)


(f)


(g)


(h)


(i)

2025

$

673,332


$

673,332


$

1,063,798


$

462,942


$

19


$

141


$

-119.4


-5.7%

2024

$

215,293


$

215,293


$

970,804


$

432,335


$

37


$

118


$

-5.7


-5.3%

2023

$

244,921


$

244,921


$

1,655,159


$

1,073,951


$

64


$

119


$

3.1


-7.7%

2022

$

992,630


$

992,630


$

978,306


$

449,918


$

85


$

98


$

21.8


0.8%

2021

$

1,552,268


$

1,552,268


$

1,134,598


$

1,324,876


$

140


$

127


$

24.8


16.0%


(1)
The dollar amounts reported in column (b) are the amounts of total compensation reported for Mr. Colony (our Chief Executive Officer or PEO) for each corresponding year in the “Total” column of the Summary Compensation Table. Refer to “Executive Compensation –Summary Compensation Table.”
(2)
The dollar amounts reported in column (c) represent the amount of “compensation actually paid” to Mr. Colony, as computed in accordance with Item 402(v) of Regulation S-K. Because Mr. Colony did not receive or hold any equity awards during the years reflected in the table and we do not maintain a pension in which Mr. Colony participates, no additions or deductions from Summary Compensation Table (SCT) total compensation for our PEO are needed to determine the amount of “compensation actually paid” in accordance with Item 402(v) of Regulation S-K.
(3)
The dollar amounts reported in column (d) represent the average of the amounts reported for the Company’s named executive officers (NEOs) as a group (excluding Mr. Colony, who has served as our CEO in each of the covered years) in the “Total” column of the Summary Compensation Table in each applicable year. The names of each of the NEOs (excluding Mr. Colony) included for purposes of calculating the average amounts in each applicable year are as follow: (i) for 2025, Ryan Darrah, L. Christian Finn, Carrie Johnson, Sharyn Leaver, and Nate Swan; (ii) for 2023 and 2024, L. Christian Finn, Carrie Johnson, Sharyn Leaver, and Nate Swan; (iii) for 2022, L. Christian Finn, Kelley Hippler, Carrie Johnson, Sharyn Leaver, and Sarah Le Roy; and (iv) for 2021, Scott Chouinard, Ryan Darrah, Michael Doyle, L. Christian Finn, Kelley Hippler, and Carrie Johnson.
(4)
The dollar amounts reported in column (e) represent the average amount of “compensation actually paid” (CAP) to the NEOs as a group (excluding Mr. Colony), as computed in accordance with Item 402(v) of Regulation S-K. The dollar amounts do not reflect the average amount of compensation earned by or paid to the NEOs as a group (excluding Mr. Colony) during the applicable year. In accordance with the requirements of Item 402(v) of Regulation S-K, the following adjustments were made to the average compensation for the NEOs as a group (excluding Mr. Colony) for each year to determine the compensation actually paid:


Average Non-PEO NEOs SCT Total to CAP Reconciliation:


Year

Salary


Bonus and Non-Equity Incentive Compensation


Other Compensation


SCT Total


Reported Value of Equity Awards


Equity Award Adjustments


CAP


(i)


(ii)


(iii)


2025

$

406,322


$

59,842


$

13,562


$

1,063,798


$

(585,517

)

$

(15,339

)

$

462,942


2024

$

410,319


$

80,645


$

17,357


$

970,804


$

(462,483

)

$

(75,986

)

$

432,335


2023

$

408,008


$

144,723


$

16,928


$

1,655,159


$

(1,085,500

)

$

504,291


$

1,073,951


2022

$

355,306


$

149,711


$

8,317


$

978,306


$

(464,972

)

$

(63,417

)

$

449,918


2021

$

290,528


$

376,641


$

104,942


$

1,134,598


$

(362,487

)

$

552,765


$

1,324,876


(i)
Reflects "all other compensation" reported in the SCT for each year shown.
(ii)
Represents the grant date fair value of equity-based awards granted each year as reported in the “Stock Awards” and "Option Awards" columns in the Summary Compensation Table for the applicable year. Because we do not maintain a pension in
which any NEO participates, no adjustments from the SCT total related to pension value are needed to calculate “compensation actually paid” in accordance with Item 402(v) of Regulation S-K.
(iii)
The equity award adjustments for each applicable year include the addition (or subtraction, as applicable) of the following: (i) the year-end fair value of any equity awards granted in the applicable year that are outstanding and unvested as of the end of the year; (ii) the amount of change as of the end of the applicable year (from the end of the prior fiscal year) in fair value of any awards granted in prior years that are outstanding and unvested as of the end of the applicable year; (iii) for awards that are granted and vest in same applicable year, the fair value as of the vesting date; (iv) for awards granted in prior years that vest in the applicable year, the amount equal to the change as of the vesting date (from the end of the prior fiscal year) in fair value; (v) for awards granted in prior years that are determined to fail to meet the applicable vesting conditions during the applicable year, a deduction for the amount equal to the fair value at the end of the prior fiscal year; and (vi) the dollar value of any dividends or other earnings paid on awards in the applicable year prior to the vesting date that are not otherwise reflected in the fair value of such award or included in any other component of total compensation for the applicable year. The valuation assumptions used to calculate fair values did not materially differ from those disclosed at the time of grant. The amounts deducted or added in calculating the equity award adjustments are as follows:


Average Non-PEO NEOs Equity Award Adjustments:


2021 Average


2022 Average


2023 Average


2024 Average


2025 Average


Plus: Fair Value for Stock Awards Granted in the Covered Year that are Unvested at End of Year

$

450,772


$

257,486


$

610,348


$

347,917


$

279,050


Change in Fair Value of Outstanding Unvested Stock Awards from Prior Year

$

121,557


$

(152,787

)

$

(85,607

)

$

(334,414

)

$

(148,321

)

Change in Fair Value of Stock Awards from Prior Years that Vested in the Covered Year

$

27,727


$

(71,058

)

$

(20,451

)

$

(89,489

)

$

(65,488

)

Less: Fair Value of Stock Awards Forfeited during the Covered Year

$

(47,291

)

$

(97,057

)

-


-


$

(80,580

)

Total Adjustment

$

552,765


$

(63,417

)

$

504,291


$

(75,986

)

$

(15,339

)


(5)
Company TSR is calculated to show the cumulative stockholder return on our common stock during the covered period. We did not pay any dividends in the covered years.
(6)
Represents the weighted peer group TSR, weighted according to the respective companies’ stock market capitalization at the beginning of each period for which a return is indicated. The peer group used for this purpose is the following published industry index: S&P Small Cap 600 Information Technology.
(7)
The dollar amounts reported represent the amount of net income reflected in our audited financial statements for the applicable year.
(8)
Year-over-year CV bookings growth is the percentage increase in bookings of our CV products with respect to a given covered year compared to the prior covered year. For purposes of calculating the 2024 amount, we have excluded CV bookings attributable to our former FeedbackNow business that was divested in August 2024.


Financial Performance Measures


As described in greater detail in “Executive Compensation – Compensation Discussion and Analysis,” our executive compensation program reflects a variable pay-for-performance philosophy. The most important financial performance measures we used to link executive compensation actually paid to our NEOs, for the most recently completed fiscal year, to our performance are as follows:

CV Bookings
Modified Operating Income
Year-Over-Year CV Bookings Growth

Analysis of the Information Presented in the Pay versus Performance Table

While we utilize several performance measures to align executive compensation with our performance, all of these measures are not presented in the above Pay versus Performance Table. Moreover, we generally seek to incentivize long-term performance, and therefore do not specifically align our performance measures with compensation that is actually paid (as computed in accordance with Item 402(v) of Regulation S-K) for a particular year. In accordance with Item 402(v) of Regulation S-K, we are providing the following descriptions of the relationships between information presented in the Pay versus Performance Table.

       
Company Selected Measure Name   Year-Over-Year CV Bookings Growth      
Named Executive Officers, Footnote
(1)
The dollar amounts reported in column (b) are the amounts of total compensation reported for Mr. Colony (our Chief Executive Officer or PEO) for each corresponding year in the “Total” column of the Summary Compensation Table. Refer to “Executive Compensation –Summary Compensation Table.”
       
Peer Group Issuers, Footnote
(6)
Represents the weighted peer group TSR, weighted according to the respective companies’ stock market capitalization at the beginning of each period for which a return is indicated. The peer group used for this purpose is the following published industry index: S&P Small Cap 600 Information Technology.
       
PEO Total Compensation Amount $ 673,332 $ 215,293 $ 244,921 $ 992,630 $ 1,552,268
PEO Actually Paid Compensation Amount $ 673,332 215,293 244,921 992,630 1,552,268
Adjustment To PEO Compensation, Footnote
(2)
The dollar amounts reported in column (c) represent the amount of “compensation actually paid” to Mr. Colony, as computed in accordance with Item 402(v) of Regulation S-K. Because Mr. Colony did not receive or hold any equity awards during the years reflected in the table and we do not maintain a pension in which Mr. Colony participates, no additions or deductions from Summary Compensation Table (SCT) total compensation for our PEO are needed to determine the amount of “compensation actually paid” in accordance with Item 402(v) of Regulation S-K.
       
Non-PEO NEO Average Total Compensation Amount $ 1,063,798 970,804 1,655,159 978,306 1,134,598
Non-PEO NEO Average Compensation Actually Paid Amount $ 462,942 432,335 1,073,951 449,918 1,324,876
Adjustment to Non-PEO NEO Compensation Footnote
(4)
The dollar amounts reported in column (e) represent the average amount of “compensation actually paid” (CAP) to the NEOs as a group (excluding Mr. Colony), as computed in accordance with Item 402(v) of Regulation S-K. The dollar amounts do not reflect the average amount of compensation earned by or paid to the NEOs as a group (excluding Mr. Colony) during the applicable year. In accordance with the requirements of Item 402(v) of Regulation S-K, the following adjustments were made to the average compensation for the NEOs as a group (excluding Mr. Colony) for each year to determine the compensation actually paid:

Average Non-PEO NEOs SCT Total to CAP Reconciliation:


Year

Salary


Bonus and Non-Equity Incentive Compensation


Other Compensation


SCT Total


Reported Value of Equity Awards


Equity Award Adjustments


CAP


(i)


(ii)


(iii)


2025

$

406,322


$

59,842


$

13,562


$

1,063,798


$

(585,517

)

$

(15,339

)

$

462,942


2024

$

410,319


$

80,645


$

17,357


$

970,804


$

(462,483

)

$

(75,986

)

$

432,335


2023

$

408,008


$

144,723


$

16,928


$

1,655,159


$

(1,085,500

)

$

504,291


$

1,073,951


2022

$

355,306


$

149,711


$

8,317


$

978,306


$

(464,972

)

$

(63,417

)

$

449,918


2021

$

290,528


$

376,641


$

104,942


$

1,134,598


$

(362,487

)

$

552,765


$

1,324,876


(i)
Reflects "all other compensation" reported in the SCT for each year shown.
(ii)
Represents the grant date fair value of equity-based awards granted each year as reported in the “Stock Awards” and "Option Awards" columns in the Summary Compensation Table for the applicable year. Because we do not maintain a pension in
which any NEO participates, no adjustments from the SCT total related to pension value are needed to calculate “compensation actually paid” in accordance with Item 402(v) of Regulation S-K.
(iii)
The equity award adjustments for each applicable year include the addition (or subtraction, as applicable) of the following: (i) the year-end fair value of any equity awards granted in the applicable year that are outstanding and unvested as of the end of the year; (ii) the amount of change as of the end of the applicable year (from the end of the prior fiscal year) in fair value of any awards granted in prior years that are outstanding and unvested as of the end of the applicable year; (iii) for awards that are granted and vest in same applicable year, the fair value as of the vesting date; (iv) for awards granted in prior years that vest in the applicable year, the amount equal to the change as of the vesting date (from the end of the prior fiscal year) in fair value; (v) for awards granted in prior years that are determined to fail to meet the applicable vesting conditions during the applicable year, a deduction for the amount equal to the fair value at the end of the prior fiscal year; and (vi) the dollar value of any dividends or other earnings paid on awards in the applicable year prior to the vesting date that are not otherwise reflected in the fair value of such award or included in any other component of total compensation for the applicable year. The valuation assumptions used to calculate fair values did not materially differ from those disclosed at the time of grant. The amounts deducted or added in calculating the equity award adjustments are as follows:


Average Non-PEO NEOs Equity Award Adjustments:


2021 Average


2022 Average


2023 Average


2024 Average


2025 Average


Plus: Fair Value for Stock Awards Granted in the Covered Year that are Unvested at End of Year

$

450,772


$

257,486


$

610,348


$

347,917


$

279,050


Change in Fair Value of Outstanding Unvested Stock Awards from Prior Year

$

121,557


$

(152,787

)

$

(85,607

)

$

(334,414

)

$

(148,321

)

Change in Fair Value of Stock Awards from Prior Years that Vested in the Covered Year

$

27,727


$

(71,058

)

$

(20,451

)

$

(89,489

)

$

(65,488

)

Less: Fair Value of Stock Awards Forfeited during the Covered Year

$

(47,291

)

$

(97,057

)

-


-


$

(80,580

)

Total Adjustment

$

552,765


$

(63,417

)

$

504,291


$

(75,986

)

$

(15,339

)

       
Compensation Actually Paid vs. Total Shareholder Return

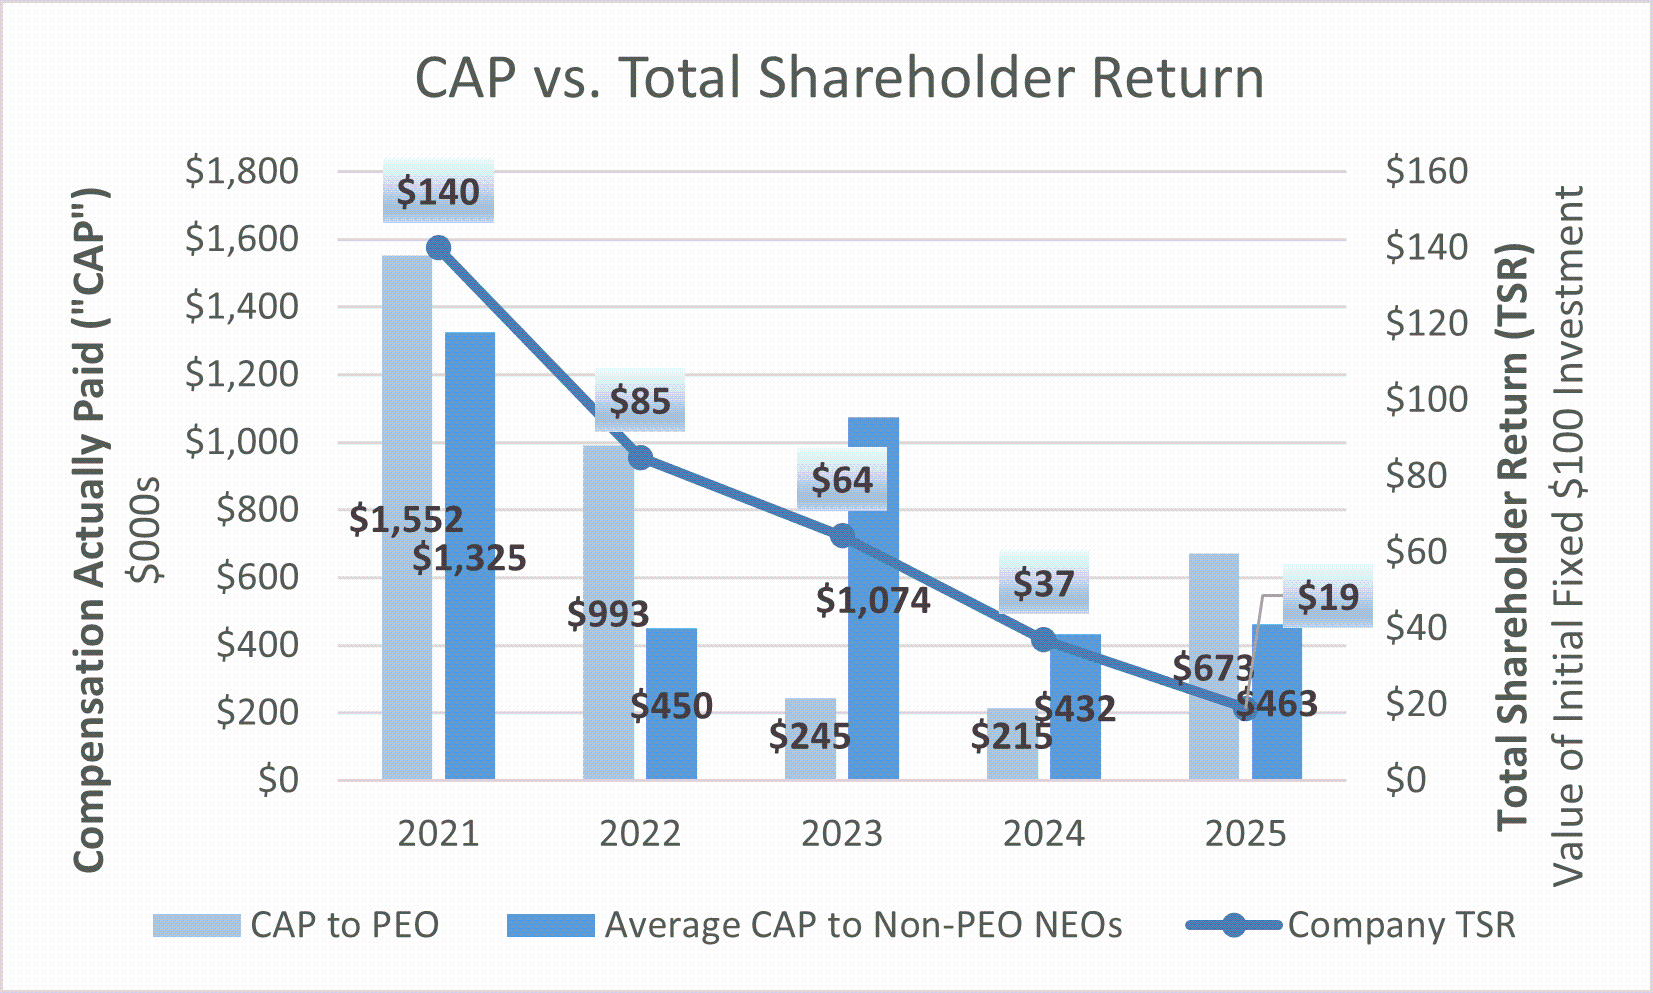
As shown in the chart below, the PEO's and, with the exception of 2023 and 2025, the other NEOs’ CAP amounts are generally aligned with the Company’s TSR. This is due primarily to the Company’s use of equity incentives, which are tied directly to stock price in addition to the company’s financial performance. The increases in the other NEO's CAP amounts for 2023 and 2025 are due primarily to the issuance of stock options, which have value only the extent that our stock price increases over the grant date stock price. The increase in the PEO's CAP amount for 2025 was due to the reinstatement of his base salary to $650,000 after it had been reduced to $1 on an annualized basis from May of 2023 until April of 2025. Prior to reduction in May 2023, Mr. Colony's base salary had been $600,000.


img229676698_4.gif

       
Compensation Actually Paid vs. Net Income

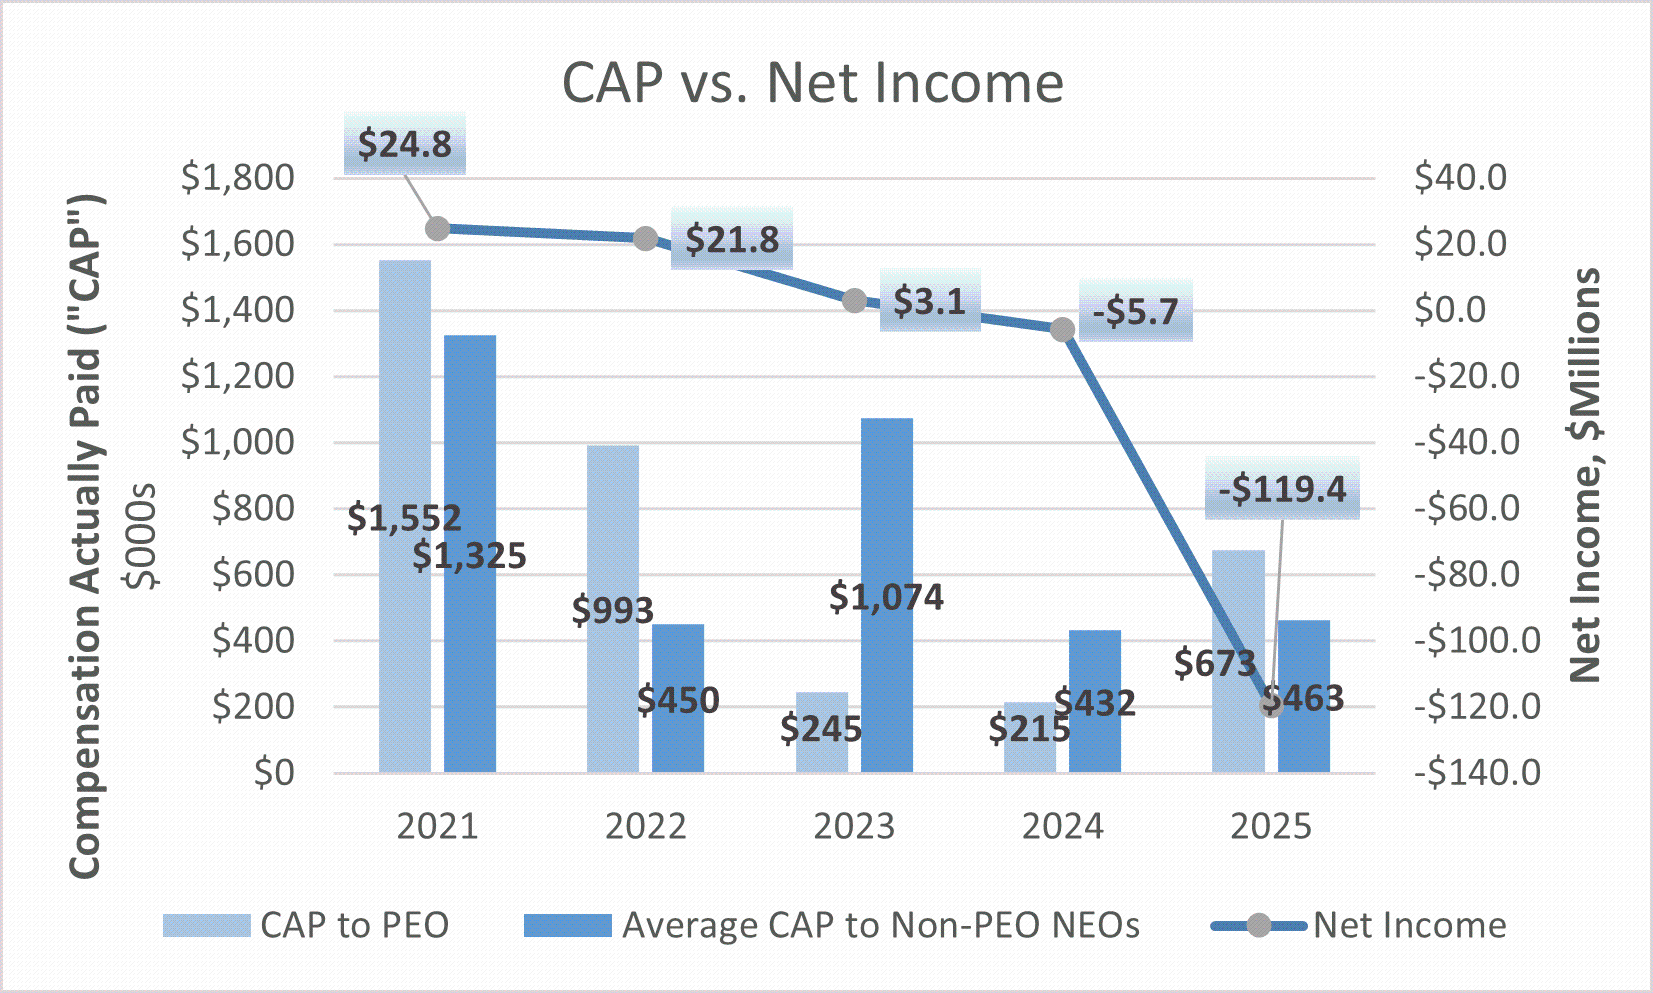
As shown in the chart below, while the variations in the Company’s net income and the PEO and other NEOs’ CAP have been directionally consistent most years, the decrease in the CAP amounts for the other NEOs was proportionately greater than the decrease in net income in 2022. This is due in large part to the significant emphasis the Company places on equity incentives, which are sensitive to changes in stock price. In addition, the disproportionately large decrease in net income in 2025 was due primarily to goodwill impairment charges of approximately $110.7 million. The increases in the PEO's cap amount for 2025 and the other NEO's CAP amounts for 2023 and 2025 are due to the reasons stated above in "CAP versus TSR." The Company does not use net income to determine compensation levels or incentive plan payouts.


img229676698_5.gif

       
Compensation Actually Paid vs. Company Selected Measure

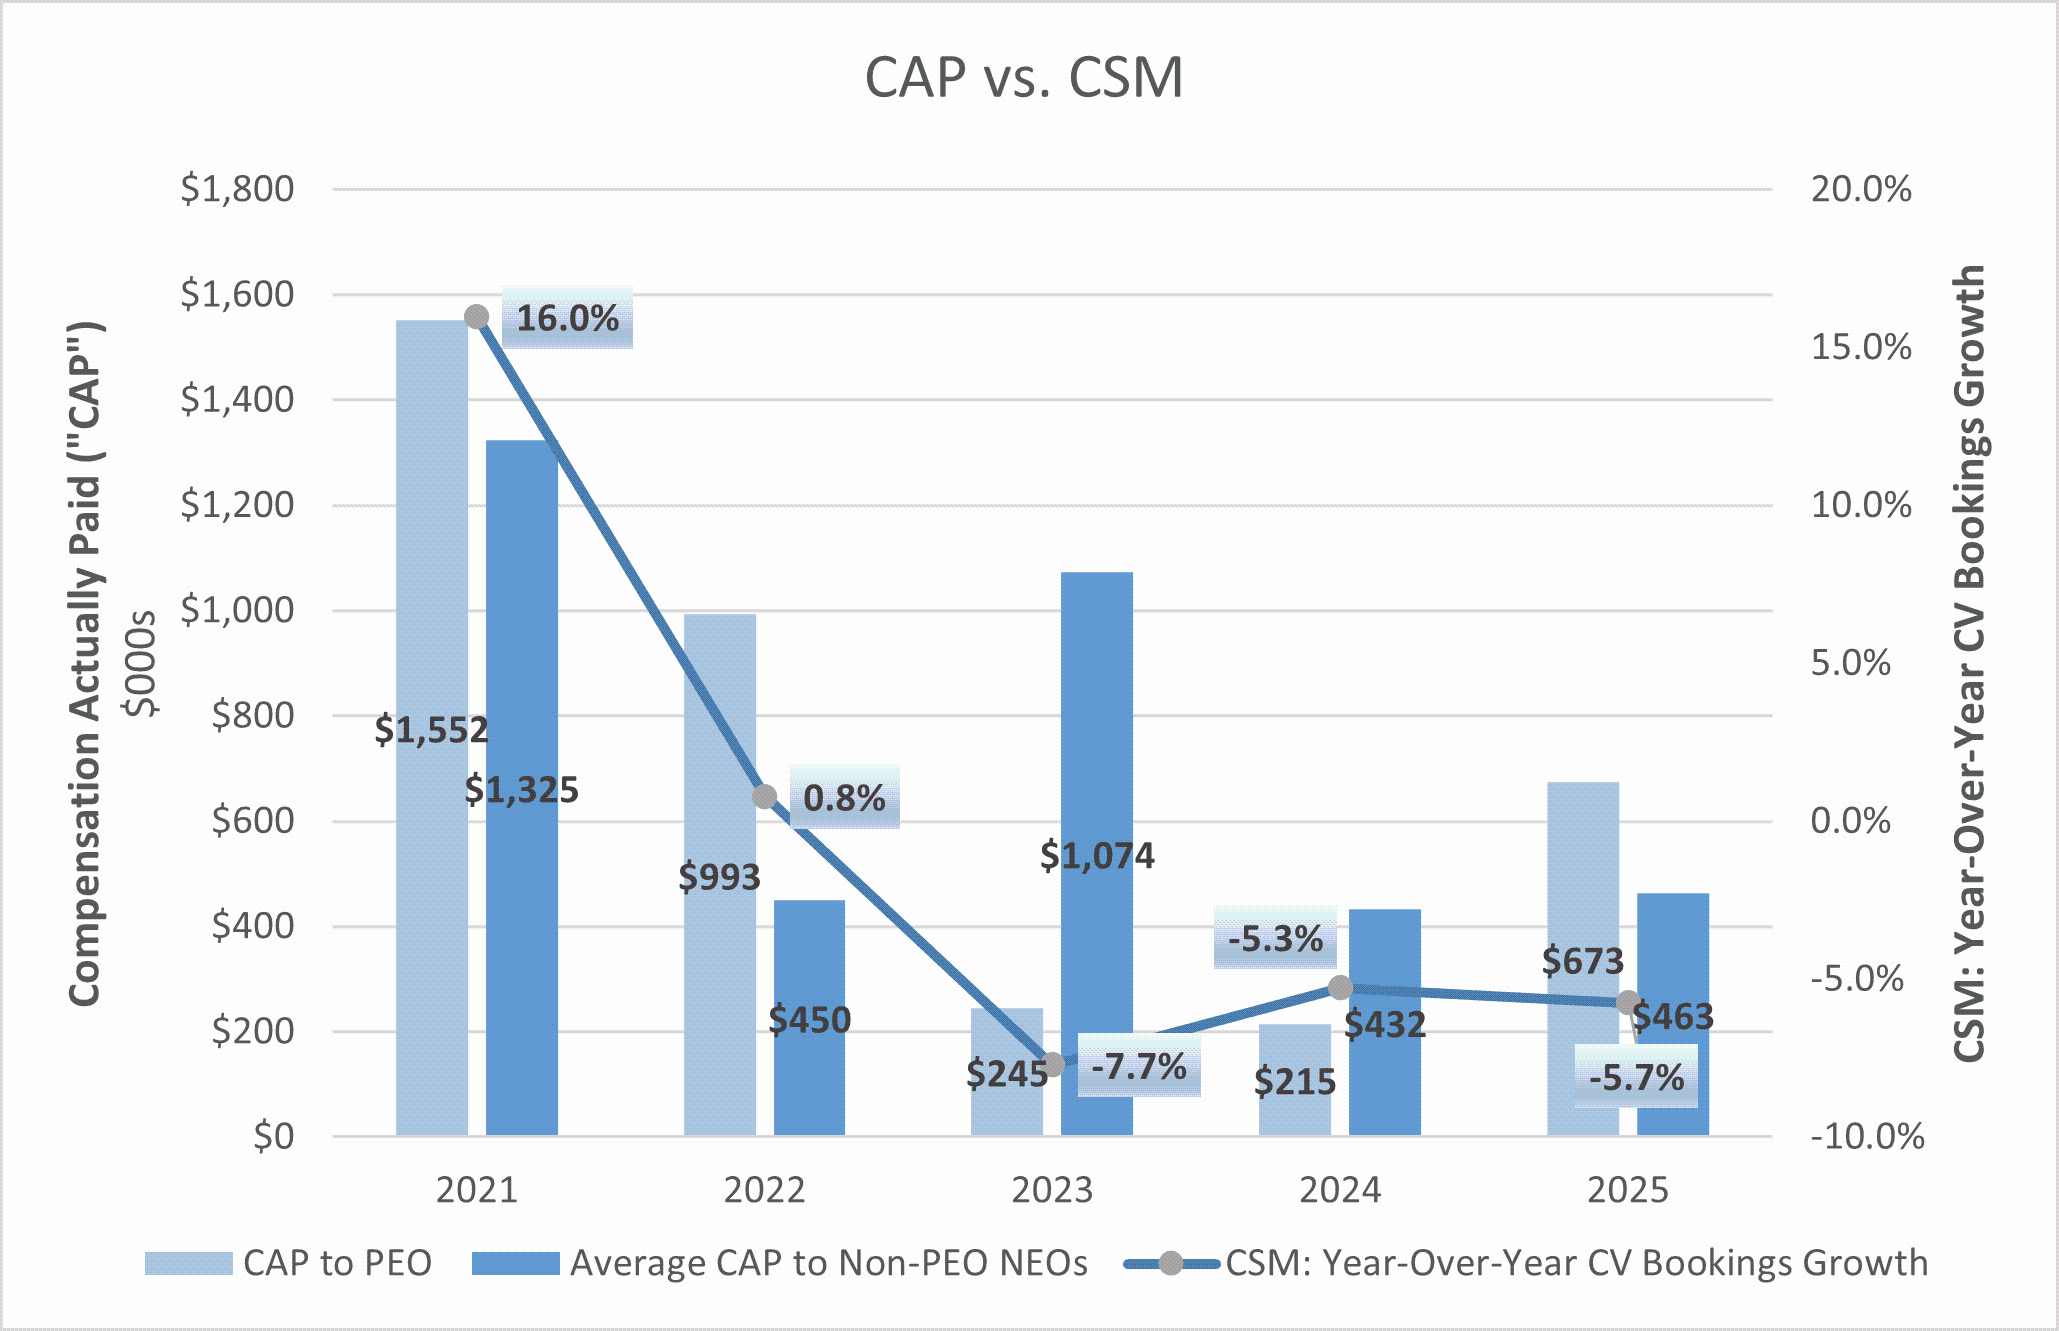
The chart below compares the PEO and other NEOs’ CAP to our CSM, year-over-year CV bookings growth, which indicates there is a very strong relationship between this CSM and CAP in most years. The increase in the PEO's CAP amount for 2025 and the other NEO's CAP amounts for 2023 and 2025 are due to the reasons stated above in "CAP versus TSR."

The Company's amount of CV bookings is one of the two metrics used in determining the level of payout under our Executive Cash Incentive Plan, with the target level of CV bookings being derived from the targeted year-over-year CV bookings growth percentage reflected in the annual operating plan approved by the Board of Directors. In addition, we believe there is a strong correlation between our CV bookings growth and our stock price, which in turn leads to fluctuations in the CAP to our non-PEO NEOs, who receive equity incentives as part of their compensation.

img229676698_6.gif

       
Total Shareholder Return Vs Peer Group

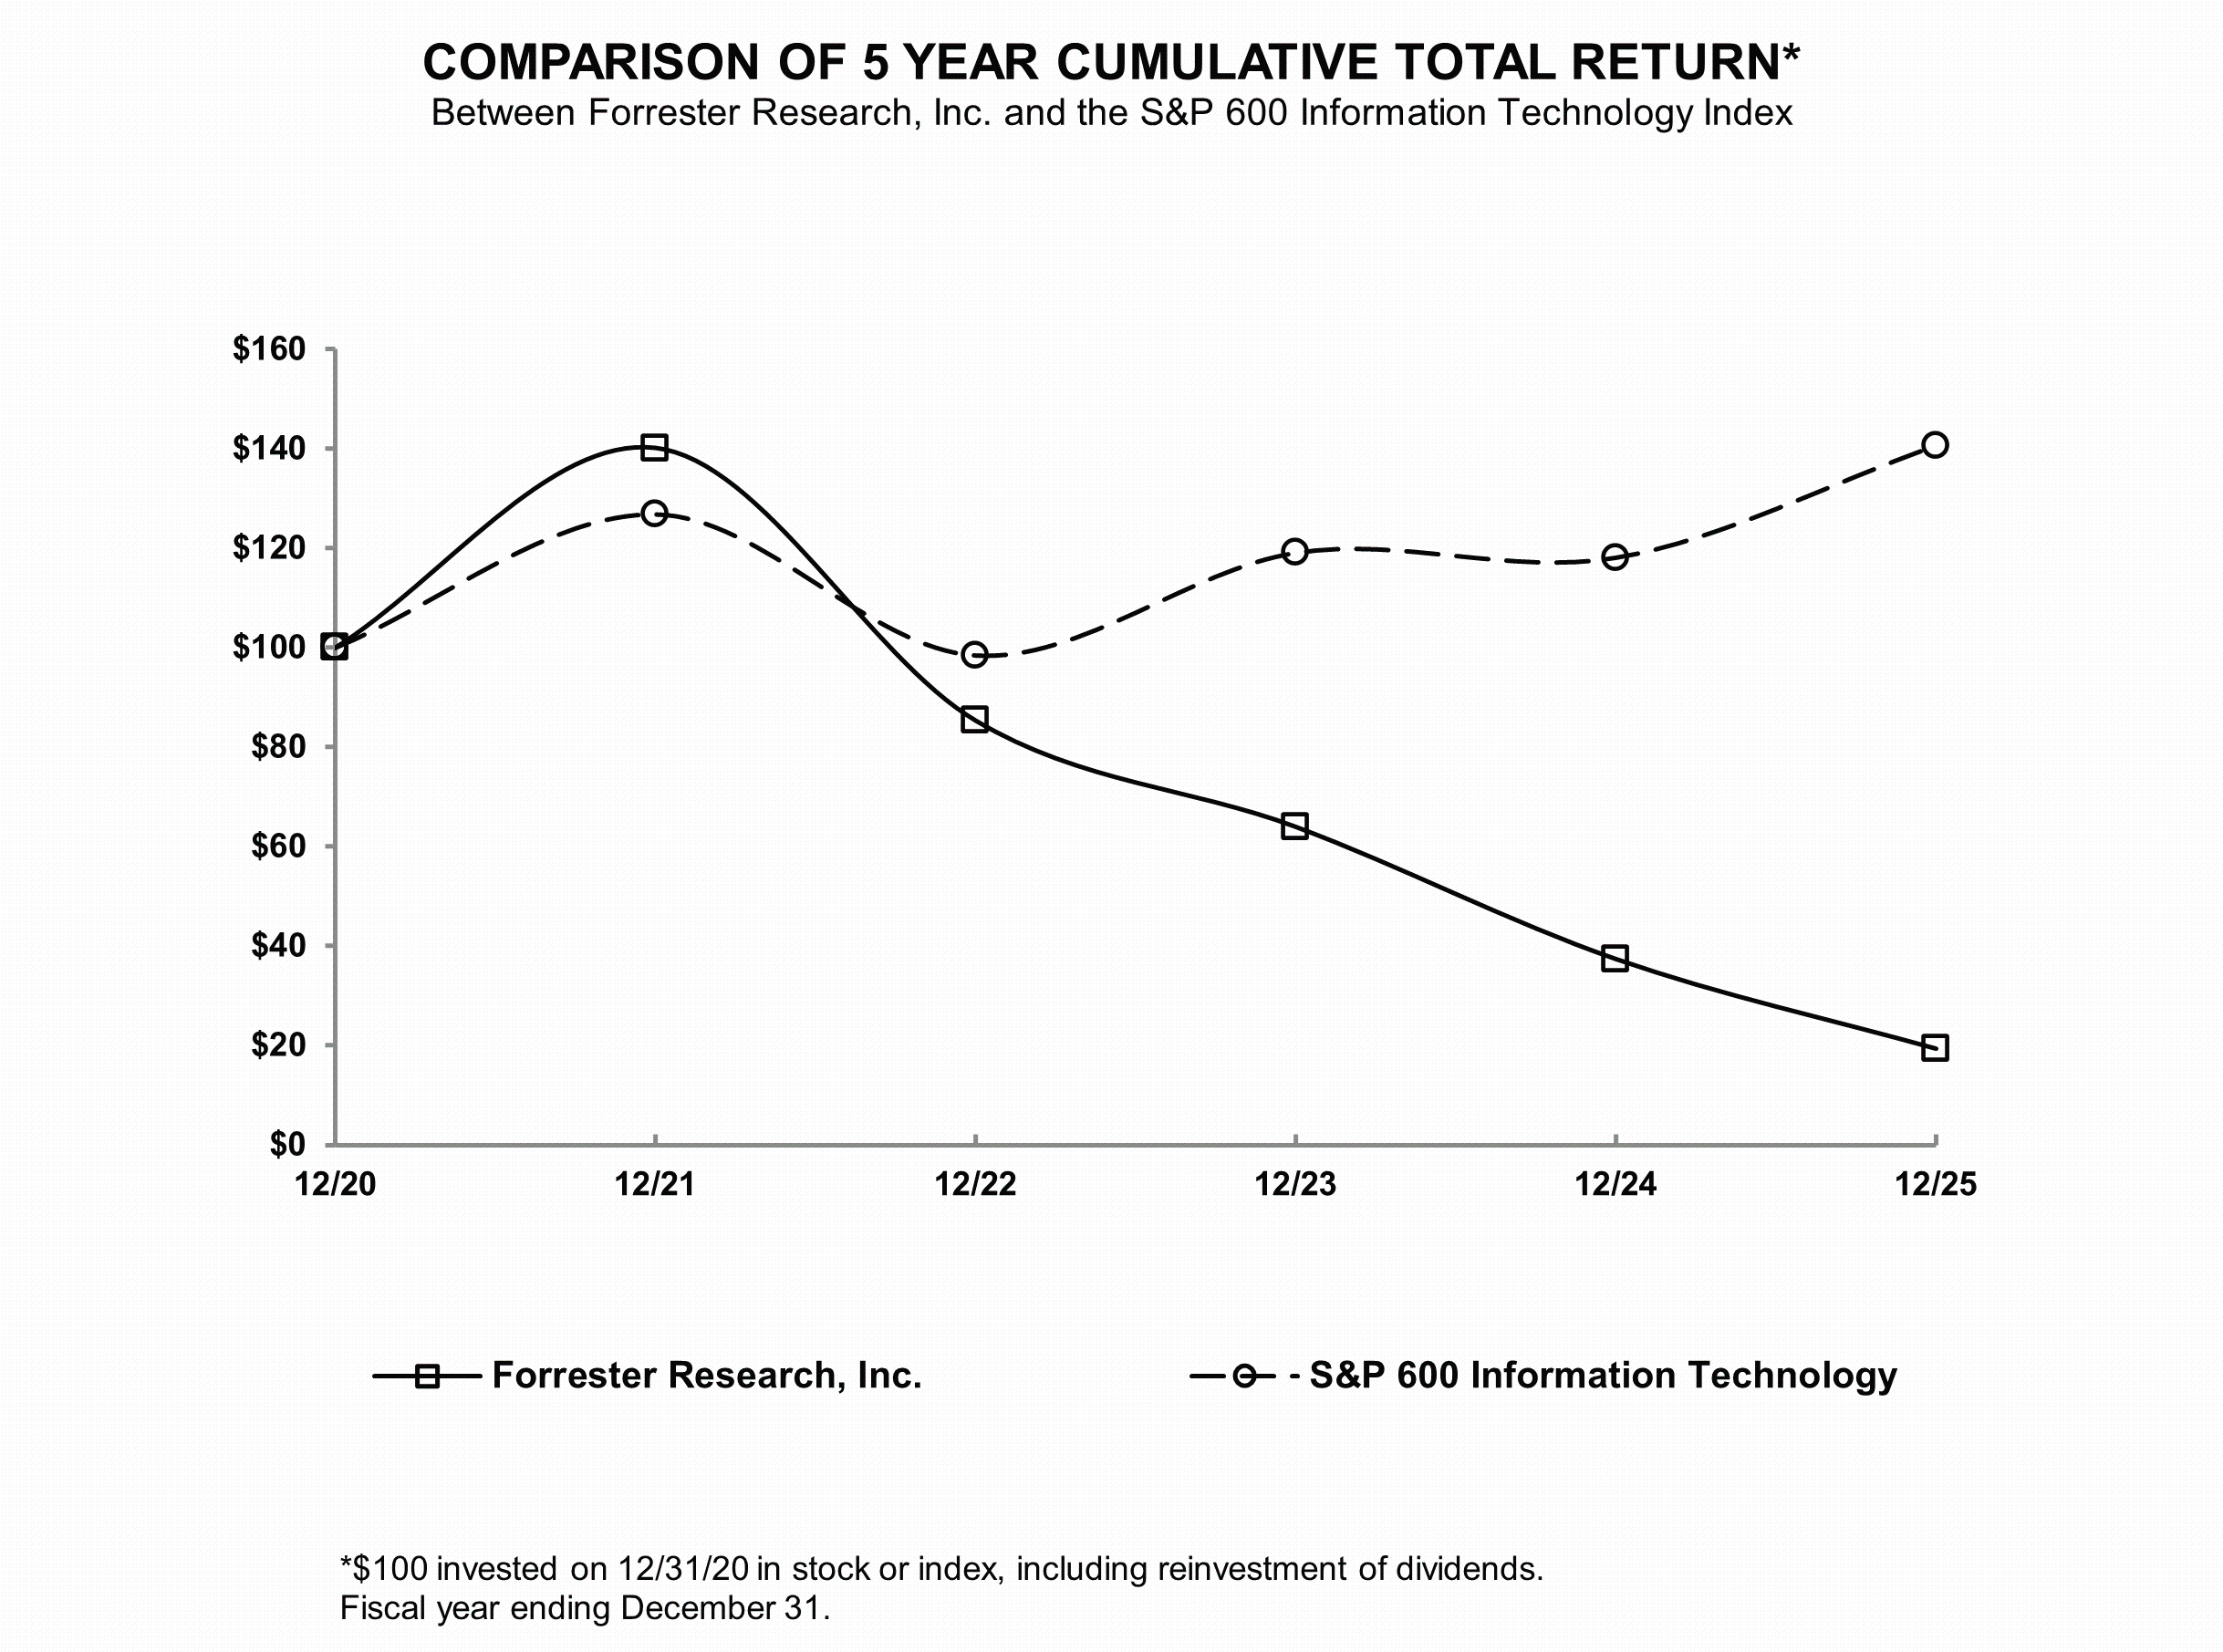
As shown in the chart below, the Company's 5-year cumulative TSR is less than the companies included in our industry index, the S&P Small Cap 600 Information Technology. For more information regarding the Company’s performance and the companies that the Compensation Committee considers when determining compensation, refer to “Executive Compensation – Compensation Discussion and Analysis.”


img229676698_7.gif

       
Tabular List, Table

As described in greater detail in “Executive Compensation – Compensation Discussion and Analysis,” our executive compensation program reflects a variable pay-for-performance philosophy. The most important financial performance measures we used to link executive compensation actually paid to our NEOs, for the most recently completed fiscal year, to our performance are as follows:

CV Bookings
Modified Operating Income
Year-Over-Year CV Bookings Growth
       
Total Shareholder Return Amount $ 19 37 64 85 140
Peer Group Total Shareholder Return Amount 141 118 119 98 127
Net Income (Loss) $ (119,400,000) $ (5,700,000) $ 3,100,000 $ 21,800,000 $ 24,800,000
Company Selected Measure Amount (5.7) (5.3) (7.7) 0.8 16
PEO Name Mr. Colony Mr. Colony Mr. Colony Mr. Colony Mr. Colony
Measure:: 1          
Pay vs Performance Disclosure          
Name CV Bookings        
Measure:: 2          
Pay vs Performance Disclosure          
Name Modified Operating Income        
Measure:: 3          
Pay vs Performance Disclosure          
Name Year-Over-Year CV Bookings Growth        
Non-GAAP Measure Description
(8)
Year-over-year CV bookings growth is the percentage increase in bookings of our CV products with respect to a given covered year compared to the prior covered year. For purposes of calculating the 2024 amount, we have excluded CV bookings attributable to our former FeedbackNow business that was divested in August 2024.
       
Non-PEO NEO          
Pay vs Performance Disclosure          
Salary $ 406,322 $ 410,319 $ 408,008 $ 355,306 $ 290,528
Bonus and Non Equity Incentive Compensation 59,842 80,645 144,723 149,711 376,641
Other Compensation 13,562 17,357 16,928 8,317 104,942
Non-PEO NEO | Aggregate Grant Date Fair Value of Equity Award Amounts Reported in Summary Compensation Table          
Pay vs Performance Disclosure          
Adjustment to Compensation, Amount (585,517) (462,483) (1,085,500) (464,972) (362,487)
Non-PEO NEO | Equity Awards Adjustments, Excluding Value Reported in Compensation Table          
Pay vs Performance Disclosure          
Adjustment to Compensation, Amount (15,339) (75,986) 504,291 (63,417) 552,765
Non-PEO NEO | Year-end Fair Value of Equity Awards Granted in Covered Year that are Outstanding and Unvested          
Pay vs Performance Disclosure          
Adjustment to Compensation, Amount 279,050 347,917 610,348 257,486 450,772
Non-PEO NEO | Year-over-Year Change in Fair Value of Equity Awards Granted in Prior Years That are Outstanding and Unvested          
Pay vs Performance Disclosure          
Adjustment to Compensation, Amount (148,321) (334,414) (85,607) (152,787) 121,557
Non-PEO NEO | Change in Fair Value as of Vesting Date of Prior Year Equity Awards Vested in Covered Year          
Pay vs Performance Disclosure          
Adjustment to Compensation, Amount (65,488) (89,489) (20,451) (71,058) 27,727
Non-PEO NEO | Prior Year End Fair Value of Equity Awards Granted in Any Prior Year that Fail to Meet Applicable Vesting Conditions During Covered Year          
Pay vs Performance Disclosure          
Adjustment to Compensation, Amount $ (80,580) $ 0 $ 0 $ (97,057) $ (47,291)