Pay vs Performance Disclosure - USD ($)
Dec. 31, 2025
Dec. 31, 2024
Dec. 31, 2023
Dec. 31, 2022
Dec. 31, 2021
The following table presents information about our NEOs’ pay and Company performance for each of the Company’s five most recently completed fiscal years.
| PAY VERSUS PERFORMANCE TABLE | ||||||||||||||||||||||||||
| Value of Initial Fixed $100 Investment Based On: | ||||||||||||||||||||||||||
| Year | Summary Compensation Table Total for CEO ($) (1) | Compensation Actually Paid to CEO ($) (1)(2) | Average Summary Compensation Table Total for Non-CEO NEOs ($) (3) | Average Compensation Actually Paid to Non-CEO NEOs ($) (2)(3) | Total Share- holder Return ($) | Peer Group Total Share- holder Return ($) (4) | Net Income (Loss) ($) (in 000’s) | Operating Income ($) (in 000’s) | ||||||||||||||||||
| 2025 | 6,048,549 | 5,872,027 | 1,220,803 | 1,121,419 | 82 | 135 | (22,998) | 11,657 | ||||||||||||||||||
| 2024 | 5,824,493 | 2,635,157 | 1,558,029 | 1,147,387 | 96 | 132 | 33,570 | 66,148 | ||||||||||||||||||
| 2023 | 5,446,752 | 3,516,805 | 1,113,639 | 899,065 | 112 | 144 | 112,290 | 176,416 | ||||||||||||||||||
| 2022 | 5,460,198 | 2,465,428 | 1,094,807 | 701,308 | 105 | 126 | 245,580 | 323,076 | ||||||||||||||||||
| 2021 | 5,314,351 | 8,798,833 | 1,133,218 | 1,587,300 | 123 | 142 | 261,478 | 309,146 | ||||||||||||||||||
| | ||||||||||||||||||||||||||
(1) | Represents compensation of Mr. Leathers for all periods presented. | |||||||||||||||||||||||||
(2) | SEC rules require certain adjustments be made to the Summary Compensation Table totals to determine “compensation actually paid.” The Reconciliation of Compensation Actually Paid Adjustments table below details the applicable adjustments that were made to determine “compensation actually paid” (all amounts are averages for the non-CEO NEOs). | |||||||||||||||||||||||||
(3) | The following NEOs are included in the average compensation calculations for the periods presented: 2025 and 2024 – Messrs. Wikoff, Meisgeier, Downing, and Mahon; 2023 – Messrs. Wikoff, Meisgeier, Schelble, Johnson, and John J. Steele. Mr. Steele was the former EVP, Treasurer and Chief Financial Officer; and 2022 and 2021 – Messrs. Steele, Nordlund, Schelble, and Johnson. Mr. Nordlund was the former EVP Strategic Partnerships. | |||||||||||||||||||||||||
(4) | The Peer Group includes the following companies: Covenant Logistics Group; Heartland Express; Hub Group; J.B. Hunt; Knight-Swift Transportation; Landstar System; Marten Transport; and Schneider National. | |||||||||||||||||||||||||
Represents compensation of Mr. Leathers for all periods presented.
The following NEOs are included in the average compensation calculations for the periods presented:
2025 and 2024 – Messrs. Wikoff, Meisgeier, Downing, and Mahon;
2023 – Messrs. Wikoff, Meisgeier, Schelble, Johnson, and John J. Steele. Mr. Steele was the former EVP, Treasurer and Chief Financial Officer; and
2022 and 2021 – Messrs. Steele, Nordlund, Schelble, and Johnson. Mr. Nordlund was the former EVP Strategic Partnerships.
SEC rules require certain adjustments be made to the Summary Compensation Table totals to determine “compensation actually paid.” The Reconciliation of Compensation Actually Paid Adjustments table below details the applicable adjustments that were made to determine “compensation actually paid” (all amounts are averages for the non-CEO NEOs).
The following table reconciles total compensation reported in the Summary Compensation Table to “compensation actually paid” for the CEO and non-CEO NEOs (averaged) over the last five years.
| RECONCILIATION OF COMPENSATION ACTUALLY PAID ADJUSTMENTS | |||||||||||||||||||||||
| Year | Summary Compensation Table “Total” Column ($) | Subtract Summary Compensation Table “Stock Awards” Column ($) | Add Year End Fair Value of Unvested Equity Awards Granted in Year ($) | Add/ (Subtract) Year Over Year Change in Fair Value of Unvested Equity Awards Granted in Prior Years ($) | Add/ (Subtract) Year Over Year Change in Fair Value of Equity Awards Granted in Prior Years that Vested in Year ($) | Subtract Fair Value of Prior Year Equity Awards that Failed to Meet Vesting Conditions in Year ($) | Compensation Actually Paid ($) | ||||||||||||||||
| CEO | |||||||||||||||||||||||
| 2025 | 6,048,549 | (4,200,000) | 4,328,066 | (248,424) | (56,164) | — | 5,872,027 | ||||||||||||||||
| 2024 | 5,824,493 | (3,900,000) | 1,694,988 | (1,026,790) | 42,466 | — | 2,635,157 | ||||||||||||||||
| 2023 | 5,446,752 | (3,600,000) | 2,433,079 | (1,562,871) | 799,845 | — | 3,516,805 | ||||||||||||||||
| 2022 | 5,460,198 | (3,200,000) | 2,507,777 | (2,102,923) | (199,624) | — | 2,465,428 | ||||||||||||||||
| 2021 | 5,314,351 | (2,800,000) | 4,741,960 | 1,288,523 | 253,999 | — | 8,798,833 | ||||||||||||||||
| Non-CEO NEOs (Average) | |||||||||||||||||||||||
| 2025 | 1,220,803 | (512,500) | 528,128 | (100,019) | (14,993) | — | 1,121,419 | ||||||||||||||||
| 2024 | 1,558,029 | (857,500) | 553,066 | (104,828) | (1,380) | — | 1,147,387 | ||||||||||||||||
| 2023 | 1,113,639 | (430,000) | 343,301 | (124,568) | 84,891 | (88,198) | 899,065 | ||||||||||||||||
| 2022 | 1,094,807 | (350,000) | 274,289 | (287,911) | (29,877) | — | 701,308 | ||||||||||||||||
| 2021 | 1,133,218 | (312,500) | 529,187 | 195,957 | 41,438 | — | 1,587,300 | ||||||||||||||||
The following graphs illustrate the relationships between each of the financial performance measures included in the Pay Versus Performance Table above and the compensation actually paid to the CEO and, on average, to non-CEO NEOs over the Company’s five most recently completed fiscal years.
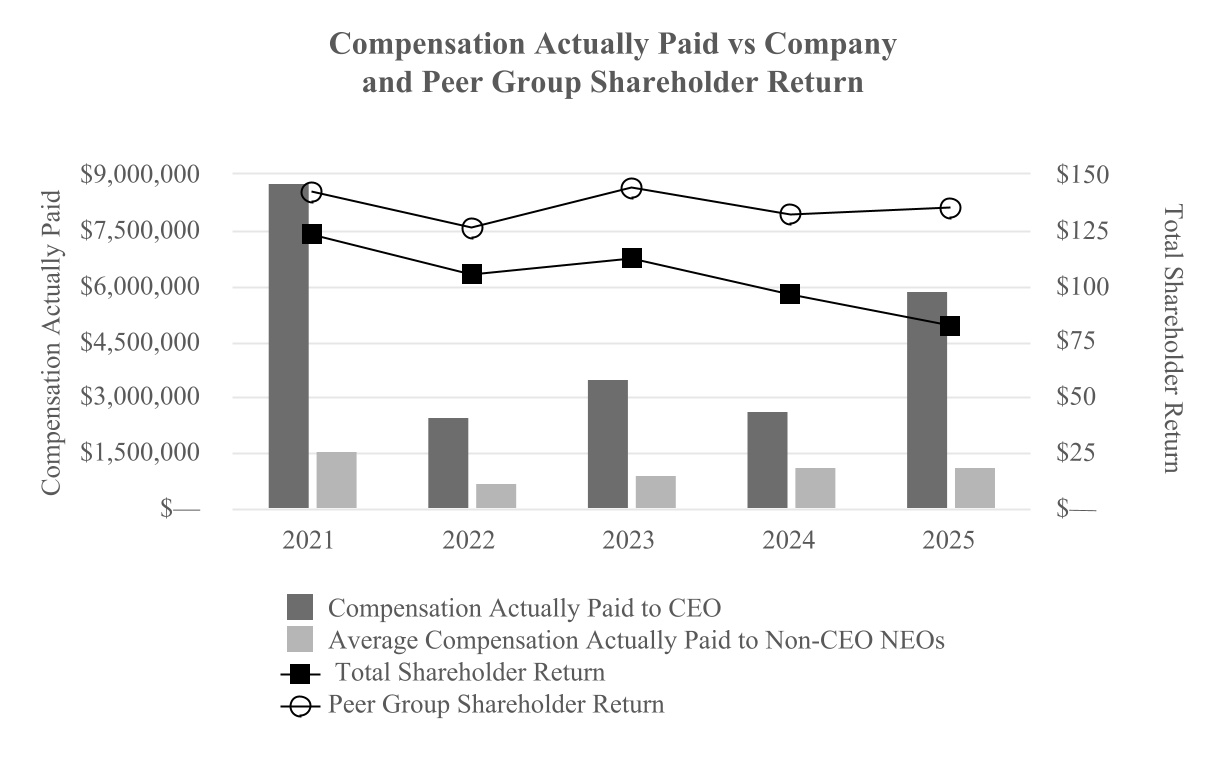
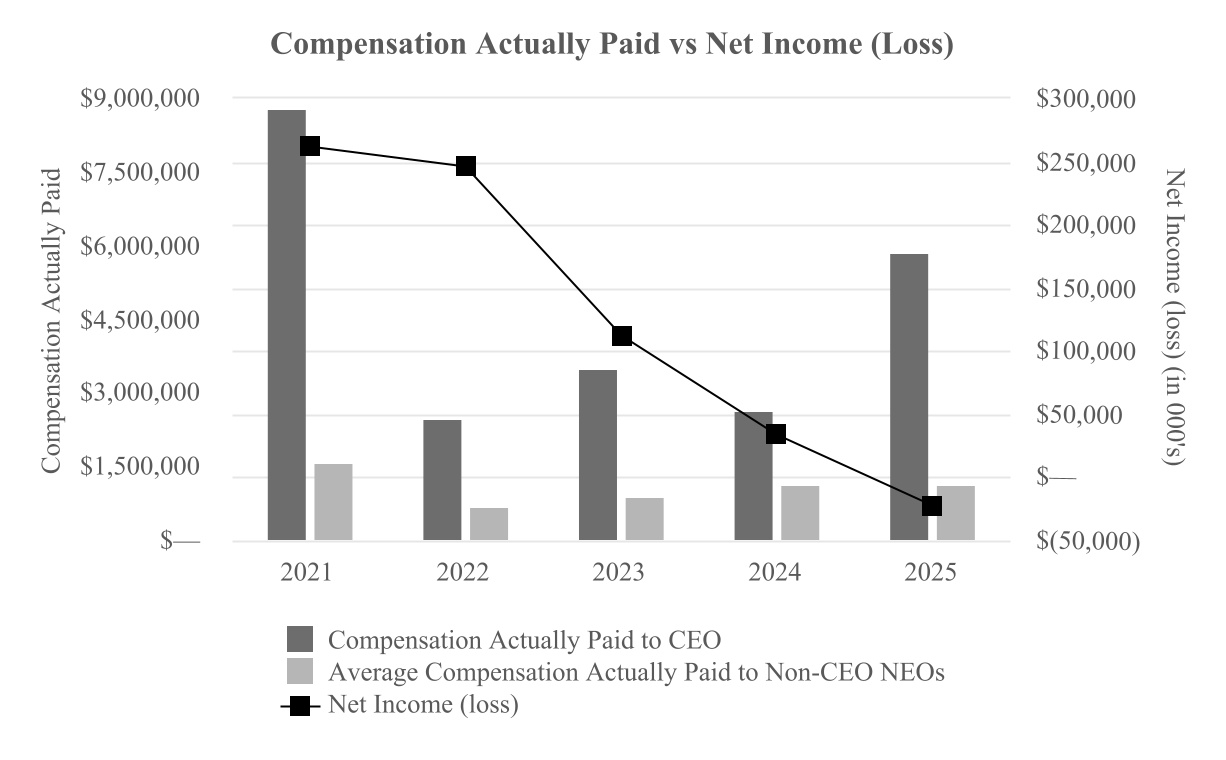

The following graphs illustrate the relationships between each of the financial performance measures included in the Pay Versus Performance Table above and the compensation actually paid to the CEO and, on average, to non-CEO NEOs over the Company’s five most recently completed fiscal years.
•Operating income
•Diluted earnings per share