Shareholder Report
|
12 Months Ended |
|
Jan. 31, 2026
USD ($)
Holding
|
Jan. 31, 2025 |
| Shareholder Report [Line Items] |
|
|
| Document Type |
N-CSR
|
|
| Amendment Flag |
false
|
|
| Registrant Name |
EATON VANCE MUTUAL FUNDS TRUST
|
|
| Entity Central Index Key |
0000745463
|
|
| Entity Investment Company Type |
N-1A
|
|
| Document Period End Date |
Jan. 31, 2026
|
|
| Shareholder Report Annual or Semi-Annual |
Annual Shareholder Report
|
|
| C000034229 |
|
|
| Shareholder Report [Line Items] |
|
|
| Fund Name |
Parametric Emerging Markets Fund
|
|
| Class Name |
Class A
|
|
| Trading Symbol |
EAEMX
|
|
| Annual or Semi-Annual Statement [Text Block] |
This annual shareholder report contains important information about the Parametric Emerging Markets Fund for the period of February 1, 2025 to January 31, 2026.
|
|
| Additional Information [Text Block] |
You can find additional information about the Fund at www.eatonvance.com/parametric-fund-documents.php. You can also request this information by contacting us at 1-800-260-0761.
|
|
| Material Fund Change Notice [Text Block] |
This report describes changes to the Fund that occurred during the reporting period.
|
|
| Additional Information Phone Number |
1-800-260-0761
|
|
| Additional Information Website |
<span style="box-sizing: border-box; color: rgb(0, 0, 0); display: inline; flex-wrap: nowrap; font-size: 10.6667px; font-weight: 400; grid-area: auto; line-height: 16px; margin: 0px; overflow: visible; text-align: left; text-align-last: auto; white-space-collapse: preserve-breaks;">www.eatonvance.com/parametric-fund-documents.php</span>
|
|
| Expenses [Text Block] |
What were the Fund costs for the last year?(based on a hypothetical $10,000 investment)
Table Summary
Class Name |
Costs of a $10,000 investment |
Costs paid as a percentage of a $10,000 investment |
Class A |
$171 |
1.46% | |
|
| Expenses Paid, Amount |
$ 171
|
|
| Expense Ratio, Percent |
1.46%
|
|
| Factors Affecting Performance [Text Block] |
How did the Fund perform last year and what affected its performance?Key contributors to (↑) and detractors from (↓) performance, relative to the MSCI Emerging Markets Index (the Index): ↓ Underweight exposure to South Korea, including its technology sector, detracted from returns as tech stocks propelled significant country-level gains ↓ Sector allocations and an underweight exposure to Taiwan detracted from Index-relative returns as technology stocks drove a significant country-wide rally ↓ An overweight exposure to Turkey hurt returns as a significant decline in Turkey’s foreign exchange rate versus the dollar weighed on overall results for the country ↑ In contrast, an underweight exposure to India contributed to performance as India’s market struggled to gain ground due to trade frictions with the U.S. ↑ Sector allocations and an underweight exposure to China helped returns as ongoing property sector weakness and U.S. trade tensions weighed on market performance ↑ An overweight exposure to Peru contributed to Index-relative returns as the headline performance was boosted by a significant rally among mining companies |
|
| Performance Past Does Not Indicate Future [Text] |
THE FUND'S PAST PERFORMANCE IS NO GUARANTEE OF FUTURE RESULTS.
|
|
| Line Graph [Table Text Block] |
Comparison of the change in value of a $10,000 investment for the period indicated.
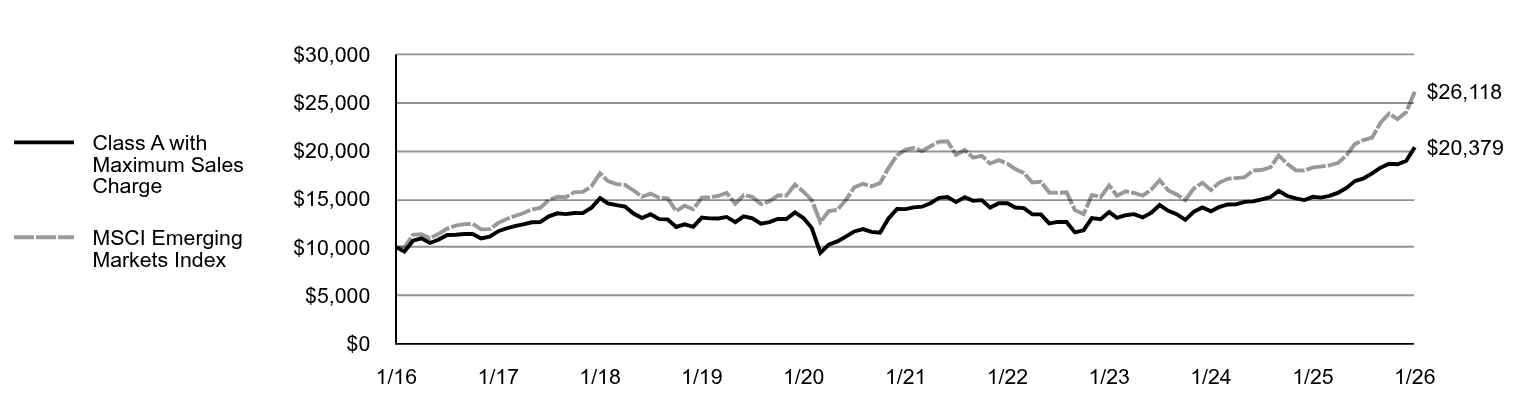
Table Summary
|
Class A with Maximum Sales Charge |
MSCI Emerging Markets Index |
1/16 |
$10,000 |
$10,000 |
2/16 |
$9,561 |
$9,984 |
3/16 |
$10,691 |
$11,305 |
4/16 |
$10,941 |
$11,366 |
5/16 |
$10,458 |
$10,942 |
6/16 |
$10,799 |
$11,380 |
7/16 |
$11,279 |
$11,952 |
8/16 |
$11,306 |
$12,249 |
9/16 |
$11,393 |
$12,407 |
10/16 |
$11,393 |
$12,436 |
11/16 |
$10,930 |
$11,864 |
12/16 |
$11,107 |
$11,890 |
1/17 |
$11,685 |
$12,541 |
2/17 |
$11,957 |
$12,925 |
3/17 |
$12,211 |
$13,251 |
4/17 |
$12,386 |
$13,541 |
5/17 |
$12,605 |
$13,941 |
6/17 |
$12,631 |
$14,082 |
7/17 |
$13,222 |
$14,921 |
8/17 |
$13,531 |
$15,254 |
9/17 |
$13,443 |
$15,193 |
10/17 |
$13,567 |
$15,726 |
11/17 |
$13,549 |
$15,757 |
12/17 |
$14,107 |
$16,323 |
1/18 |
$15,112 |
$17,683 |
2/18 |
$14,556 |
$16,868 |
3/18 |
$14,376 |
$16,554 |
4/18 |
$14,233 |
$16,481 |
5/18 |
$13,506 |
$15,897 |
6/18 |
$13,040 |
$15,237 |
7/18 |
$13,435 |
$15,571 |
8/18 |
$12,927 |
$15,150 |
9/18 |
$12,909 |
$15,070 |
10/18 |
$12,119 |
$13,758 |
11/18 |
$12,388 |
$14,324 |
12/18 |
$12,130 |
$13,945 |
1/19 |
$13,083 |
$15,166 |
2/19 |
$13,009 |
$15,200 |
3/19 |
$12,991 |
$15,328 |
4/19 |
$13,156 |
$15,650 |
5/19 |
$12,615 |
$14,515 |
6/19 |
$13,220 |
$15,421 |
7/19 |
$13,009 |
$15,232 |
8/19 |
$12,460 |
$14,489 |
9/19 |
$12,615 |
$14,766 |
10/19 |
$12,954 |
$15,389 |
11/19 |
$12,945 |
$15,367 |
12/19 |
$13,623 |
$16,514 |
1/20 |
$13,022 |
$15,744 |
2/20 |
$12,027 |
$14,914 |
3/20 |
$9,436 |
$12,617 |
4/20 |
$10,281 |
$13,772 |
5/20 |
$10,619 |
$13,878 |
6/20 |
$11,116 |
$14,898 |
7/20 |
$11,652 |
$16,229 |
8/20 |
$11,897 |
$16,588 |
9/20 |
$11,605 |
$16,322 |
10/20 |
$11,521 |
$16,658 |
11/20 |
$12,978 |
$18,199 |
12/20 |
$13,983 |
$19,537 |
1/21 |
$13,964 |
$20,136 |
2/21 |
$14,154 |
$20,290 |
3/21 |
$14,220 |
$19,984 |
4/21 |
$14,581 |
$20,481 |
5/21 |
$15,141 |
$20,956 |
6/21 |
$15,217 |
$20,992 |
7/21 |
$14,695 |
$19,579 |
8/21 |
$15,208 |
$20,092 |
9/21 |
$14,837 |
$19,293 |
10/21 |
$14,894 |
$19,484 |
11/21 |
$14,125 |
$18,690 |
12/21 |
$14,570 |
$19,040 |
1/22 |
$14,580 |
$18,680 |
2/22 |
$14,136 |
$18,122 |
3/22 |
$14,068 |
$17,712 |
4/22 |
$13,432 |
$16,727 |
5/22 |
$13,422 |
$16,801 |
6/22 |
$12,486 |
$15,684 |
7/22 |
$12,640 |
$15,646 |
8/22 |
$12,631 |
$15,711 |
9/22 |
$11,550 |
$13,869 |
10/22 |
$11,762 |
$13,439 |
11/22 |
$13,026 |
$15,432 |
12/22 |
$12,923 |
$15,215 |
1/23 |
$13,658 |
$16,416 |
2/23 |
$13,064 |
$15,352 |
3/23 |
$13,336 |
$15,817 |
4/23 |
$13,447 |
$15,638 |
5/23 |
$13,114 |
$15,375 |
6/23 |
$13,578 |
$15,959 |
7/23 |
$14,383 |
$16,952 |
8/23 |
$13,789 |
$15,908 |
9/23 |
$13,437 |
$15,492 |
10/23 |
$12,862 |
$14,890 |
11/23 |
$13,688 |
$16,082 |
12/23 |
$14,143 |
$16,710 |
1/24 |
$13,740 |
$15,934 |
2/24 |
$14,174 |
$16,692 |
3/24 |
$14,443 |
$17,106 |
4/24 |
$14,454 |
$17,183 |
5/24 |
$14,712 |
$17,280 |
6/24 |
$14,764 |
$17,961 |
7/24 |
$14,971 |
$18,015 |
8/24 |
$15,199 |
$18,305 |
9/24 |
$15,850 |
$19,528 |
10/24 |
$15,323 |
$18,659 |
11/24 |
$15,074 |
$17,989 |
12/24 |
$14,907 |
$17,964 |
1/25 |
$15,238 |
$18,285 |
2/25 |
$15,163 |
$18,374 |
3/25 |
$15,334 |
$18,490 |
4/25 |
$15,643 |
$18,733 |
5/25 |
$16,165 |
$19,532 |
6/25 |
$16,868 |
$20,707 |
7/25 |
$17,145 |
$21,110 |
8/25 |
$17,678 |
$21,381 |
9/25 |
$18,253 |
$22,911 |
10/25 |
$18,669 |
$23,868 |
11/25 |
$18,616 |
$23,297 |
12/25 |
$18,956 |
$23,994 |
1/26 |
$20,379 |
$26,118 | |
|
| Average Annual Return [Table Text Block] |
Average Annual Total Returns (%)
Table Summary
Fund |
1 Year |
5 Years |
10 Years |
Class A |
33.75% |
7.85% |
7.95% |
Class A with 5.25% Maximum Sales Charge |
26.75% |
6.69% |
7.37% |
MSCI Emerging Markets Index (net of foreign withholding taxes) |
42.84% |
5.34% |
10.07% | Performance does not reflect the deduction of taxes that a shareholder would pay on Fund distributions or redemption of Fund shares. Performance assumes that all dividends and distributions, if any, were reinvested. For more recent performance information, visit www.eatonvance.com/performance.php. THE FUND'S PAST PERFORMANCE IS NO GUARANTEE OF FUTURE RESULTS. |
|
| No Deduction of Taxes [Text Block] |
Performance does not reflect the deduction of taxes that a shareholder would pay on Fund distributions or redemption of Fund shares.
|
|
| Material Change Date |
|
Jan. 31, 2025
|
| Updated Performance Information Location [Text Block] |
For more recent performance information, visit www.eatonvance.com/performance.php.
|
|
| AssetsNet |
$ 217,564,694
|
|
| Holdings Count | Holding |
1,162
|
|
| Advisory Fees Paid, Amount |
$ 1,436,513
|
|
| InvestmentCompanyPortfolioTurnover |
2.00%
|
|
| Additional Fund Statistics [Text Block] |
Table Summary
Total Net Assets |
$217,564,694 |
# of Portfolio Holdings |
1,162 |
Portfolio Turnover Rate |
2% |
Total Advisory Fees Paid |
$1,436,513 | |
|
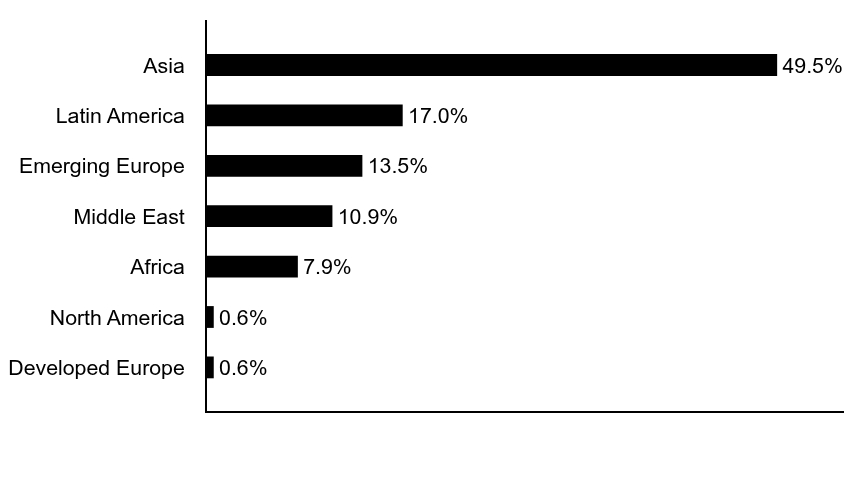
| Holdings [Text Block] |
Geographic Allocation (% of total investments)
Table Summary
Value |
Value |
Developed Europe |
0.6% |
North America |
0.6% |
Africa |
7.9% |
Middle East |
10.9% |
Emerging Europe |
13.5% |
Latin America |
17.0% |
Asia |
49.5% | |
|
| Largest Holdings [Text Block] |
Top Ten Holdings (% of total investments)Footnote Referencea
Table Summary
Taiwan Semiconductor Manufacturing Co. Ltd. |
2.0% |
Delta Electronics (Thailand) PCL |
1.3% |
Tencent Holdings Ltd. |
1.1% |
Samsung Electronics Co. Ltd. |
1.1% |
Vingroup JSC |
0.8% |
America Movil SAB de CV, Series B |
0.7% |
SK Hynix, Inc. |
0.7% |
Southern Copper Corp. |
0.6% |
Naspers Ltd., Class N |
0.6% |
MTN Group Ltd. |
0.6% |
Total |
9.5% |
| Footnote |
Description |
Footnotea |
Excluding cash equivalents | |
|
| Material Fund Change [Text Block] |
This is a summary of certain changes to the Fund since January 31, 2025. For more complete information, you may review the Fund’s next prospectus, which we expect to be available by June 1, 2026 at www.eatonvance.com/parametric-fund-documents.php or upon request by contacting us at 1-800-260-0761. Effective July 1, 2025, Eaton Vance Management and Parametric Portfolio Associates LLC have agreed to reimburse the Fund’s expenses to the extent that total annual operating expenses (relating to ordinary operating expenses only and excluding expenses such as brokerage commissions, acquired fund fees and expenses of unaffiliated funds, borrowing costs, taxes or litigation expenses) exceed 1.44% (1.49% prior to July 1, 2025) of the Fund’s average daily net assets for Class A. This agreement may be changed or terminated after June 1, 2027. |
|
| Material Fund Change Expenses [Text Block] |
Effective July 1, 2025, Eaton Vance Management and Parametric Portfolio Associates LLC have agreed to reimburse the Fund’s expenses to the extent that total annual operating expenses (relating to ordinary operating expenses only and excluding expenses such as brokerage commissions, acquired fund fees and expenses of unaffiliated funds, borrowing costs, taxes or litigation expenses) exceed 1.44% (1.49% prior to July 1, 2025) of the Fund’s average daily net assets for Class A. This agreement may be changed or terminated after June 1, 2027.
|
|
| Summary of Change Legend [Text Block] |
This is a summary of certain changes to the Fund since January 31, 2025. For more complete information, you may review the Fund’s next prospectus, which we expect to be available by June 1, 2026 at www.eatonvance.com/parametric-fund-documents.php or upon request by contacting us at 1-800-260-0761.
|
|
| Updated Prospectus Phone Number |
1-800-260-0761
|
|
| C000034230 |
|
|
| Shareholder Report [Line Items] |
|
|
| Fund Name |
Parametric Emerging Markets Fund
|
|
| Class Name |
Class C
|
|
| Trading Symbol |
ECEMX
|
|
| Annual or Semi-Annual Statement [Text Block] |
This annual shareholder report contains important information about the Parametric Emerging Markets Fund for the period of February 1, 2025 to January 31, 2026.
|
|
| Additional Information [Text Block] |
You can find additional information about the Fund at www.eatonvance.com/parametric-fund-documents.php. You can also request this information by contacting us at 1-800-260-0761.
|
|
| Material Fund Change Notice [Text Block] |
This report describes changes to the Fund that occurred during the reporting period.
|
|
| Additional Information Phone Number |
1-800-260-0761
|
|
| Additional Information Website |
<span style="box-sizing: border-box; color: rgb(0, 0, 0); display: inline; flex-wrap: nowrap; font-size: 10.6667px; font-weight: 400; grid-area: auto; line-height: 16px; margin: 0px; overflow: visible; text-align: left; text-align-last: auto; white-space-collapse: preserve-breaks;">www.eatonvance.com/parametric-fund-documents.php</span>
|
|
| Expenses [Text Block] |
What were the Fund costs for the last year?(based on a hypothetical $10,000 investment)
Table Summary
Class Name |
Costs of a $10,000 investment |
Costs paid as a percentage of a $10,000 investment |
Class C |
$258 |
2.22% | |
|
| Expenses Paid, Amount |
$ 258
|
|
| Expense Ratio, Percent |
2.22%
|
|
| Factors Affecting Performance [Text Block] |
How did the Fund perform last year and what affected its performance?Key contributors to (↑) and detractors from (↓) performance, relative to the MSCI Emerging Markets Index (the Index): ↓ Underweight exposure to South Korea, including its technology sector, detracted from returns as tech stocks propelled significant country-level gains ↓ Sector allocations and an underweight exposure to Taiwan detracted from Index-relative returns as technology stocks drove a significant country-wide rally ↓ An overweight exposure to Turkey hurt returns as a significant decline in Turkey’s foreign exchange rate versus the dollar weighed on overall results for the country ↑ In contrast, an underweight exposure to India contributed to performance as India’s market struggled to gain ground due to trade frictions with the U.S. ↑ Sector allocations and an underweight exposure to China helped returns as ongoing property sector weakness and U.S. trade tensions weighed on market performance ↑ An overweight exposure to Peru contributed to Index-relative returns as the headline performance was boosted by a significant rally among mining companies |
|
| Performance Past Does Not Indicate Future [Text] |
THE FUND'S PAST PERFORMANCE IS NO GUARANTEE OF FUTURE RESULTS.
|
|
| Line Graph [Table Text Block] |
Comparison of the change in value of a $10,000 investment for the period indicated.
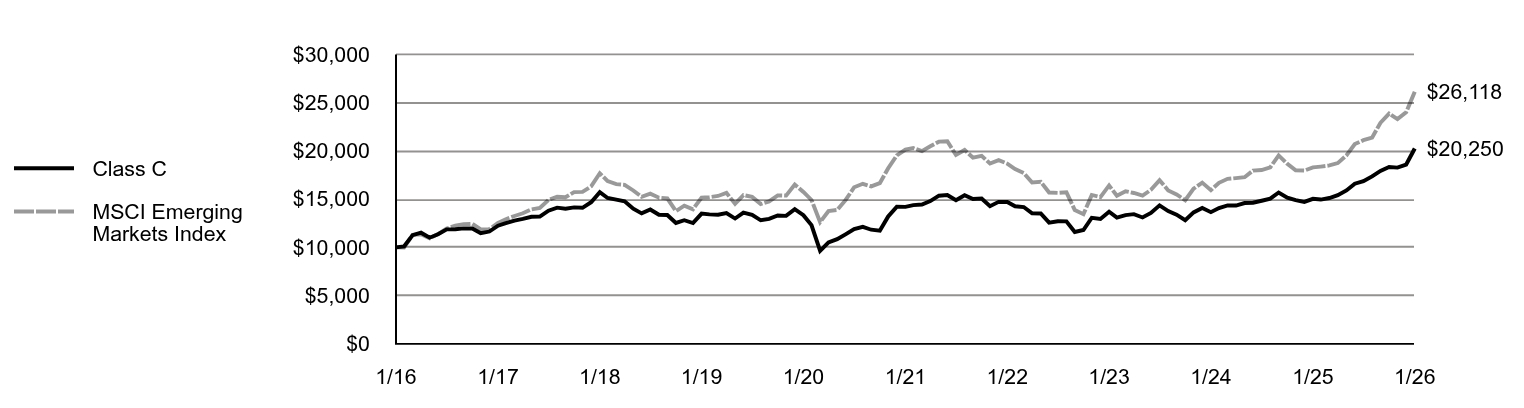
Table Summary
|
Class C |
MSCI Emerging Markets Index |
1/16 |
$10,000 |
$10,000 |
2/16 |
$10,092 |
$9,984 |
3/16 |
$11,273 |
$11,305 |
4/16 |
$11,522 |
$11,366 |
5/16 |
$11,006 |
$10,942 |
6/16 |
$11,363 |
$11,380 |
7/16 |
$11,867 |
$11,952 |
8/16 |
$11,876 |
$12,249 |
9/16 |
$11,970 |
$12,407 |
10/16 |
$11,960 |
$12,436 |
11/16 |
$11,465 |
$11,864 |
12/16 |
$11,643 |
$11,890 |
1/17 |
$12,250 |
$12,541 |
2/17 |
$12,520 |
$12,925 |
3/17 |
$12,782 |
$13,251 |
4/17 |
$12,950 |
$13,541 |
5/17 |
$13,174 |
$13,941 |
6/17 |
$13,193 |
$14,082 |
7/17 |
$13,804 |
$14,921 |
8/17 |
$14,115 |
$15,254 |
9/17 |
$14,011 |
$15,193 |
10/17 |
$14,143 |
$15,726 |
11/17 |
$14,106 |
$15,757 |
12/17 |
$14,683 |
$16,323 |
1/18 |
$15,719 |
$17,683 |
2/18 |
$15,121 |
$16,868 |
3/18 |
$14,940 |
$16,554 |
4/18 |
$14,778 |
$16,481 |
5/18 |
$14,009 |
$15,897 |
6/18 |
$13,524 |
$15,237 |
7/18 |
$13,923 |
$15,571 |
8/18 |
$13,381 |
$15,150 |
9/18 |
$13,353 |
$15,070 |
10/18 |
$12,535 |
$13,758 |
11/18 |
$12,811 |
$14,324 |
12/18 |
$12,529 |
$13,945 |
1/19 |
$13,503 |
$15,166 |
2/19 |
$13,416 |
$15,200 |
3/19 |
$13,387 |
$15,328 |
4/19 |
$13,551 |
$15,650 |
5/19 |
$12,992 |
$14,515 |
6/19 |
$13,609 |
$15,421 |
7/19 |
$13,377 |
$15,232 |
8/19 |
$12,809 |
$14,489 |
9/19 |
$12,963 |
$14,766 |
10/19 |
$13,300 |
$15,389 |
11/19 |
$13,271 |
$15,367 |
12/19 |
$13,966 |
$16,514 |
1/20 |
$13,339 |
$15,744 |
2/20 |
$12,311 |
$14,914 |
3/20 |
$9,647 |
$12,617 |
4/20 |
$10,509 |
$13,772 |
5/20 |
$10,852 |
$13,878 |
6/20 |
$11,351 |
$14,898 |
7/20 |
$11,890 |
$16,229 |
8/20 |
$12,126 |
$16,588 |
9/20 |
$11,832 |
$16,322 |
10/20 |
$11,734 |
$16,658 |
11/20 |
$13,205 |
$18,199 |
12/20 |
$14,216 |
$19,537 |
1/21 |
$14,196 |
$20,136 |
2/21 |
$14,382 |
$20,290 |
3/21 |
$14,441 |
$19,984 |
4/21 |
$14,794 |
$20,481 |
5/21 |
$15,354 |
$20,956 |
6/21 |
$15,422 |
$20,992 |
7/21 |
$14,883 |
$19,579 |
8/21 |
$15,403 |
$20,092 |
9/21 |
$15,010 |
$19,293 |
10/21 |
$15,059 |
$19,484 |
11/21 |
$14,275 |
$18,690 |
12/21 |
$14,716 |
$19,040 |
1/22 |
$14,706 |
$18,680 |
2/22 |
$14,262 |
$18,122 |
3/22 |
$14,183 |
$17,712 |
4/22 |
$13,531 |
$16,727 |
5/22 |
$13,511 |
$16,801 |
6/22 |
$12,563 |
$15,684 |
7/22 |
$12,711 |
$15,646 |
8/22 |
$12,691 |
$15,711 |
9/22 |
$11,595 |
$13,869 |
10/22 |
$11,802 |
$13,439 |
11/22 |
$13,067 |
$15,432 |
12/22 |
$12,950 |
$15,215 |
1/23 |
$13,686 |
$16,416 |
2/23 |
$13,083 |
$15,352 |
3/23 |
$13,339 |
$15,817 |
4/23 |
$13,441 |
$15,638 |
5/23 |
$13,104 |
$15,375 |
6/23 |
$13,564 |
$15,959 |
7/23 |
$14,351 |
$16,952 |
8/23 |
$13,758 |
$15,908 |
9/23 |
$13,390 |
$15,492 |
10/23 |
$12,818 |
$14,890 |
11/23 |
$13,625 |
$16,082 |
12/23 |
$14,077 |
$16,710 |
1/24 |
$13,652 |
$15,934 |
2/24 |
$14,077 |
$16,692 |
3/24 |
$14,346 |
$17,106 |
4/24 |
$14,336 |
$17,183 |
5/24 |
$14,595 |
$17,280 |
6/24 |
$14,626 |
$17,961 |
7/24 |
$14,833 |
$18,015 |
8/24 |
$15,051 |
$18,305 |
9/24 |
$15,682 |
$19,528 |
10/24 |
$15,154 |
$18,659 |
11/24 |
$14,895 |
$17,989 |
12/24 |
$14,714 |
$17,964 |
1/25 |
$15,031 |
$18,285 |
2/25 |
$14,957 |
$18,374 |
3/25 |
$15,116 |
$18,490 |
4/25 |
$15,412 |
$18,733 |
5/25 |
$15,908 |
$19,532 |
6/25 |
$16,595 |
$20,707 |
7/25 |
$16,859 |
$21,110 |
8/25 |
$17,366 |
$21,381 |
9/25 |
$17,926 |
$22,911 |
10/25 |
$18,327 |
$23,868 |
11/25 |
$18,264 |
$23,297 |
12/25 |
$18,580 |
$23,994 |
1/26 |
$20,250 |
$26,118 | |
|
| Average Annual Return [Table Text Block] |
Average Annual Total Returns (%)
Table Summary
Fund |
1 Year |
5 Years |
10 Years |
Class C, with conversion to Class A after 8 years |
32.82% |
7.05% |
7.30% |
Class C, with 1% Maximum Contingent Deferred Sales Charge and conversion to Class A after 8 years |
31.82% |
7.05% |
7.30% |
MSCI Emerging Markets Index (net of foreign withholding taxes) |
42.84% |
5.34% |
10.07% | Performance does not reflect the deduction of taxes that a shareholder would pay on Fund distributions or redemption of Fund shares. Performance assumes that all dividends and distributions, if any, were reinvested. For more recent performance information, visit www.eatonvance.com/performance.php. THE FUND'S PAST PERFORMANCE IS NO GUARANTEE OF FUTURE RESULTS. |
|
| No Deduction of Taxes [Text Block] |
Performance does not reflect the deduction of taxes that a shareholder would pay on Fund distributions or redemption of Fund shares.
|
|
| Material Change Date |
|
Jan. 31, 2025
|
| Updated Performance Information Location [Text Block] |
For more recent performance information, visit www.eatonvance.com/performance.php.
|
|
| AssetsNet |
$ 217,564,694
|
|
| Holdings Count | Holding |
1,162
|
|
| Advisory Fees Paid, Amount |
$ 1,436,513
|
|
| InvestmentCompanyPortfolioTurnover |
2.00%
|
|
| Additional Fund Statistics [Text Block] |
Table Summary
Total Net Assets |
$217,564,694 |
# of Portfolio Holdings |
1,162 |
Portfolio Turnover Rate |
2% |
Total Advisory Fees Paid |
$1,436,513 | |
|
| Holdings [Text Block] |
Geographic Allocation (% of total investments)
Table Summary
Value |
Value |
Developed Europe |
0.6% |
North America |
0.6% |
Africa |
7.9% |
Middle East |
10.9% |
Emerging Europe |
13.5% |
Latin America |
17.0% |
Asia |
49.5% | |
|
| Largest Holdings [Text Block] |
Top Ten Holdings (% of total investments)Footnote Referencea
Table Summary
Taiwan Semiconductor Manufacturing Co. Ltd. |
2.0% |
Delta Electronics (Thailand) PCL |
1.3% |
Tencent Holdings Ltd. |
1.1% |
Samsung Electronics Co. Ltd. |
1.1% |
Vingroup JSC |
0.8% |
America Movil SAB de CV, Series B |
0.7% |
SK Hynix, Inc. |
0.7% |
Southern Copper Corp. |
0.6% |
Naspers Ltd., Class N |
0.6% |
MTN Group Ltd. |
0.6% |
Total |
9.5% |
| Footnote |
Description |
Footnotea |
Excluding cash equivalents | |
|
| Material Fund Change [Text Block] |
This is a summary of certain changes to the Fund since January 31, 2025. For more complete information, you may review the Fund’s next prospectus, which we expect to be available by June 1, 2026 at www.eatonvance.com/parametric-fund-documents.php or upon request by contacting us at 1-800-260-0761. Effective July 1, 2025, Eaton Vance Management and Parametric Portfolio Associates LLC have agreed to reimburse the Fund’s expenses to the extent that total annual operating expenses (relating to ordinary operating expenses only and excluding expenses such as brokerage commissions, acquired fund fees and expenses of unaffiliated funds, borrowing costs, taxes or litigation expenses) exceed 2.19% (2.24% prior to July 1, 2025) of the Fund’s average daily net assets for Class C. This agreement may be changed or terminated after June 1, 2027. |
|
| Material Fund Change Expenses [Text Block] |
Effective July 1, 2025, Eaton Vance Management and Parametric Portfolio Associates LLC have agreed to reimburse the Fund’s expenses to the extent that total annual operating expenses (relating to ordinary operating expenses only and excluding expenses such as brokerage commissions, acquired fund fees and expenses of unaffiliated funds, borrowing costs, taxes or litigation expenses) exceed 2.19% (2.24% prior to July 1, 2025) of the Fund’s average daily net assets for Class C. This agreement may be changed or terminated after June 1, 2027.
|
|
| Summary of Change Legend [Text Block] |
This is a summary of certain changes to the Fund since January 31, 2025. For more complete information, you may review the Fund’s next prospectus, which we expect to be available by June 1, 2026 at www.eatonvance.com/parametric-fund-documents.php or upon request by contacting us at 1-800-260-0761.
|
|
| Updated Prospectus Phone Number |
1-800-260-0761
|
|
| C000034231 |
|
|
| Shareholder Report [Line Items] |
|
|
| Fund Name |
Parametric Emerging Markets Fund
|
|
| Class Name |
Class I
|
|
| Trading Symbol |
EIEMX
|
|
| Annual or Semi-Annual Statement [Text Block] |
This annual shareholder report contains important information about the Parametric Emerging Markets Fund for the period of February 1, 2025 to January 31, 2026.
|
|
| Additional Information [Text Block] |
You can find additional information about the Fund at www.eatonvance.com/parametric-fund-documents.php. You can also request this information by contacting us at 1-800-260-0761.
|
|
| Material Fund Change Notice [Text Block] |
This report describes changes to the Fund that occurred during the reporting period.
|
|
| Additional Information Phone Number |
1-800-260-0761
|
|
| Additional Information Website |
<span style="box-sizing: border-box; color: rgb(0, 0, 0); display: inline; flex-wrap: nowrap; font-size: 10.6667px; font-weight: 400; grid-area: auto; line-height: 16px; margin: 0px; overflow: visible; text-align: left; text-align-last: auto; white-space-collapse: preserve-breaks;">www.eatonvance.com/parametric-fund-documents.php</span>
|
|
| Expenses [Text Block] |
What were the Fund costs for the last year?(based on a hypothetical $10,000 investment)
Table Summary
Class Name |
Costs of a $10,000 investment |
Costs paid as a percentage of a $10,000 investment |
Class I |
$142 |
1.21% | |
|
| Expenses Paid, Amount |
$ 142
|
|
| Expense Ratio, Percent |
1.21%
|
|
| Factors Affecting Performance [Text Block] |
How did the Fund perform last year and what affected its performance?Key contributors to (↑) and detractors from (↓) performance, relative to the MSCI Emerging Markets Index (the Index): ↓ Underweight exposure to South Korea, including its technology sector, detracted from returns as tech stocks propelled significant country-level gains ↓ Sector allocations and an underweight exposure to Taiwan detracted from Index-relative returns as technology stocks drove a significant country-wide rally ↓ An overweight exposure to Turkey hurt returns as a significant decline in Turkey’s foreign exchange rate versus the dollar weighed on overall results for the country ↑ In contrast, an underweight exposure to India contributed to performance as India’s market struggled to gain ground due to trade frictions with the U.S. ↑ Sector allocations and an underweight exposure to China helped returns as ongoing property sector weakness and U.S. trade tensions weighed on market performance ↑ An overweight exposure to Peru contributed to Index-relative returns as the headline performance was boosted by a significant rally among mining companies |
|
| Performance Past Does Not Indicate Future [Text] |
THE FUND'S PAST PERFORMANCE IS NO GUARANTEE OF FUTURE RESULTS.
|
|
| Line Graph [Table Text Block] |
Comparison of the change in value of a $1,000,000 investment for the period indicated.
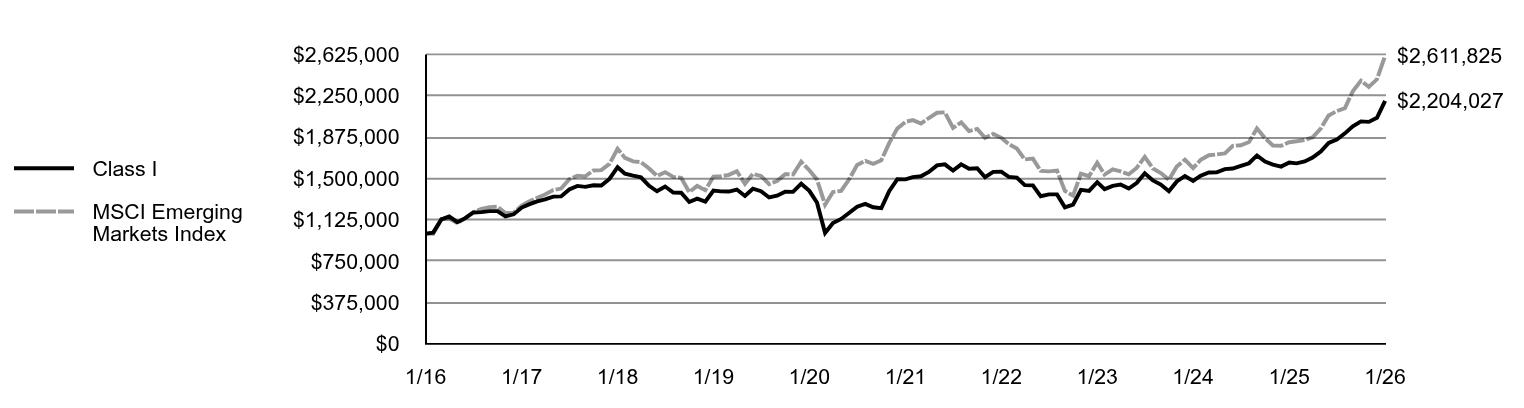
Table Summary
|
Class I |
MSCI Emerging Markets Index |
1/16 |
$1,000,000 |
$1,000,000 |
2/16 |
$1,009,058 |
$998,364 |
3/16 |
$1,128,623 |
$1,130,475 |
4/16 |
$1,154,891 |
$1,136,619 |
5/16 |
$1,104,167 |
$1,094,220 |
6/16 |
$1,140,290 |
$1,137,953 |
7/16 |
$1,191,662 |
$1,195,217 |
8/16 |
$1,194,415 |
$1,224,921 |
9/16 |
$1,203,588 |
$1,240,672 |
10/16 |
$1,203,588 |
$1,243,630 |
11/16 |
$1,155,885 |
$1,186,384 |
12/16 |
$1,174,569 |
$1,189,004 |
1/17 |
$1,236,388 |
$1,254,070 |
2/17 |
$1,264,991 |
$1,292,459 |
3/17 |
$1,292,672 |
$1,325,086 |
4/17 |
$1,311,125 |
$1,354,096 |
5/17 |
$1,335,115 |
$1,394,129 |
6/17 |
$1,336,960 |
$1,408,163 |
7/17 |
$1,400,108 |
$1,492,103 |
8/17 |
$1,432,733 |
$1,525,385 |
9/17 |
$1,424,344 |
$1,519,320 |
10/17 |
$1,438,326 |
$1,572,581 |
11/17 |
$1,436,462 |
$1,575,738 |
12/17 |
$1,495,775 |
$1,632,302 |
1/18 |
$1,601,872 |
$1,768,348 |
2/18 |
$1,543,140 |
$1,686,793 |
3/18 |
$1,525,141 |
$1,655,429 |
4/18 |
$1,509,984 |
$1,648,105 |
5/18 |
$1,433,254 |
$1,589,706 |
6/18 |
$1,383,995 |
$1,523,659 |
7/18 |
$1,426,623 |
$1,557,129 |
8/18 |
$1,372,540 |
$1,515,026 |
9/18 |
$1,370,644 |
$1,506,985 |
10/18 |
$1,287,230 |
$1,375,753 |
11/18 |
$1,316,615 |
$1,432,447 |
12/18 |
$1,289,397 |
$1,394,500 |
1/19 |
$1,390,450 |
$1,516,599 |
2/19 |
$1,382,677 |
$1,520,009 |
3/19 |
$1,381,705 |
$1,532,766 |
4/19 |
$1,399,195 |
$1,565,033 |
5/19 |
$1,341,867 |
$1,451,472 |
6/19 |
$1,406,968 |
$1,542,060 |
7/19 |
$1,384,620 |
$1,523,204 |
8/19 |
$1,327,292 |
$1,448,938 |
9/19 |
$1,343,810 |
$1,476,598 |
10/19 |
$1,379,762 |
$1,538,861 |
11/19 |
$1,378,790 |
$1,536,744 |
12/19 |
$1,452,566 |
$1,651,393 |
1/20 |
$1,387,675 |
$1,574,414 |
2/20 |
$1,281,852 |
$1,491,390 |
3/20 |
$1,005,315 |
$1,261,682 |
4/20 |
$1,096,163 |
$1,377,219 |
5/20 |
$1,133,101 |
$1,387,797 |
6/20 |
$1,186,012 |
$1,489,813 |
7/20 |
$1,243,915 |
$1,622,945 |
8/20 |
$1,268,987 |
$1,658,820 |
9/20 |
$1,238,987 |
$1,632,213 |
10/20 |
$1,229,987 |
$1,665,842 |
11/20 |
$1,384,986 |
$1,819,911 |
12/20 |
$1,492,754 |
$1,953,699 |
1/21 |
$1,491,740 |
$2,013,595 |
2/21 |
$1,512,022 |
$2,028,997 |
3/21 |
$1,520,134 |
$1,998,353 |
4/21 |
$1,558,670 |
$2,048,108 |
5/21 |
$1,618,502 |
$2,095,604 |
6/21 |
$1,627,629 |
$2,099,216 |
7/21 |
$1,571,854 |
$1,957,942 |
8/21 |
$1,627,629 |
$2,009,192 |
9/21 |
$1,588,079 |
$1,929,345 |
10/21 |
$1,593,150 |
$1,948,374 |
11/21 |
$1,512,022 |
$1,868,971 |
12/21 |
$1,559,944 |
$1,904,040 |
1/22 |
$1,560,977 |
$1,867,998 |
2/22 |
$1,514,458 |
$1,812,163 |
3/22 |
$1,507,222 |
$1,771,234 |
4/22 |
$1,438,994 |
$1,672,707 |
5/22 |
$1,437,960 |
$1,680,072 |
6/22 |
$1,338,719 |
$1,568,432 |
7/22 |
$1,355,259 |
$1,564,579 |
8/22 |
$1,355,259 |
$1,571,110 |
9/22 |
$1,238,444 |
$1,386,926 |
10/22 |
$1,262,221 |
$1,343,864 |
11/22 |
$1,397,643 |
$1,543,183 |
12/22 |
$1,387,230 |
$1,521,492 |
1/23 |
$1,466,222 |
$1,641,631 |
2/23 |
$1,403,461 |
$1,535,184 |
3/23 |
$1,432,677 |
$1,581,681 |
4/23 |
$1,444,580 |
$1,563,756 |
5/23 |
$1,408,871 |
$1,537,491 |
6/23 |
$1,458,647 |
$1,595,869 |
7/23 |
$1,546,296 |
$1,695,214 |
8/23 |
$1,482,453 |
$1,590,789 |
9/23 |
$1,444,580 |
$1,549,186 |
10/23 |
$1,383,983 |
$1,488,993 |
11/23 |
$1,472,714 |
$1,608,157 |
12/23 |
$1,522,230 |
$1,671,026 |
1/24 |
$1,477,655 |
$1,593,435 |
2/24 |
$1,525,573 |
$1,669,238 |
3/24 |
$1,554,546 |
$1,710,601 |
4/24 |
$1,555,661 |
$1,718,255 |
5/24 |
$1,584,634 |
$1,727,960 |
6/24 |
$1,590,206 |
$1,796,117 |
7/24 |
$1,613,608 |
$1,801,462 |
8/24 |
$1,638,124 |
$1,830,548 |
9/24 |
$1,708,329 |
$1,952,782 |
10/24 |
$1,652,611 |
$1,865,936 |
11/24 |
$1,625,866 |
$1,798,892 |
12/24 |
$1,607,829 |
$1,796,422 |
1/25 |
$1,644,659 |
$1,828,525 |
2/25 |
$1,636,602 |
$1,837,383 |
3/25 |
$1,655,017 |
$1,849,014 |
4/25 |
$1,689,544 |
$1,873,313 |
5/25 |
$1,744,788 |
$1,953,232 |
6/25 |
$1,821,900 |
$2,070,675 |
7/25 |
$1,851,823 |
$2,111,030 |
8/25 |
$1,909,369 |
$2,138,108 |
9/25 |
$1,972,670 |
$2,291,056 |
10/25 |
$2,017,555 |
$2,386,801 |
11/25 |
$2,012,952 |
$2,329,721 |
12/25 |
$2,049,816 |
$2,399,410 |
1/26 |
$2,204,027 |
$2,611,825 | |
|
| Average Annual Return [Table Text Block] |
Average Annual Total Returns (%)
Table Summary
Fund |
1 Year |
5 Years |
10 Years |
Class I |
34.01% |
8.12% |
8.22% |
MSCI Emerging Markets Index (net of foreign withholding taxes) |
42.84% |
5.34% |
10.07% | Performance does not reflect the deduction of taxes that a shareholder would pay on Fund distributions or redemption of Fund shares. Performance assumes that all dividends and distributions, if any, were reinvested. For more recent performance information, visit www.eatonvance.com/performance.php. THE FUND'S PAST PERFORMANCE IS NO GUARANTEE OF FUTURE RESULTS. |
|
| No Deduction of Taxes [Text Block] |
Performance does not reflect the deduction of taxes that a shareholder would pay on Fund distributions or redemption of Fund shares.
|
|
| Material Change Date |
|
Jan. 31, 2025
|
| Updated Performance Information Location [Text Block] |
For more recent performance information, visit www.eatonvance.com/performance.php.
|
|
| AssetsNet |
$ 217,564,694
|
|
| Holdings Count | Holding |
1,162
|
|
| Advisory Fees Paid, Amount |
$ 1,436,513
|
|
| InvestmentCompanyPortfolioTurnover |
2.00%
|
|
| Additional Fund Statistics [Text Block] |
Table Summary
Total Net Assets |
$217,564,694 |
# of Portfolio Holdings |
1,162 |
Portfolio Turnover Rate |
2% |
Total Advisory Fees Paid |
$1,436,513 | |
|
| Holdings [Text Block] |
Geographic Allocation (% of total investments)
Table Summary
Value |
Value |
Developed Europe |
0.6% |
North America |
0.6% |
Africa |
7.9% |
Middle East |
10.9% |
Emerging Europe |
13.5% |
Latin America |
17.0% |
Asia |
49.5% | |
|
| Largest Holdings [Text Block] |
Top Ten Holdings (% of total investments)Footnote Referencea
Table Summary
Taiwan Semiconductor Manufacturing Co. Ltd. |
2.0% |
Delta Electronics (Thailand) PCL |
1.3% |
Tencent Holdings Ltd. |
1.1% |
Samsung Electronics Co. Ltd. |
1.1% |
Vingroup JSC |
0.8% |
America Movil SAB de CV, Series B |
0.7% |
SK Hynix, Inc. |
0.7% |
Southern Copper Corp. |
0.6% |
Naspers Ltd., Class N |
0.6% |
MTN Group Ltd. |
0.6% |
Total |
9.5% |
| Footnote |
Description |
Footnotea |
Excluding cash equivalents | |
|
| Material Fund Change [Text Block] |
This is a summary of certain changes to the Fund since January 31, 2025. For more complete information, you may review the Fund’s next prospectus, which we expect to be available by June 1, 2026 at www.eatonvance.com/parametric-fund-documents.php or upon request by contacting us at 1-800-260-0761. Effective July 1, 2025, Eaton Vance Management and Parametric Portfolio Associates LLC have agreed to reimburse the Fund’s expenses to the extent that total annual operating expenses (relating to ordinary operating expenses only and excluding expenses such as brokerage commissions, acquired fund fees and expenses of unaffiliated funds, borrowing costs, taxes or litigation expenses) exceed 1.19% (1.24% prior to July 1, 2025) of the Fund’s average daily net assets for Class I. This agreement may be changed or terminated after June 1, 2027. |
|
| Material Fund Change Expenses [Text Block] |
Effective July 1, 2025, Eaton Vance Management and Parametric Portfolio Associates LLC have agreed to reimburse the Fund’s expenses to the extent that total annual operating expenses (relating to ordinary operating expenses only and excluding expenses such as brokerage commissions, acquired fund fees and expenses of unaffiliated funds, borrowing costs, taxes or litigation expenses) exceed 1.19% (1.24% prior to July 1, 2025) of the Fund’s average daily net assets for Class I. This agreement may be changed or terminated after June 1, 2027.
|
|
| Summary of Change Legend [Text Block] |
This is a summary of certain changes to the Fund since January 31, 2025. For more complete information, you may review the Fund’s next prospectus, which we expect to be available by June 1, 2026 at www.eatonvance.com/parametric-fund-documents.php or upon request by contacting us at 1-800-260-0761.
|
|
| Updated Prospectus Phone Number |
1-800-260-0761
|
|
| C000142449 |
|
|
| Shareholder Report [Line Items] |
|
|
| Fund Name |
Parametric Emerging Markets Fund
|
|
| Class Name |
Class R6
|
|
| Trading Symbol |
EREMX
|
|
| Annual or Semi-Annual Statement [Text Block] |
This annual shareholder report contains important information about the Parametric Emerging Markets Fund for the period of February 1, 2025 to January 31, 2026.
|
|
| Additional Information [Text Block] |
You can find additional information about the Fund at www.eatonvance.com/parametric-fund-documents.php. You can also request this information by contacting us at 1-800-260-0761.
|
|
| Material Fund Change Notice [Text Block] |
This report describes changes to the Fund that occurred during the reporting period.
|
|
| Additional Information Phone Number |
1-800-260-0761
|
|
| Additional Information Website |
<span style="box-sizing: border-box; color: rgb(0, 0, 0); display: inline; flex-wrap: nowrap; font-size: 10.6667px; font-weight: 400; grid-area: auto; line-height: 16px; margin: 0px; overflow: visible; text-align: left; text-align-last: auto; white-space-collapse: preserve-breaks;">www.eatonvance.com/parametric-fund-documents.php</span>
|
|
| Expenses [Text Block] |
What were the Fund costs for the last year?(based on a hypothetical $10,000 investment)
Table Summary
Class Name |
Costs of a $10,000 investment |
Costs paid as a percentage of a $10,000 investment |
Class R6 |
$133 |
1.14% | |
|
| Expenses Paid, Amount |
$ 133
|
|
| Expense Ratio, Percent |
1.14%
|
|
| Factors Affecting Performance [Text Block] |
How did the Fund perform last year and what affected its performance?Key contributors to (↑) and detractors from (↓) performance, relative to the MSCI Emerging Markets Index (the Index): ↓ Underweight exposure to South Korea, including its technology sector, detracted from returns as tech stocks propelled significant country-level gains ↓ Sector allocations and an underweight exposure to Taiwan detracted from Index-relative returns as technology stocks drove a significant country-wide rally ↓ An overweight exposure to Turkey hurt returns as a significant decline in Turkey’s foreign exchange rate versus the dollar weighed on overall results for the country ↑ In contrast, an underweight exposure to India contributed to performance as India’s market struggled to gain ground due to trade frictions with the U.S. ↑ Sector allocations and an underweight exposure to China helped returns as ongoing property sector weakness and U.S. trade tensions weighed on market performance ↑ An overweight exposure to Peru contributed to Index-relative returns as the headline performance was boosted by a significant rally among mining companies |
|
| Performance Past Does Not Indicate Future [Text] |
THE FUND'S PAST PERFORMANCE IS NO GUARANTEE OF FUTURE RESULTS.
|
|
| Line Graph [Table Text Block] |
Comparison of the change in value of a $5,000,000 investment for the period indicated.
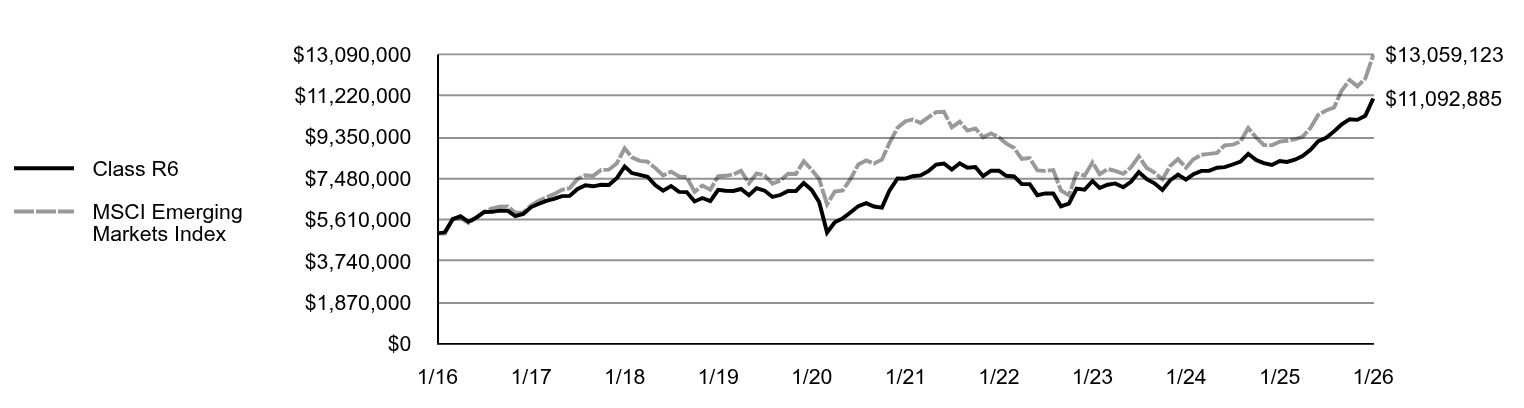
Table Summary
|
Class R6 |
MSCI Emerging Markets Index |
1/16 |
$5,000,000 |
$5,000,000 |
2/16 |
$5,045,290 |
$4,991,819 |
3/16 |
$5,643,116 |
$5,652,373 |
4/16 |
$5,774,457 |
$5,683,093 |
5/16 |
$5,520,833 |
$5,471,102 |
6/16 |
$5,706,209 |
$5,689,767 |
7/16 |
$5,958,494 |
$5,976,086 |
8/16 |
$5,972,254 |
$6,124,604 |
9/16 |
$6,022,711 |
$6,203,358 |
10/16 |
$6,022,711 |
$6,218,149 |
11/16 |
$5,779,601 |
$5,931,922 |
12/16 |
$5,876,273 |
$5,945,020 |
1/17 |
$6,185,550 |
$6,270,350 |
2/17 |
$6,324,032 |
$6,462,297 |
3/17 |
$6,467,131 |
$6,625,428 |
4/17 |
$6,559,453 |
$6,770,481 |
5/17 |
$6,679,471 |
$6,970,646 |
6/17 |
$6,693,319 |
$7,040,816 |
7/17 |
$7,004,624 |
$7,460,516 |
8/17 |
$7,172,511 |
$7,626,925 |
9/17 |
$7,125,876 |
$7,596,599 |
10/17 |
$7,195,829 |
$7,862,904 |
11/17 |
$7,186,501 |
$7,878,688 |
12/17 |
$7,486,256 |
$8,161,510 |
1/18 |
$8,022,004 |
$8,841,737 |
2/18 |
$7,723,313 |
$8,433,963 |
3/18 |
$7,637,972 |
$8,277,147 |
4/18 |
$7,557,373 |
$8,240,526 |
5/18 |
$7,173,341 |
$7,948,531 |
6/18 |
$6,931,543 |
$7,618,294 |
7/18 |
$7,140,153 |
$7,785,647 |
8/18 |
$6,874,679 |
$7,575,129 |
9/18 |
$6,865,191 |
$7,534,926 |
10/18 |
$6,442,936 |
$6,878,765 |
11/18 |
$6,594,758 |
$7,162,237 |
12/18 |
$6,453,746 |
$6,972,500 |
1/19 |
$6,964,790 |
$7,582,995 |
2/19 |
$6,925,853 |
$7,600,044 |
3/19 |
$6,916,119 |
$7,663,829 |
4/19 |
$7,003,726 |
$7,825,167 |
5/19 |
$6,721,436 |
$7,257,362 |
6/19 |
$7,042,663 |
$7,710,302 |
7/19 |
$6,930,720 |
$7,616,021 |
8/19 |
$6,643,563 |
$7,244,689 |
9/19 |
$6,731,170 |
$7,382,988 |
10/19 |
$6,911,252 |
$7,694,305 |
11/19 |
$6,906,385 |
$7,683,718 |
12/19 |
$7,271,367 |
$8,256,965 |
1/20 |
$6,956,091 |
$7,872,069 |
2/20 |
$6,420,622 |
$7,456,950 |
3/20 |
$5,039,413 |
$6,308,410 |
4/20 |
$5,494,811 |
$6,886,095 |
5/20 |
$5,674,969 |
$6,938,985 |
6/20 |
$5,945,206 |
$7,449,063 |
7/20 |
$6,230,456 |
$8,114,725 |
8/20 |
$6,361,145 |
$8,294,098 |
9/20 |
$6,210,763 |
$8,161,066 |
10/20 |
$6,160,636 |
$8,329,209 |
11/20 |
$6,942,621 |
$9,099,556 |
12/20 |
$7,484,851 |
$9,768,496 |
1/21 |
$7,474,675 |
$10,067,976 |
2/21 |
$7,581,529 |
$10,144,983 |
3/21 |
$7,617,146 |
$9,991,767 |
4/21 |
$7,810,501 |
$10,240,540 |
5/21 |
$8,110,709 |
$10,478,022 |
6/21 |
$8,156,504 |
$10,496,079 |
7/21 |
$7,886,825 |
$9,789,709 |
8/21 |
$8,166,680 |
$10,045,958 |
9/21 |
$7,968,237 |
$9,646,724 |
10/21 |
$7,998,767 |
$9,741,868 |
11/21 |
$7,586,617 |
$9,344,856 |
12/21 |
$7,829,647 |
$9,520,198 |
1/22 |
$7,834,839 |
$9,339,990 |
2/22 |
$7,601,196 |
$9,060,816 |
3/22 |
$7,570,043 |
$8,856,171 |
4/22 |
$7,227,367 |
$8,363,535 |
5/22 |
$7,222,174 |
$8,400,358 |
6/22 |
$6,723,735 |
$7,842,158 |
7/22 |
$6,806,809 |
$7,822,893 |
8/22 |
$6,801,616 |
$7,855,552 |
9/22 |
$6,220,104 |
$6,934,628 |
10/22 |
$6,339,522 |
$6,719,319 |
11/22 |
$7,019,684 |
$7,715,913 |
12/22 |
$6,968,238 |
$7,607,461 |
1/23 |
$7,365,335 |
$8,208,157 |
2/23 |
$7,049,833 |
$7,675,921 |
3/23 |
$7,196,705 |
$7,908,403 |
4/23 |
$7,256,542 |
$7,818,780 |
5/23 |
$7,082,472 |
$7,687,454 |
6/23 |
$7,332,697 |
$7,979,345 |
7/23 |
$7,767,872 |
$8,476,070 |
8/23 |
$7,452,370 |
$7,953,943 |
9/23 |
$7,261,981 |
$7,745,930 |
10/23 |
$6,957,359 |
$7,444,963 |
11/23 |
$7,397,973 |
$8,040,784 |
12/23 |
$7,652,670 |
$8,355,132 |
1/24 |
$7,428,416 |
$7,967,173 |
2/24 |
$7,669,489 |
$8,346,190 |
3/24 |
$7,820,860 |
$8,553,006 |
4/24 |
$7,826,467 |
$8,591,274 |
5/24 |
$7,966,626 |
$8,639,799 |
6/24 |
$7,994,657 |
$8,980,584 |
7/24 |
$8,112,391 |
$9,007,311 |
8/24 |
$8,241,337 |
$9,152,738 |
9/24 |
$8,594,537 |
$9,763,912 |
10/24 |
$8,314,219 |
$9,329,679 |
11/24 |
$8,174,061 |
$8,994,462 |
12/24 |
$8,090,036 |
$8,982,111 |
1/25 |
$8,269,686 |
$9,142,623 |
2/25 |
$8,229,120 |
$9,186,916 |
3/25 |
$8,327,638 |
$9,245,072 |
4/25 |
$8,495,697 |
$9,366,563 |
5/25 |
$8,779,660 |
$9,766,162 |
6/25 |
$9,162,140 |
$10,353,374 |
7/25 |
$9,318,609 |
$10,555,149 |
8/25 |
$9,608,367 |
$10,690,538 |
9/25 |
$9,927,100 |
$11,455,281 |
10/25 |
$10,158,907 |
$11,934,006 |
11/25 |
$10,129,931 |
$11,648,606 |
12/25 |
$10,315,905 |
$11,997,052 |
1/26 |
$11,092,885 |
$13,059,123 | |
|
| Average Annual Return [Table Text Block] |
Average Annual Total Returns (%)
Table Summary
Fund |
1 Year |
5 Years |
10 Years |
Class R6 |
34.14% |
8.21% |
8.29% |
MSCI Emerging Markets Index (net of foreign withholding taxes) |
42.84% |
5.34% |
10.07% | Performance does not reflect the deduction of taxes that a shareholder would pay on Fund distributions or redemption of Fund shares. Performance assumes that all dividends and distributions, if any, were reinvested. For more recent performance information, visit www.eatonvance.com/performance.php. THE FUND'S PAST PERFORMANCE IS NO GUARANTEE OF FUTURE RESULTS. |
|
| No Deduction of Taxes [Text Block] |
Performance does not reflect the deduction of taxes that a shareholder would pay on Fund distributions or redemption of Fund shares.
|
|
| Material Change Date |
|
Jan. 31, 2025
|
| Updated Performance Information Location [Text Block] |
For more recent performance information, visit www.eatonvance.com/performance.php.
|
|
| AssetsNet |
$ 217,564,694
|
|
| Holdings Count | Holding |
1,162
|
|
| Advisory Fees Paid, Amount |
$ 1,436,513
|
|
| InvestmentCompanyPortfolioTurnover |
2.00%
|
|
| Additional Fund Statistics [Text Block] |
Table Summary
Total Net Assets |
$217,564,694 |
# of Portfolio Holdings |
1,162 |
Portfolio Turnover Rate |
2% |
Total Advisory Fees Paid |
$1,436,513 | |
|
| Holdings [Text Block] |
Geographic Allocation (% of total investments)
Table Summary
Value |
Value |
Developed Europe |
0.6% |
North America |
0.6% |
Africa |
7.9% |
Middle East |
10.9% |
Emerging Europe |
13.5% |
Latin America |
17.0% |
Asia |
49.5% | |
|
| Largest Holdings [Text Block] |
Top Ten Holdings (% of total investments)Footnote Referencea
Table Summary
Taiwan Semiconductor Manufacturing Co. Ltd. |
2.0% |
Delta Electronics (Thailand) PCL |
1.3% |
Tencent Holdings Ltd. |
1.1% |
Samsung Electronics Co. Ltd. |
1.1% |
Vingroup JSC |
0.8% |
America Movil SAB de CV, Series B |
0.7% |
SK Hynix, Inc. |
0.7% |
Southern Copper Corp. |
0.6% |
Naspers Ltd., Class N |
0.6% |
MTN Group Ltd. |
0.6% |
Total |
9.5% |
| Footnote |
Description |
Footnotea |
Excluding cash equivalents | |
|
| Material Fund Change [Text Block] |
This is a summary of certain changes to the Fund since January 31, 2025. For more complete information, you may review the Fund’s next prospectus, which we expect to be available by June 1, 2026 at www.eatonvance.com/parametric-fund-documents.php or upon request by contacting us at 1-800-260-0761. Effective July 1, 2025, Eaton Vance Management and Parametric Portfolio Associates LLC have agreed to reimburse the Fund’s expenses to the extent that total annual operating expenses (relating to ordinary operating expenses only and excluding expenses such as brokerage commissions, acquired fund fees and expenses of unaffiliated funds, borrowing costs, taxes or litigation expenses) exceed 1.12% (1.17% prior to July 1, 2025) of the Fund’s average daily net assets for Class R6. This agreement may be changed or terminated after June 1, 2027. |
|
| Material Fund Change Expenses [Text Block] |
Effective July 1, 2025, Eaton Vance Management and Parametric Portfolio Associates LLC have agreed to reimburse the Fund’s expenses to the extent that total annual operating expenses (relating to ordinary operating expenses only and excluding expenses such as brokerage commissions, acquired fund fees and expenses of unaffiliated funds, borrowing costs, taxes or litigation expenses) exceed 1.12% (1.17% prior to July 1, 2025) of the Fund’s average daily net assets for Class R6. This agreement may be changed or terminated after June 1, 2027.
|
|
| Summary of Change Legend [Text Block] |
This is a summary of certain changes to the Fund since January 31, 2025. For more complete information, you may review the Fund’s next prospectus, which we expect to be available by June 1, 2026 at www.eatonvance.com/parametric-fund-documents.php or upon request by contacting us at 1-800-260-0761.
|
|
| Updated Prospectus Phone Number |
1-800-260-0761
|
|
| C000086647 |
|
|
| Shareholder Report [Line Items] |
|
|
| Fund Name |
Parametric International Equity Fund
|
|
| Class Name |
Class A
|
|
| Trading Symbol |
EAISX
|
|
| Annual or Semi-Annual Statement [Text Block] |
This annual shareholder report contains important information about the Parametric International Equity Fund for the period of February 1, 2025 to January 31, 2026.
|
|
| Additional Information [Text Block] |
You can find additional information about the Fund at www.eatonvance.com/parametric-fund-documents.php. You can also request this information by contacting us at 1-800-260-0761.
|
|
| Additional Information Phone Number |
1-800-260-0761
|
|
| Additional Information Website |
<span style="box-sizing: border-box; color: rgb(0, 0, 0); display: inline; flex-wrap: nowrap; font-size: 10.6667px; font-weight: 400; grid-area: auto; line-height: 16px; margin: 0px; overflow: visible; text-align: left; text-align-last: auto; white-space-collapse: preserve-breaks;">www.eatonvance.com/parametric-fund-documents.php</span>
|
|
| Expenses [Text Block] |
What were the Fund costs for the last year?(based on a hypothetical $10,000 investment)
Table Summary
Class Name |
Costs of a $10,000 investment |
Costs paid as a percentage of a $10,000 investment |
Class A |
$88 |
0.77% | |
|
| Expenses Paid, Amount |
$ 88
|
|
| Expense Ratio, Percent |
0.77%
|
|
| Factors Affecting Performance [Text Block] |
How did the Fund perform last year and what affected its performance?Key contributors to (↑) and detractors from (↓) performance, relative to the MSCI EAFE Index (the Index): ↓ Sector allocation and an underweight to Netherlands hurt returns, partly due to an underweight to information technology, which surged over the period ↓ Stock selections in Japan also detracted from returns, partly due to excluding high beta stocks within the information technology sector that outperformed ↓ Security selection in Germany further weighed on performance partly due to the exclusion of high beta materials stocks that experienced gains ↑ Sector allocations in Israel contributed to Index-relative performance, partly due to an underweight to information technology which declined ↑ An overweight exposure to Belgium and active security selection within the materials sector helped performance. Strong returns from financials, health care and consumer staples also boosted results ↑ An underweight exposure to France helped returns as headline performance trailed amid weakening demand for the country’s consumer discretionary goods |
|
| Performance Past Does Not Indicate Future [Text] |
THE FUND'S PAST PERFORMANCE IS NO GUARANTEE OF FUTURE RESULTS.
|
|
| Line Graph [Table Text Block] |
Comparison of the change in value of a $10,000 investment for the period indicated.
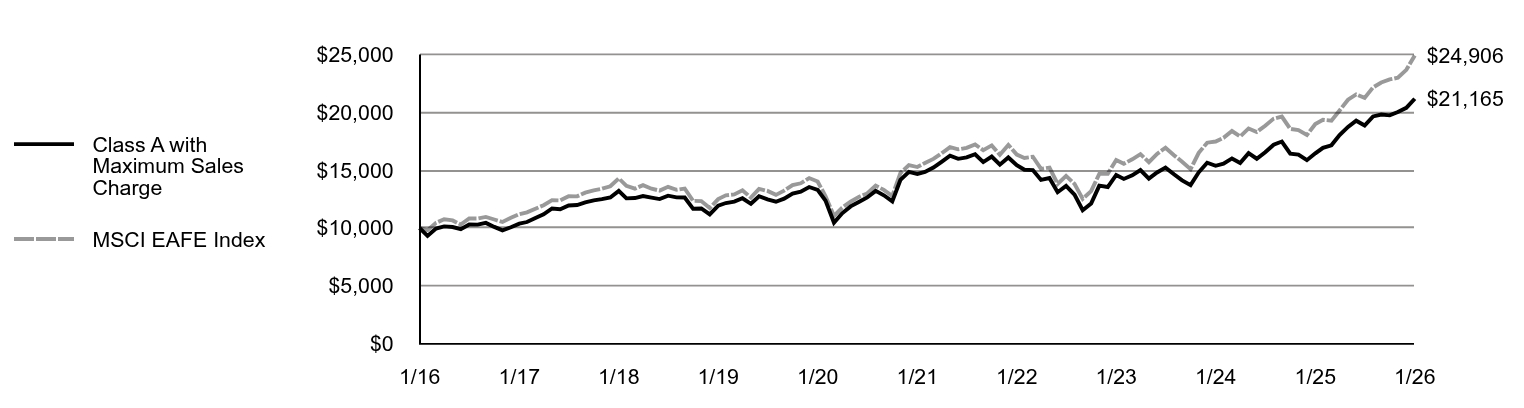
Table Summary
|
Class A with Maximum Sales Charge |
MSCI EAFE Index |
1/16 |
$10,000 |
$10,000 |
2/16 |
$9,325 |
$9,817 |
3/16 |
$9,960 |
$10,456 |
4/16 |
$10,145 |
$10,758 |
5/16 |
$10,093 |
$10,661 |
6/16 |
$9,909 |
$10,303 |
7/16 |
$10,307 |
$10,825 |
8/16 |
$10,298 |
$10,833 |
9/16 |
$10,448 |
$10,966 |
10/16 |
$10,103 |
$10,741 |
11/16 |
$9,803 |
$10,527 |
12/16 |
$10,075 |
$10,887 |
1/17 |
$10,380 |
$11,203 |
2/17 |
$10,524 |
$11,363 |
3/17 |
$10,873 |
$11,676 |
4/17 |
$11,187 |
$11,973 |
5/17 |
$11,690 |
$12,413 |
6/17 |
$11,627 |
$12,391 |
7/17 |
$11,950 |
$12,748 |
8/17 |
$11,995 |
$12,743 |
9/17 |
$12,219 |
$13,060 |
10/17 |
$12,390 |
$13,259 |
11/17 |
$12,497 |
$13,398 |
12/17 |
$12,642 |
$13,613 |
1/18 |
$13,213 |
$14,296 |
2/18 |
$12,569 |
$13,650 |
3/18 |
$12,596 |
$13,404 |
4/18 |
$12,771 |
$13,710 |
5/18 |
$12,633 |
$13,402 |
6/18 |
$12,504 |
$13,239 |
7/18 |
$12,799 |
$13,564 |
8/18 |
$12,649 |
$13,302 |
9/18 |
$12,639 |
$13,418 |
10/18 |
$11,668 |
$12,350 |
11/18 |
$11,696 |
$12,334 |
12/18 |
$11,187 |
$11,736 |
1/19 |
$11,928 |
$12,507 |
2/19 |
$12,166 |
$12,826 |
3/19 |
$12,289 |
$12,907 |
4/19 |
$12,574 |
$13,269 |
5/19 |
$12,099 |
$12,632 |
6/19 |
$12,745 |
$13,382 |
7/19 |
$12,479 |
$13,212 |
8/19 |
$12,277 |
$12,869 |
9/19 |
$12,543 |
$13,238 |
10/19 |
$12,972 |
$13,714 |
11/19 |
$13,143 |
$13,868 |
12/19 |
$13,546 |
$14,319 |
1/20 |
$13,303 |
$14,020 |
2/20 |
$12,370 |
$12,753 |
3/20 |
$10,464 |
$11,051 |
4/20 |
$11,280 |
$11,765 |
5/20 |
$11,874 |
$12,277 |
6/20 |
$12,253 |
$12,695 |
7/20 |
$12,642 |
$12,991 |
8/20 |
$13,213 |
$13,659 |
9/20 |
$12,833 |
$13,304 |
10/20 |
$12,307 |
$12,773 |
11/20 |
$14,167 |
$14,752 |
12/20 |
$14,848 |
$15,438 |
1/21 |
$14,680 |
$15,274 |
2/21 |
$14,848 |
$15,616 |
3/21 |
$15,232 |
$15,976 |
4/21 |
$15,725 |
$16,456 |
5/21 |
$16,248 |
$16,993 |
6/21 |
$15,982 |
$16,802 |
7/21 |
$16,110 |
$16,928 |
8/21 |
$16,376 |
$17,227 |
9/21 |
$15,706 |
$16,727 |
10/21 |
$16,179 |
$17,138 |
11/21 |
$15,479 |
$16,341 |
12/21 |
$16,100 |
$17,177 |
1/22 |
$15,440 |
$16,347 |
2/22 |
$15,038 |
$16,058 |
3/22 |
$15,007 |
$16,161 |
4/22 |
$14,161 |
$15,116 |
5/22 |
$14,326 |
$15,229 |
6/22 |
$13,099 |
$13,816 |
7/22 |
$13,645 |
$14,504 |
8/22 |
$12,892 |
$13,816 |
9/22 |
$11,541 |
$12,523 |
10/22 |
$12,129 |
$13,197 |
11/22 |
$13,666 |
$14,683 |
12/22 |
$13,548 |
$14,695 |
1/23 |
$14,589 |
$15,885 |
2/23 |
$14,245 |
$15,553 |
3/23 |
$14,556 |
$15,939 |
4/23 |
$15,007 |
$16,389 |
5/23 |
$14,278 |
$15,695 |
6/23 |
$14,803 |
$16,410 |
7/23 |
$15,222 |
$16,940 |
8/23 |
$14,642 |
$16,291 |
9/23 |
$14,127 |
$15,735 |
10/23 |
$13,709 |
$15,097 |
11/23 |
$14,814 |
$16,498 |
12/23 |
$15,648 |
$17,375 |
1/24 |
$15,383 |
$17,475 |
2/24 |
$15,560 |
$17,795 |
3/24 |
$16,013 |
$18,380 |
4/24 |
$15,626 |
$17,909 |
5/24 |
$16,466 |
$18,603 |
6/24 |
$15,991 |
$18,303 |
7/24 |
$16,554 |
$18,840 |
8/24 |
$17,195 |
$19,452 |
9/24 |
$17,472 |
$19,632 |
10/24 |
$16,433 |
$18,564 |
11/24 |
$16,344 |
$18,459 |
12/24 |
$15,865 |
$18,039 |
1/25 |
$16,456 |
$18,987 |
2/25 |
$16,932 |
$19,355 |
3/25 |
$17,152 |
$19,277 |
4/25 |
$18,033 |
$20,160 |
5/25 |
$18,741 |
$21,083 |
6/25 |
$19,274 |
$21,547 |
7/25 |
$18,857 |
$21,245 |
8/25 |
$19,645 |
$22,150 |
9/25 |
$19,808 |
$22,574 |
10/25 |
$19,738 |
$22,840 |
11/25 |
$20,028 |
$22,982 |
12/25 |
$20,386 |
$23,671 |
1/26 |
$21,165 |
$24,906 | |
|
| Average Annual Return [Table Text Block] |
Average Annual Total Returns (%)
Table Summary
Fund |
1 Year |
5 Years |
10 Years |
Class A |
28.67% |
7.60% |
8.37% |
Class A with 5.25% Maximum Sales Charge |
21.89% |
6.44% |
7.78% |
MSCI EAFE Index (net of foreign withholding taxes) |
31.18% |
10.27% |
9.55% | Performance does not reflect the deduction of taxes that a shareholder would pay on Fund distributions or redemption of Fund shares. Performance assumes that all dividends and distributions, if any, were reinvested. For more recent performance information, visit www.eatonvance.com/performance.php. THE FUND'S PAST PERFORMANCE IS NO GUARANTEE OF FUTURE RESULTS. |
|
| No Deduction of Taxes [Text Block] |
Performance does not reflect the deduction of taxes that a shareholder would pay on Fund distributions or redemption of Fund shares.
|
|
| Updated Performance Information Location [Text Block] |
For more recent performance information, visit www.eatonvance.com/performance.php.
|
|
| AssetsNet |
$ 197,195,228
|
|
| Holdings Count | Holding |
967
|
|
| Advisory Fees Paid, Amount |
$ 852,824
|
|
| InvestmentCompanyPortfolioTurnover |
25.00%
|
|
| Additional Fund Statistics [Text Block] |
Table Summary
Total Net Assets |
$197,195,228 |
# of Portfolio Holdings |
967 |
Portfolio Turnover Rate |
25% |
Total Advisory Fees Paid |
$852,824 | |
|
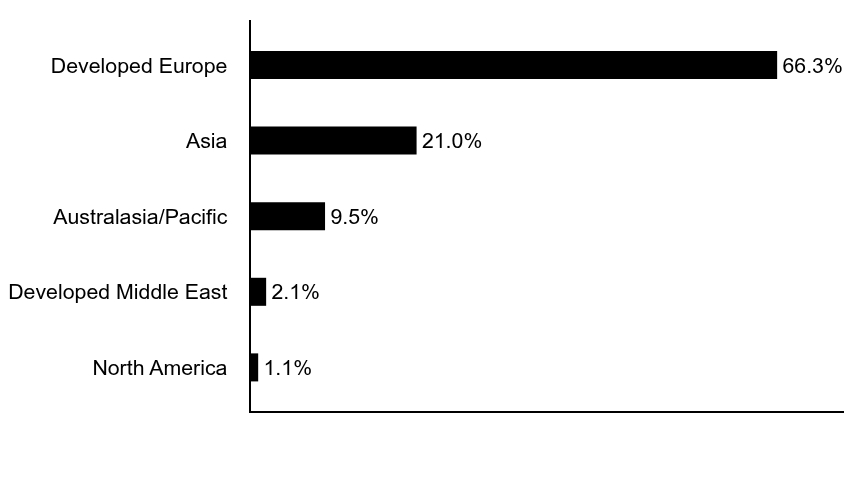
| Holdings [Text Block] |
Geographic Allocation (% of total investments)
Table Summary
Value |
Value |
North America |
1.1% |
Developed Middle East |
2.1% |
Australasia/Pacific |
9.5% |
Asia |
21.0% |
Developed Europe |
66.3% | |
|
| Largest Holdings [Text Block] |
Top Ten Holdings (% of total investments)Footnote Referencea
Table Summary
Nestle SA |
1.2% |
Cie Financiere Richemont SA, Class A |
0.9% |
Deutsche Telekom AG |
0.9% |
Engie SA |
0.9% |
Shell PLC |
0.8% |
TotalEnergies SE |
0.8% |
Sanofi SA |
0.8% |
Air Liquide SA |
0.8% |
ASML Holding NV |
0.7% |
SAP SE |
0.7% |
Total |
8.5% |
| Footnote |
Description |
Footnotea |
Excluding cash equivalents | |
|
| Material Fund Change [Text Block] |
|
|
| Updated Prospectus Phone Number |
1-800-260-0761
|
|
| C000086649 |
|
|
| Shareholder Report [Line Items] |
|
|
| Fund Name |
Parametric International Equity Fund
|
|
| Class Name |
Class I
|
|
| Trading Symbol |
EIISX
|
|
| Annual or Semi-Annual Statement [Text Block] |
This annual shareholder report contains important information about the Parametric International Equity Fund for the period of February 1, 2025 to January 31, 2026.
|
|
| Additional Information [Text Block] |
You can find additional information about the Fund at www.eatonvance.com/parametric-fund-documents.php. You can also request this information by contacting us at 1-800-260-0761.
|
|
| Additional Information Phone Number |
1-800-260-0761
|
|
| Additional Information Website |
<span style="box-sizing: border-box; color: rgb(0, 0, 0); display: inline; flex-wrap: nowrap; font-size: 10.6667px; font-weight: 400; grid-area: auto; line-height: 16px; margin: 0px; overflow: visible; text-align: left; text-align-last: auto; white-space-collapse: preserve-breaks;">www.eatonvance.com/parametric-fund-documents.php</span>
|
|
| Expenses [Text Block] |
What were the Fund costs for the last year?(based on a hypothetical $10,000 investment)
Table Summary
Class Name |
Costs of a $10,000 investment |
Costs paid as a percentage of a $10,000 investment |
Class I |
$60 |
0.52% | |
|
| Expenses Paid, Amount |
$ 60
|
|
| Expense Ratio, Percent |
0.52%
|
|
| Factors Affecting Performance [Text Block] |
How did the Fund perform last year and what affected its performance?Key contributors to (↑) and detractors from (↓) performance, relative to the MSCI EAFE Index (the Index): ↓ Sector allocation and an underweight to Netherlands hurt returns, partly due to an underweight to information technology, which surged over the period ↓ Stock selections in Japan also detracted from returns, partly due to excluding high beta stocks within the information technology sector that outperformed ↓ Security selection in Germany further weighed on performance partly due to the exclusion of high beta materials stocks that experienced gains ↑ Sector allocations in Israel contributed to Index-relative performance, partly due to an underweight to information technology which declined ↑ An overweight exposure to Belgium and active security selection within the materials sector helped performance. Strong returns from financials, health care and consumer staples also boosted results ↑ An underweight exposure to France helped returns as headline performance trailed amid weakening demand for the country’s consumer discretionary goods |
|
| Performance Past Does Not Indicate Future [Text] |
THE FUND'S PAST PERFORMANCE IS NO GUARANTEE OF FUTURE RESULTS.
|
|
| Line Graph [Table Text Block] |
Comparison of the change in value of a $1,000,000 investment for the period indicated.
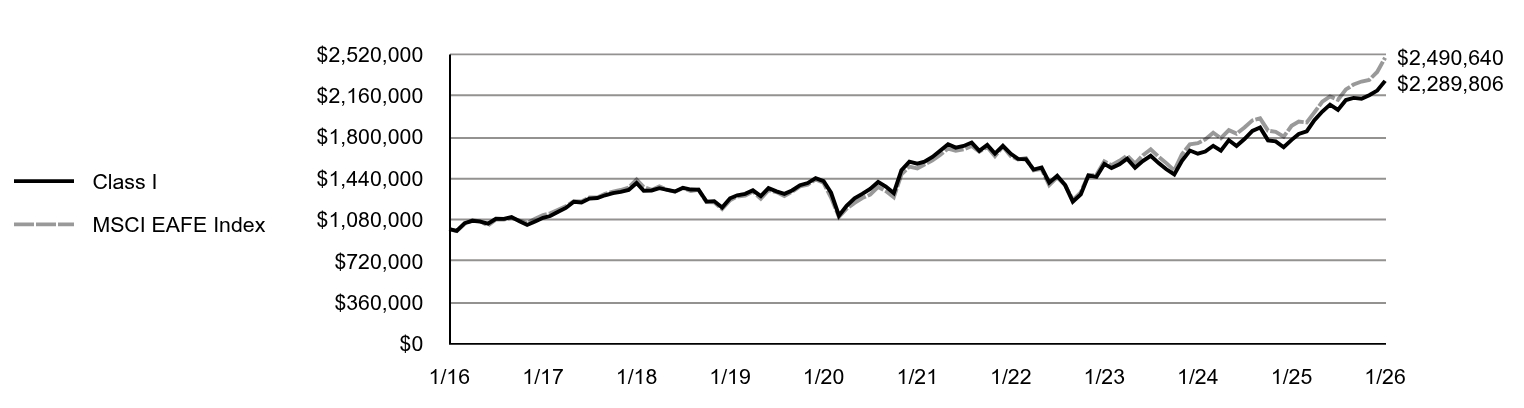
Table Summary
|
Class I |
MSCI EAFE Index |
1/16 |
$1,000,000 |
$1,000,000 |
2/16 |
$984,215 |
$981,679 |
3/16 |
$1,051,068 |
$1,045,555 |
4/16 |
$1,071,495 |
$1,075,825 |
5/16 |
$1,064,995 |
$1,066,052 |
6/16 |
$1,046,934 |
$1,030,267 |
7/16 |
$1,088,774 |
$1,082,482 |
8/16 |
$1,087,844 |
$1,083,250 |
9/16 |
$1,104,580 |
$1,096,557 |
10/16 |
$1,068,319 |
$1,074,127 |
11/16 |
$1,035,776 |
$1,052,735 |
12/16 |
$1,065,619 |
$1,088,733 |
1/17 |
$1,097,767 |
$1,120,314 |
2/17 |
$1,112,896 |
$1,136,334 |
3/17 |
$1,150,717 |
$1,167,616 |
4/17 |
$1,183,811 |
$1,197,326 |
5/17 |
$1,237,706 |
$1,241,272 |
6/17 |
$1,231,088 |
$1,239,077 |
7/17 |
$1,265,127 |
$1,274,819 |
8/17 |
$1,269,855 |
$1,274,339 |
9/17 |
$1,293,493 |
$1,306,045 |
10/17 |
$1,312,404 |
$1,325,877 |
11/17 |
$1,323,750 |
$1,339,784 |
12/17 |
$1,339,554 |
$1,361,289 |
1/18 |
$1,400,796 |
$1,429,571 |
2/18 |
$1,332,749 |
$1,365,046 |
3/18 |
$1,335,666 |
$1,340,443 |
4/18 |
$1,355,108 |
$1,371,049 |
5/18 |
$1,340,526 |
$1,340,230 |
6/18 |
$1,326,917 |
$1,323,856 |
7/18 |
$1,358,996 |
$1,356,444 |
8/18 |
$1,343,404 |
$1,330,247 |
9/18 |
$1,342,418 |
$1,341,792 |
10/18 |
$1,238,852 |
$1,234,996 |
11/18 |
$1,242,797 |
$1,233,440 |
12/18 |
$1,187,883 |
$1,173,564 |
1/19 |
$1,267,276 |
$1,250,691 |
2/19 |
$1,293,405 |
$1,282,573 |
3/19 |
$1,306,470 |
$1,290,660 |
4/19 |
$1,336,619 |
$1,326,948 |
5/19 |
$1,286,370 |
$1,263,220 |
6/19 |
$1,355,714 |
$1,338,161 |
7/19 |
$1,327,574 |
$1,321,170 |
8/19 |
$1,306,462 |
$1,286,944 |
9/19 |
$1,335,674 |
$1,323,823 |
10/19 |
$1,381,002 |
$1,371,387 |
11/19 |
$1,400,141 |
$1,386,847 |
12/19 |
$1,442,419 |
$1,431,919 |
1/20 |
$1,416,643 |
$1,402,009 |
2/20 |
$1,317,664 |
$1,275,271 |
3/20 |
$1,115,581 |
$1,105,062 |
4/20 |
$1,202,188 |
$1,176,452 |
5/20 |
$1,267,143 |
$1,227,681 |
6/20 |
$1,306,322 |
$1,269,483 |
7/20 |
$1,349,626 |
$1,299,073 |
8/20 |
$1,409,123 |
$1,365,860 |
9/20 |
$1,369,895 |
$1,330,370 |
10/20 |
$1,313,117 |
$1,277,250 |
11/20 |
$1,512,355 |
$1,475,241 |
12/20 |
$1,585,745 |
$1,543,833 |
1/21 |
$1,568,987 |
$1,527,386 |
2/21 |
$1,585,745 |
$1,561,644 |
3/21 |
$1,627,641 |
$1,597,551 |
4/21 |
$1,681,058 |
$1,645,620 |
5/21 |
$1,737,616 |
$1,699,286 |
6/21 |
$1,708,290 |
$1,680,162 |
7/21 |
$1,722,953 |
$1,692,813 |
8/21 |
$1,752,280 |
$1,722,673 |
9/21 |
$1,680,010 |
$1,672,679 |
10/21 |
$1,731,332 |
$1,713,820 |
11/21 |
$1,656,968 |
$1,634,052 |
12/21 |
$1,723,642 |
$1,717,722 |
1/22 |
$1,654,433 |
$1,634,715 |
2/22 |
$1,610,490 |
$1,605,810 |
3/22 |
$1,607,194 |
$1,616,132 |
4/22 |
$1,517,113 |
$1,511,577 |
5/22 |
$1,535,788 |
$1,522,909 |
6/22 |
$1,403,961 |
$1,381,602 |
7/22 |
$1,463,283 |
$1,450,447 |
8/22 |
$1,381,990 |
$1,381,558 |
9/22 |
$1,238,078 |
$1,252,318 |
10/22 |
$1,301,795 |
$1,319,661 |
11/22 |
$1,466,579 |
$1,468,302 |
12/22 |
$1,453,268 |
$1,469,481 |
1/23 |
$1,566,822 |
$1,588,476 |
2/23 |
$1,530,118 |
$1,555,330 |
3/23 |
$1,563,381 |
$1,593,877 |
4/23 |
$1,612,703 |
$1,638,877 |
5/23 |
$1,533,559 |
$1,569,523 |
6/23 |
$1,590,910 |
$1,640,951 |
7/23 |
$1,636,790 |
$1,694,046 |
8/23 |
$1,573,704 |
$1,629,143 |
9/23 |
$1,519,795 |
$1,573,496 |
10/23 |
$1,475,061 |
$1,509,703 |
11/23 |
$1,593,204 |
$1,649,831 |
12/23 |
$1,682,949 |
$1,737,485 |
1/24 |
$1,655,690 |
$1,747,484 |
2/24 |
$1,674,653 |
$1,779,470 |
3/24 |
$1,724,430 |
$1,837,996 |
4/24 |
$1,681,764 |
$1,790,928 |
5/24 |
$1,773,022 |
$1,860,299 |
6/24 |
$1,723,245 |
$1,830,267 |
7/24 |
$1,783,689 |
$1,883,960 |
8/24 |
$1,853,614 |
$1,945,220 |
9/24 |
$1,883,243 |
$1,963,183 |
10/24 |
$1,771,837 |
$1,856,423 |
11/24 |
$1,762,356 |
$1,845,890 |
12/24 |
$1,712,224 |
$1,803,911 |
1/25 |
$1,775,824 |
$1,898,710 |
2/25 |
$1,826,954 |
$1,935,532 |
3/25 |
$1,850,648 |
$1,927,724 |
4/25 |
$1,946,673 |
$2,016,024 |
5/25 |
$2,022,744 |
$2,108,262 |
6/25 |
$2,082,603 |
$2,154,715 |
7/25 |
$2,036,462 |
$2,124,470 |
8/25 |
$2,122,509 |
$2,215,041 |
9/25 |
$2,141,215 |
$2,257,434 |
10/25 |
$2,133,733 |
$2,283,989 |
11/25 |
$2,164,909 |
$2,298,171 |
12/25 |
$2,204,789 |
$2,367,114 |
1/26 |
$2,289,806 |
$2,490,640 | |
|
| Average Annual Return [Table Text Block] |
Average Annual Total Returns (%)
Table Summary
Fund |
1 Year |
5 Years |
10 Years |
Class I |
28.94% |
7.85% |
8.63% |
MSCI EAFE Index (net of foreign withholding taxes) |
31.18% |
10.27% |
9.55% | Performance does not reflect the deduction of taxes that a shareholder would pay on Fund distributions or redemption of Fund shares. Performance assumes that all dividends and distributions, if any, were reinvested. For more recent performance information, visit www.eatonvance.com/performance.php. THE FUND'S PAST PERFORMANCE IS NO GUARANTEE OF FUTURE RESULTS. |
|
| No Deduction of Taxes [Text Block] |
Performance does not reflect the deduction of taxes that a shareholder would pay on Fund distributions or redemption of Fund shares.
|
|
| Updated Performance Information Location [Text Block] |
For more recent performance information, visit www.eatonvance.com/performance.php.
|
|
| AssetsNet |
$ 197,195,228
|
|
| Holdings Count | Holding |
967
|
|
| Advisory Fees Paid, Amount |
$ 852,824
|
|
| InvestmentCompanyPortfolioTurnover |
25.00%
|
|
| Additional Fund Statistics [Text Block] |
Table Summary
Total Net Assets |
$197,195,228 |
# of Portfolio Holdings |
967 |
Portfolio Turnover Rate |
25% |
Total Advisory Fees Paid |
$852,824 | |
|
| Holdings [Text Block] |
Geographic Allocation (% of total investments)
Table Summary
Value |
Value |
North America |
1.1% |
Developed Middle East |
2.1% |
Australasia/Pacific |
9.5% |
Asia |
21.0% |
Developed Europe |
66.3% | |
|
| Largest Holdings [Text Block] |
Top Ten Holdings (% of total investments)Footnote Referencea
Table Summary
Nestle SA |
1.2% |
Cie Financiere Richemont SA, Class A |
0.9% |
Deutsche Telekom AG |
0.9% |
Engie SA |
0.9% |
Shell PLC |
0.8% |
TotalEnergies SE |
0.8% |
Sanofi SA |
0.8% |
Air Liquide SA |
0.8% |
ASML Holding NV |
0.7% |
SAP SE |
0.7% |
Total |
8.5% |
| Footnote |
Description |
Footnotea |
Excluding cash equivalents | |
|
| Material Fund Change [Text Block] |
|
|
| Updated Prospectus Phone Number |
1-800-260-0761
|
|
| C000161753 |
|
|
| Shareholder Report [Line Items] |
|
|
| Fund Name |
Parametric International Equity Fund
|
|
| Class Name |
Class R
|
|
| Trading Symbol |
ERISX
|
|
| Annual or Semi-Annual Statement [Text Block] |
This annual shareholder report contains important information about the Parametric International Equity Fund for the period of February 1, 2025 to January 31, 2026.
|
|
| Additional Information [Text Block] |
You can find additional information about the Fund at www.eatonvance.com/parametric-fund-documents.php. You can also request this information by contacting us at 1-800-260-0761.
|
|
| Additional Information Phone Number |
1-800-260-0761
|
|
| Additional Information Website |
<span style="box-sizing: border-box; color: rgb(0, 0, 0); display: inline; flex-wrap: nowrap; font-size: 10.6667px; font-weight: 400; grid-area: auto; line-height: 16px; margin: 0px; overflow: visible; text-align: left; text-align-last: auto; white-space-collapse: preserve-breaks;">www.eatonvance.com/parametric-fund-documents.php</span>
|
|
| Expenses [Text Block] |
What were the Fund costs for the last year?(based on a hypothetical $10,000 investment)
Table Summary
Class Name |
Costs of a $10,000 investment |
Costs paid as a percentage of a $10,000 investment |
Class R |
$116 |
1.02% | |
|
| Expenses Paid, Amount |
$ 116
|
|
| Expense Ratio, Percent |
1.02%
|
|
| Factors Affecting Performance [Text Block] |
How did the Fund perform last year and what affected its performance?Key contributors to (↑) and detractors from (↓) performance, relative to the MSCI EAFE Index (the Index): ↓ Sector allocation and an underweight to Netherlands hurt returns, partly due to an underweight to information technology, which surged over the period ↓ Stock selections in Japan also detracted from returns, partly due to excluding high beta stocks within the information technology sector that outperformed ↓ Security selection in Germany further weighed on performance partly due to the exclusion of high beta materials stocks that experienced gains ↑ Sector allocations in Israel contributed to Index-relative performance, partly due to an underweight to information technology which declined ↑ An overweight exposure to Belgium and active security selection within the materials sector helped performance. Strong returns from financials, health care and consumer staples also boosted results ↑ An underweight exposure to France helped returns as headline performance trailed amid weakening demand for the country’s consumer discretionary goods |
|
| Performance Past Does Not Indicate Future [Text] |
THE FUND'S PAST PERFORMANCE IS NO GUARANTEE OF FUTURE RESULTS.
|
|
| Line Graph [Table Text Block] |
Comparison of the change in value of a $10,000 investment for the period indicated.
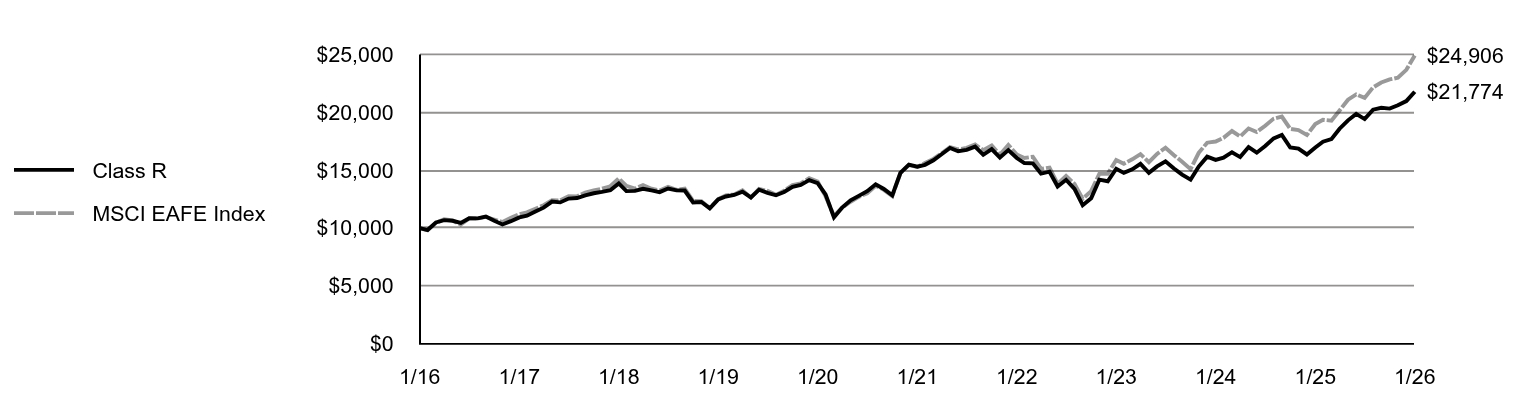
Table Summary
|
Class R |
MSCI EAFE Index |
1/16 |
$10,000 |
$10,000 |
2/16 |
$9,832 |
$9,817 |
3/16 |
$10,493 |
$10,456 |
4/16 |
$10,689 |
$10,758 |
5/16 |
$10,633 |
$10,661 |
6/16 |
$10,443 |
$10,303 |
7/16 |
$10,853 |
$10,825 |
8/16 |
$10,835 |
$10,833 |
9/16 |
$11,002 |
$10,966 |
10/16 |
$10,639 |
$10,741 |
11/16 |
$10,312 |
$10,527 |
12/16 |
$10,600 |
$10,887 |
1/17 |
$10,923 |
$11,203 |
2/17 |
$11,074 |
$11,363 |
3/17 |
$11,434 |
$11,676 |
4/17 |
$11,766 |
$11,973 |
5/17 |
$12,287 |
$12,413 |
6/17 |
$12,220 |
$12,391 |
7/17 |
$12,552 |
$12,748 |
8/17 |
$12,599 |
$12,743 |
9/17 |
$12,827 |
$13,060 |
10/17 |
$13,007 |
$13,259 |
11/17 |
$13,120 |
$13,398 |
12/17 |
$13,269 |
$13,613 |
1/18 |
$13,860 |
$14,296 |
2/18 |
$13,191 |
$13,650 |
3/18 |
$13,211 |
$13,404 |
4/18 |
$13,395 |
$13,710 |
5/18 |
$13,249 |
$13,402 |
6/18 |
$13,104 |
$13,239 |
7/18 |
$13,414 |
$13,564 |
8/18 |
$13,262 |
$13,302 |
9/18 |
$13,243 |
$13,418 |
10/18 |
$12,219 |
$12,350 |
11/18 |
$12,249 |
$12,334 |
12/18 |
$11,710 |
$11,736 |
1/19 |
$12,480 |
$12,507 |
2/19 |
$12,729 |
$12,826 |
3/19 |
$12,859 |
$12,907 |
4/19 |
$13,149 |
$13,269 |
5/19 |
$12,649 |
$12,632 |
6/19 |
$13,319 |
$13,382 |
7/19 |
$13,049 |
$13,212 |
8/19 |
$12,835 |
$12,869 |
9/19 |
$13,115 |
$13,238 |
10/19 |
$13,556 |
$13,714 |
11/19 |
$13,736 |
$13,868 |
12/19 |
$14,139 |
$14,319 |
1/20 |
$13,884 |
$14,020 |
2/20 |
$12,913 |
$12,753 |
3/20 |
$10,921 |
$11,051 |
4/20 |
$11,769 |
$11,765 |
5/20 |
$12,392 |
$12,277 |
6/20 |
$12,780 |
$12,695 |
7/20 |
$13,189 |
$12,991 |
8/20 |
$13,779 |
$13,659 |
9/20 |
$13,380 |
$13,304 |
10/20 |
$12,827 |
$12,773 |
11/20 |
$14,771 |
$14,752 |
12/20 |
$15,476 |
$15,438 |
1/21 |
$15,300 |
$15,274 |
2/21 |
$15,465 |
$15,616 |
3/21 |
$15,858 |
$15,976 |
4/21 |
$16,376 |
$16,456 |
5/21 |
$16,914 |
$16,993 |
6/21 |
$16,634 |
$16,802 |
7/21 |
$16,758 |
$16,928 |
8/21 |
$17,038 |
$17,227 |
9/21 |
$16,334 |
$16,727 |
10/21 |
$16,820 |
$17,138 |
11/21 |
$16,096 |
$16,341 |
12/21 |
$16,735 |
$17,177 |
1/22 |
$16,053 |
$16,347 |
2/22 |
$15,620 |
$16,058 |
3/22 |
$15,588 |
$16,161 |
4/22 |
$14,700 |
$15,116 |
5/22 |
$14,874 |
$15,229 |
6/22 |
$13,596 |
$13,816 |
7/22 |
$14,170 |
$14,504 |
8/22 |
$13,380 |
$13,816 |
9/22 |
$11,972 |
$12,523 |
10/22 |
$12,579 |
$13,197 |
11/22 |
$14,181 |
$14,683 |
12/22 |
$14,047 |
$14,695 |
1/23 |
$15,126 |
$15,885 |
2/23 |
$14,767 |
$15,553 |
3/23 |
$15,081 |
$15,939 |
4/23 |
$15,543 |
$16,389 |
5/23 |
$14,778 |
$15,695 |
6/23 |
$15,329 |
$16,410 |
7/23 |
$15,768 |
$16,940 |
8/23 |
$15,149 |
$16,291 |
9/23 |
$14,620 |
$15,735 |
10/23 |
$14,182 |
$15,097 |
11/23 |
$15,318 |
$16,498 |
12/23 |
$16,169 |
$17,375 |
1/24 |
$15,892 |
$17,475 |
2/24 |
$16,077 |
$17,795 |
3/24 |
$16,549 |
$18,380 |
4/24 |
$16,134 |
$17,909 |
5/24 |
$16,999 |
$18,603 |
6/24 |
$16,515 |
$18,303 |
7/24 |
$17,091 |
$18,840 |
8/24 |
$17,748 |
$19,452 |
9/24 |
$18,036 |
$19,632 |
10/24 |
$16,964 |
$18,564 |
11/24 |
$16,861 |
$18,459 |
12/24 |
$16,362 |
$18,039 |
1/25 |
$16,965 |
$18,987 |
2/25 |
$17,460 |
$19,355 |
3/25 |
$17,677 |
$19,277 |
4/25 |
$18,582 |
$20,160 |
5/25 |
$19,306 |
$21,083 |
6/25 |
$19,861 |
$21,547 |
7/25 |
$19,414 |
$21,245 |
8/25 |
$20,223 |
$22,150 |
9/25 |
$20,392 |
$22,574 |
10/25 |
$20,319 |
$22,840 |
11/25 |
$20,609 |
$22,982 |
12/25 |
$20,968 |
$23,671 |
1/26 |
$21,774 |
$24,906 | |
|
| Average Annual Return [Table Text Block] |
Average Annual Total Returns (%)
Table Summary
Fund |
1 Year |
5 Years |
10 Years |
Class R |
28.35% |
7.31% |
8.09% |
MSCI EAFE Index (net of foreign withholding taxes) |
31.18% |
10.27% |
9.55% | Performance does not reflect the deduction of taxes that a shareholder would pay on Fund distributions or redemption of Fund shares. Performance assumes that all dividends and distributions, if any, were reinvested. For more recent performance information, visit www.eatonvance.com/performance.php. THE FUND'S PAST PERFORMANCE IS NO GUARANTEE OF FUTURE RESULTS. |
|
| No Deduction of Taxes [Text Block] |
Performance does not reflect the deduction of taxes that a shareholder would pay on Fund distributions or redemption of Fund shares.
|
|
| Updated Performance Information Location [Text Block] |
For more recent performance information, visit www.eatonvance.com/performance.php.
|
|
| AssetsNet |
$ 197,195,228
|
|
| Holdings Count | Holding |
967
|
|
| Advisory Fees Paid, Amount |
$ 852,824
|
|
| InvestmentCompanyPortfolioTurnover |
25.00%
|
|
| Additional Fund Statistics [Text Block] |
Table Summary
Total Net Assets |
$197,195,228 |
# of Portfolio Holdings |
967 |
Portfolio Turnover Rate |
25% |
Total Advisory Fees Paid |
$852,824 | |
|
| Holdings [Text Block] |
Geographic Allocation (% of total investments)
Table Summary
Value |
Value |
North America |
1.1% |
Developed Middle East |
2.1% |
Australasia/Pacific |
9.5% |
Asia |
21.0% |
Developed Europe |
66.3% | |
|
| Largest Holdings [Text Block] |
Top Ten Holdings (% of total investments)Footnote Referencea
Table Summary
Nestle SA |
1.2% |
Cie Financiere Richemont SA, Class A |
0.9% |
Deutsche Telekom AG |
0.9% |
Engie SA |
0.9% |
Shell PLC |
0.8% |
TotalEnergies SE |
0.8% |
Sanofi SA |
0.8% |
Air Liquide SA |
0.8% |
ASML Holding NV |
0.7% |
SAP SE |
0.7% |
Total |
8.5% |
| Footnote |
Description |
Footnotea |
Excluding cash equivalents | |
|
| Material Fund Change [Text Block] |
|
|
| Updated Prospectus Phone Number |
1-800-260-0761
|
|
| C000161754 |
|
|
| Shareholder Report [Line Items] |
|
|
| Fund Name |
Parametric International Equity Fund
|
|
| Class Name |
Class R6
|
|
| Trading Symbol |
ESISX
|
|
| Annual or Semi-Annual Statement [Text Block] |
This annual shareholder report contains important information about the Parametric International Equity Fund for the period of February 1, 2025 to January 31, 2026.
|
|
| Additional Information [Text Block] |
You can find additional information about the Fund at www.eatonvance.com/parametric-fund-documents.php. You can also request this information by contacting us at 1-800-260-0761.
|
|
| Additional Information Phone Number |
1-800-260-0761
|
|
| Additional Information Website |
<span style="box-sizing: border-box; color: rgb(0, 0, 0); display: inline; flex-wrap: nowrap; font-size: 10.6667px; font-weight: 400; grid-area: auto; line-height: 16px; margin: 0px; overflow: visible; text-align: left; text-align-last: auto; white-space-collapse: preserve-breaks;">www.eatonvance.com/parametric-fund-documents.php</span>
|
|
| Expenses [Text Block] |
What were the Fund costs for the last year?(based on a hypothetical $10,000 investment)
Table Summary
Class Name |
Costs of a $10,000 investment |
Costs paid as a percentage of a $10,000 investment |
Class R6 |
$56 |
0.49% | |
|
| Expenses Paid, Amount |
$ 56
|
|
| Expense Ratio, Percent |
0.49%
|
|
| Factors Affecting Performance [Text Block] |
How did the Fund perform last year and what affected its performance?Key contributors to (↑) and detractors from (↓) performance, relative to the MSCI EAFE Index (the Index): ↓ Sector allocation and an underweight to Netherlands hurt returns, partly due to an underweight to information technology, which surged over the period ↓ Stock selections in Japan also detracted from returns, partly due to excluding high beta stocks within the information technology sector that outperformed ↓ Security selection in Germany further weighed on performance partly due to the exclusion of high beta materials stocks that experienced gains ↑ Sector allocations in Israel contributed to Index-relative performance, partly due to an underweight to information technology which declined ↑ An overweight exposure to Belgium and active security selection within the materials sector helped performance. Strong returns from financials, health care and consumer staples also boosted results ↑ An underweight exposure to France helped returns as headline performance trailed amid weakening demand for the country’s consumer discretionary goods |
|
| Performance Past Does Not Indicate Future [Text] |
THE FUND'S PAST PERFORMANCE IS NO GUARANTEE OF FUTURE RESULTS.
|
|
| Line Graph [Table Text Block] |
Comparison of the change in value of a $5,000,000 investment for the period indicated.
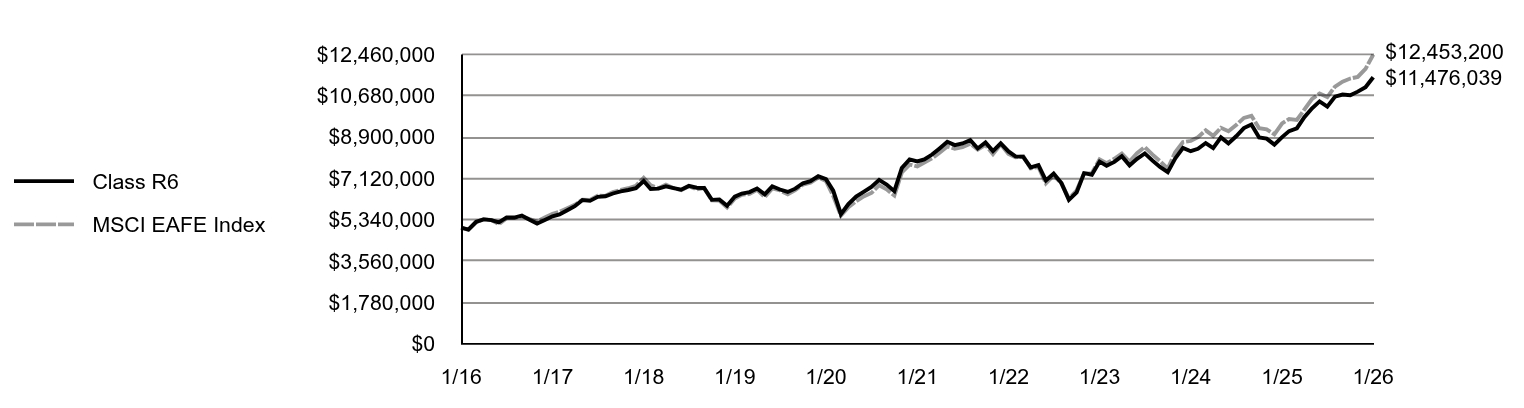
Table Summary
|
Class R6 |
MSCI EAFE Index |
1/16 |
$5,000,000 |
$5,000,000 |
2/16 |
$4,921,077 |
$4,908,397 |
3/16 |
$5,255,339 |
$5,227,773 |
4/16 |
$5,357,474 |
$5,379,123 |
5/16 |
$5,329,619 |
$5,330,258 |
6/16 |
$5,234,337 |
$5,151,334 |
7/16 |
$5,443,525 |
$5,412,408 |
8/16 |
$5,438,876 |
$5,416,250 |
9/16 |
$5,522,551 |
$5,482,786 |
10/16 |
$5,341,255 |
$5,370,636 |
11/16 |
$5,178,554 |
$5,263,674 |
12/16 |
$5,328,884 |
$5,443,663 |
1/17 |
$5,489,649 |
$5,601,571 |
2/17 |
$5,570,032 |
$5,681,670 |
3/17 |
$5,754,438 |
$5,838,079 |
4/17 |
$5,924,660 |
$5,986,628 |
5/17 |
$6,189,449 |
$6,206,362 |
6/17 |
$6,156,351 |
$6,195,385 |
7/17 |
$6,331,301 |
$6,374,096 |
8/17 |
$6,354,943 |
$6,371,694 |
9/17 |
$6,473,152 |
$6,530,225 |
10/17 |
$6,567,720 |
$6,629,385 |
11/17 |
$6,624,460 |
$6,698,922 |
12/17 |
$6,702,270 |
$6,806,447 |
1/18 |
$7,008,687 |
$7,147,855 |
2/18 |
$6,668,224 |
$6,825,230 |
3/18 |
$6,682,815 |
$6,702,214 |
4/18 |
$6,780,090 |
$6,855,243 |
5/18 |
$6,707,134 |
$6,701,152 |
6/18 |
$6,639,041 |
$6,619,282 |
7/18 |
$6,799,545 |
$6,782,218 |
8/18 |
$6,722,214 |
$6,651,236 |
9/18 |
$6,712,343 |
$6,708,961 |
10/18 |
$6,199,046 |
$6,174,981 |
11/18 |
$6,218,788 |
$6,167,200 |
12/18 |
$5,946,396 |
$5,867,820 |
1/19 |
$6,338,798 |
$6,253,454 |
2/19 |
$6,469,598 |
$6,412,863 |
3/19 |
$6,534,999 |
$6,453,301 |
4/19 |
$6,690,953 |
$6,634,738 |
5/19 |
$6,439,414 |
$6,316,098 |
6/19 |
$6,781,508 |
$6,690,803 |
7/19 |
$6,645,676 |
$6,605,851 |
8/19 |
$6,540,202 |
$6,434,721 |
9/19 |
$6,681,394 |
$6,619,114 |
10/19 |
$6,913,351 |
$6,856,933 |
11/19 |
$7,004,118 |
$6,934,233 |
12/19 |
$7,218,679 |
$7,159,593 |
1/20 |
$7,089,589 |
$7,010,045 |
2/20 |
$6,593,886 |
$6,376,353 |
3/20 |
$5,581,825 |
$5,525,312 |
4/20 |
$6,015,565 |
$5,882,262 |
5/20 |
$6,340,871 |
$6,138,404 |
6/20 |
$6,542,250 |
$6,347,414 |
7/20 |
$6,753,957 |
$6,495,365 |
8/20 |
$7,057,091 |
$6,829,298 |
9/20 |
$6,855,460 |
$6,651,850 |
10/20 |
$6,576,278 |
$6,386,249 |
11/20 |
$7,574,094 |
$7,376,203 |
12/20 |
$7,940,663 |
$7,719,167 |
1/21 |
$7,851,442 |
$7,636,928 |
2/21 |
$7,940,663 |
$7,808,219 |
3/21 |
$8,150,595 |
$7,987,755 |
4/21 |
$8,413,009 |
$8,228,102 |
5/21 |
$8,696,417 |
$8,496,429 |
6/21 |
$8,554,713 |
$8,400,811 |
7/21 |
$8,628,189 |
$8,464,065 |
8/21 |
$8,769,893 |
$8,613,365 |
9/21 |
$8,413,009 |
$8,363,397 |
10/21 |
$8,670,176 |
$8,569,098 |
11/21 |
$8,297,547 |
$8,170,260 |
12/21 |
$8,631,085 |
$8,588,609 |
1/22 |
$8,284,079 |
$8,173,573 |
2/22 |
$8,069,265 |
$8,029,052 |
3/22 |
$8,052,741 |
$8,080,659 |
4/22 |
$7,595,575 |
$7,557,883 |
5/22 |
$7,694,719 |
$7,614,543 |
6/22 |
$7,033,756 |
$6,908,008 |
7/22 |
$7,331,189 |
$7,252,233 |
8/22 |
$6,923,595 |
$6,907,791 |
9/22 |
$6,202,043 |
$6,261,588 |
10/22 |
$6,521,509 |
$6,598,303 |
11/22 |
$7,347,713 |
$7,341,508 |
12/22 |
$7,281,426 |
$7,347,407 |
1/23 |
$7,845,521 |
$7,942,379 |
2/23 |
$7,667,083 |
$7,776,649 |
3/23 |
$7,834,009 |
$7,969,386 |
4/23 |
$8,075,764 |
$8,194,384 |
5/23 |
$7,684,351 |
$7,847,614 |
6/23 |
$7,966,399 |
$8,204,755 |
7/23 |
$8,196,641 |
$8,470,232 |
8/23 |
$7,885,814 |
$8,145,717 |
9/23 |
$7,615,278 |
$7,867,479 |
10/23 |
$7,390,792 |
$7,548,517 |
11/23 |
$7,983,667 |
$8,249,154 |
12/23 |
$8,435,796 |
$8,687,423 |
1/24 |
$8,292,917 |
$8,737,418 |
2/24 |
$8,394,123 |
$8,897,352 |
3/24 |
$8,644,160 |
$9,189,982 |
4/24 |
$8,429,842 |
$8,954,638 |
5/24 |
$8,888,245 |
$9,301,496 |
6/24 |
$8,632,254 |
$9,151,334 |
7/24 |
$8,935,871 |
$9,419,802 |
8/24 |
$9,287,114 |
$9,726,098 |
9/24 |
$9,441,900 |
$9,815,913 |
10/24 |
$8,882,291 |
$9,282,114 |
11/24 |
$8,834,665 |
$9,229,452 |
12/24 |
$8,579,679 |
$9,019,557 |
1/25 |
$8,899,536 |
$9,493,550 |
2/25 |
$9,156,675 |
$9,677,661 |
3/25 |
$9,275,837 |
$9,638,618 |
4/25 |
$9,758,758 |
$10,080,118 |
5/25 |
$10,141,331 |
$10,541,312 |
6/25 |
$10,436,101 |
$10,773,577 |
7/25 |
$10,210,320 |
$10,622,349 |
8/25 |
$10,643,067 |
$11,075,205 |
9/25 |
$10,730,871 |
$11,287,168 |
10/25 |
$10,699,512 |
$11,419,947 |
11/25 |
$10,856,305 |
$11,490,854 |
12/25 |
$11,048,095 |
$11,835,570 |
1/26 |
$11,476,039 |
$12,453,200 | |
|
| Average Annual Return [Table Text Block] |
Average Annual Total Returns (%)
Table Summary
Fund |
1 Year |
5 Years |
10 Years |
Class R6 |
28.95% |
7.88% |
8.66% |
MSCI EAFE Index (net of foreign withholding taxes) |
31.18% |
10.27% |
9.55% | Performance does not reflect the deduction of taxes that a shareholder would pay on Fund distributions or redemption of Fund shares. Performance assumes that all dividends and distributions, if any, were reinvested. For more recent performance information, visit www.eatonvance.com/performance.php. THE FUND'S PAST PERFORMANCE IS NO GUARANTEE OF FUTURE RESULTS. |
|
| No Deduction of Taxes [Text Block] |
Performance does not reflect the deduction of taxes that a shareholder would pay on Fund distributions or redemption of Fund shares.
|
|
| Updated Performance Information Location [Text Block] |
For more recent performance information, visit www.eatonvance.com/performance.php.
|
|
| AssetsNet |
$ 197,195,228
|
|
| Holdings Count | Holding |
967
|
|
| Advisory Fees Paid, Amount |
$ 852,824
|
|
| InvestmentCompanyPortfolioTurnover |
25.00%
|
|
| Additional Fund Statistics [Text Block] |
Table Summary
Total Net Assets |
$197,195,228 |
# of Portfolio Holdings |
967 |
Portfolio Turnover Rate |
25% |
Total Advisory Fees Paid |
$852,824 | |
|
| Holdings [Text Block] |
Geographic Allocation (% of total investments)
Table Summary
Value |
Value |
North America |
1.1% |
Developed Middle East |
2.1% |
Australasia/Pacific |
9.5% |
Asia |
21.0% |
Developed Europe |
66.3% | |
|
| Largest Holdings [Text Block] |
Top Ten Holdings (% of total investments)Footnote Referencea
Table Summary
Nestle SA |
1.2% |
Cie Financiere Richemont SA, Class A |
0.9% |
Deutsche Telekom AG |
0.9% |
Engie SA |
0.9% |
Shell PLC |
0.8% |
TotalEnergies SE |
0.8% |
Sanofi SA |
0.8% |
Air Liquide SA |
0.8% |
ASML Holding NV |
0.7% |
SAP SE |
0.7% |
Total |
8.5% |
| Footnote |
Description |
Footnotea |
Excluding cash equivalents | |
|
| Material Fund Change [Text Block] |
|
|
| Updated Prospectus Phone Number |
1-800-260-0761
|
|
| C000177028 |
|
|
| Shareholder Report [Line Items] |
|
|
| Fund Name |
Parametric Volatility Risk Premium - Defensive Fund
|
|
| Class Name |
Class I
|
|
| Trading Symbol |
EIVPX
|
|
| Annual or Semi-Annual Statement [Text Block] |
This annual shareholder report contains important information about the Parametric Volatility Risk Premium - Defensive Fund for the period of February 1, 2025 to January 31, 2026.
|
|
| Additional Information [Text Block] |
You can find additional information about the Fund at www.eatonvance.com/parametric-fund-documents.php. You can also request this information by contacting us at 1-800-260-0761.
|
|
| Additional Information Phone Number |
1-800-260-0761
|
|
| Additional Information Website |
<span style="box-sizing: border-box; color: rgb(0, 0, 0); display: inline; flex-wrap: nowrap; font-size: 10.6667px; font-weight: 400; grid-area: auto; line-height: 16px; margin: 0px; overflow: visible; text-align: left; text-align-last: auto; white-space-collapse: preserve-breaks;">www.eatonvance.com/parametric-fund-documents.php</span>
|
|
| Expenses [Text Block] |
What were the Fund costs for the last year?(based on a hypothetical $10,000 investment)
Class Name |
Costs of a $10,000 investment |
Costs paid as a percentage of a $10,000 investment |
Class I |
$49 |
0.46% | |
|
| Expenses Paid, Amount |
$ 49
|
|
| Expense Ratio, Percent |
0.46%
|
|
| Factors Affecting Performance [Text Block] |
How did the Fund perform last year and what affected its performance?Key contributors to (↑) and detractors from (↓) performance, relative to the Cboe S&P 500 BuyWrite IndexSM (the Index): ↑ The Fund outperformed the Index during the period due to enhanced diversification in portfolio construction, which improved investment results ↑ The Fund’s writing, or selling, of call options — a type of derivative — was additive to Index-relative returns during a period of strong equity performance ↑ The Fund's writing, or selling, of put options — a type of derivative — contributed to both absolute performance and Index-relative performance ↑ The Fund’s tax-managed allocation to equities — approximately 50% of the portfolio — delivered positive performance and was additive to Index-relative returns ↑ The Fund also outperformed its secondary benchmark, a blend of 50% S&P 500 Index/50% ICE BofA 3-Month U.S. Treasury Bill Index ↓ An approximately 50% allocation to U.S. Treasury bills — used as a hedge against market volatility — detracted from performance as U.S. Treasuries generally underperformed U.S. equities |
|
| Performance Past Does Not Indicate Future [Text] |
THE FUND'S PAST PERFORMANCE IS NO GUARANTEE OF FUTURE RESULTS.
|
|
| Line Graph [Table Text Block] |
Comparison of the change in value of a $1,000,000 investment for the period indicated.
|
Class I |
S&P 500® Index |
Cboe S&P 500 BuyWrite Index℠ |
2/17 |
$1,000,000 |
$1,000,000 |
$1,000,000 |
2/17 |
$1,011,000 |
$1,025,687 |
$1,006,300 |
3/17 |
$1,014,000 |
$1,026,883 |
$1,009,948 |
4/17 |
$1,024,000 |
$1,037,429 |
$1,019,170 |
5/17 |
$1,032,000 |
$1,052,029 |
$1,037,350 |
6/17 |
$1,039,000 |
$1,058,595 |
$1,040,991 |
7/17 |
$1,052,000 |
$1,080,363 |
$1,054,764 |
8/17 |
$1,057,000 |
$1,083,670 |
$1,057,694 |
9/17 |
$1,068,000 |
$1,106,024 |
$1,067,427 |
10/17 |
$1,076,000 |
$1,131,834 |
$1,073,726 |
11/17 |
$1,090,000 |
$1,166,547 |
$1,090,102 |
12/17 |
$1,095,836 |
$1,179,517 |
$1,097,232 |
1/18 |
$1,107,900 |
$1,247,049 |
$1,107,691 |
2/18 |
$1,088,799 |
$1,201,086 |
$1,091,986 |
3/18 |
$1,072,713 |
$1,170,563 |
$1,080,098 |
4/18 |
$1,081,761 |
$1,175,054 |
$1,094,493 |
5/18 |
$1,097,847 |
$1,203,352 |
$1,117,392 |
6/18 |
$1,103,879 |
$1,210,759 |
$1,116,761 |
7/18 |
$1,125,997 |
$1,255,815 |
$1,149,449 |
8/18 |
$1,144,093 |
$1,296,737 |
$1,171,238 |
9/18 |
$1,153,141 |
$1,304,117 |
$1,171,613 |
10/18 |
$1,100,863 |
$1,214,981 |
$1,107,659 |
11/18 |
$1,118,959 |
$1,239,740 |
$1,132,506 |
12/18 |
$1,062,131 |
$1,127,803 |
$1,044,943 |
1/19 |
$1,101,808 |
$1,218,180 |
$1,080,792 |
2/19 |
$1,118,086 |
$1,257,294 |
$1,096,298 |
3/19 |
$1,134,364 |
$1,281,725 |
$1,115,636 |
4/19 |
$1,154,711 |
$1,333,622 |
$1,133,105 |
5/19 |
$1,116,051 |
$1,248,873 |
$1,096,761 |
6/19 |
$1,154,711 |
$1,336,889 |
$1,152,227 |
7/19 |
$1,163,867 |
$1,356,103 |
$1,164,387 |
8/19 |
$1,157,763 |
$1,334,621 |
$1,151,157 |
9/19 |
$1,174,041 |
$1,359,593 |
$1,158,639 |
10/19 |
$1,193,371 |
$1,389,041 |
$1,182,551 |
11/19 |
$1,211,683 |
$1,439,462 |
$1,197,817 |
12/19 |
$1,229,848 |
$1,482,908 |
$1,208,811 |
1/20 |
$1,229,848 |
$1,482,326 |
$1,195,158 |
2/20 |
$1,149,506 |
$1,360,302 |
$1,104,849 |
3/20 |
$1,032,083 |
$1,192,288 |
$940,182 |
4/20 |
$1,092,855 |
$1,345,131 |
$983,816 |
5/20 |
$1,123,756 |
$1,409,197 |
$1,027,402 |
6/20 |
$1,141,266 |
$1,437,222 |
$1,026,148 |
7/20 |
$1,182,467 |
$1,518,260 |
$1,065,670 |
8/20 |
$1,221,591 |
$1,627,394 |
$1,093,288 |
9/20 |
$1,203,035 |
$1,565,558 |
$1,093,064 |
10/20 |
$1,184,479 |
$1,523,924 |
$1,053,263 |
11/20 |
$1,254,579 |
$1,690,739 |
$1,155,014 |
12/20 |
$1,288,037 |
$1,755,745 |
$1,175,509 |
1/21 |
$1,288,037 |
$1,738,019 |
$1,176,803 |
2/21 |
$1,311,908 |
$1,785,945 |
$1,189,011 |
3/21 |
$1,353,424 |
$1,864,161 |
$1,242,912 |
4/21 |
$1,385,599 |
$1,963,649 |
$1,253,036 |
5/21 |
$1,397,010 |
$1,977,364 |
$1,277,316 |
6/21 |
$1,417,767 |
$2,023,525 |
$1,306,035 |
7/21 |
$1,436,450 |
$2,071,594 |
$1,312,542 |
8/21 |
$1,464,473 |
$2,134,582 |
$1,346,915 |
9/21 |
$1,432,298 |
$2,035,303 |
$1,323,728 |
10/21 |
$1,481,079 |
$2,177,900 |
$1,385,502 |
11/21 |
$1,475,890 |
$2,162,810 |
$1,364,759 |
12/21 |
$1,519,477 |
$2,259,738 |
$1,416,178 |
1/22 |
$1,471,140 |
$2,142,804 |
$1,380,935 |
2/22 |
$1,456,429 |
$2,078,645 |
$1,371,506 |
3/22 |
$1,491,105 |
$2,155,824 |
$1,427,827 |
4/22 |
$1,419,650 |
$1,967,832 |
$1,360,408 |
5/22 |
$1,422,803 |
$1,971,443 |
$1,309,612 |
6/22 |
$1,357,652 |
$1,808,712 |
$1,271,855 |
7/22 |
$1,421,752 |
$1,975,484 |
$1,321,389 |
8/22 |
$1,386,024 |
$1,894,920 |
$1,257,970 |
9/22 |
$1,309,315 |
$1,720,400 |
$1,175,350 |
10/22 |
$1,372,363 |
$1,859,686 |
$1,247,423 |
11/22 |
$1,419,650 |
$1,963,613 |
$1,271,631 |
12/22 |
$1,388,021 |
$1,850,480 |
$1,255,224 |
1/23 |
$1,437,958 |
$1,966,753 |
$1,307,720 |
2/23 |
$1,428,879 |
$1,918,767 |
$1,305,660 |
3/23 |
$1,464,061 |
$1,989,213 |
$1,329,924 |
4/23 |
$1,490,165 |
$2,020,261 |
$1,345,230 |
5/23 |
$1,504,919 |
$2,029,042 |
$1,358,100 |
6/23 |
$1,553,721 |
$2,163,112 |
$1,386,628 |
7/23 |
$1,582,094 |
$2,232,602 |
$1,406,485 |
8/23 |
$1,578,690 |
$2,197,055 |
$1,384,233 |
9/23 |
$1,536,697 |
$2,092,304 |
$1,347,242 |
10/23 |
$1,531,022 |
$2,048,311 |
$1,338,076 |
11/23 |
$1,585,499 |
$2,235,373 |
$1,376,799 |
12/23 |
$1,621,245 |
$2,336,928 |
$1,403,626 |
1/24 |
$1,642,718 |
$2,376,198 |
$1,428,425 |
2/24 |
$1,689,244 |
$2,503,077 |
$1,456,003 |
3/24 |
$1,725,033 |
$2,583,612 |
$1,488,076 |
4/24 |
$1,692,823 |
$2,478,086 |
$1,467,907 |
5/24 |
$1,741,734 |
$2,600,961 |
$1,483,924 |
6/24 |
$1,778,716 |
$2,694,289 |
$1,510,176 |
7/24 |
$1,793,032 |
$2,727,084 |
$1,527,302 |
8/24 |
$1,809,734 |
$2,793,234 |
$1,571,822 |
9/24 |
$1,834,786 |
$2,852,890 |
$1,593,859 |
10/24 |
$1,835,979 |
$2,827,018 |
$1,585,898 |
11/24 |
$1,902,785 |
$2,992,967 |
$1,649,381 |
12/24 |
$1,889,078 |
$2,921,620 |
$1,686,060 |
1/25 |
$1,923,380 |
$3,002,980 |
$1,723,139 |
2/25 |
$1,917,255 |
$2,963,797 |
$1,713,558 |
3/25 |
$1,858,451 |
$2,796,804 |
$1,633,923 |
4/25 |
$1,851,100 |
$2,777,839 |
$1,607,344 |
5/25 |
$1,906,229 |
$2,952,689 |
$1,621,859 |
6/25 |
$1,957,683 |
$3,102,841 |
$1,664,926 |
7/25 |
$1,989,535 |
$3,172,478 |
$1,676,918 |
8/25 |
$2,025,062 |
$3,236,789 |
$1,693,238 |
9/25 |
$2,064,265 |
$3,354,932 |
$1,723,730 |
10/25 |
$2,097,342 |
$3,433,483 |
$1,767,947 |
11/25 |
$2,118,168 |
$3,441,899 |
$1,806,526 |
12/25 |
$2,132,410 |
$3,444,006 |
$1,836,323 |
1/26 |
$2,156,638 |
$3,493,945 |
$1,856,667 | |
|
| Average Annual Return [Table Text Block] |
Average Annual Total Returns (%)
Fund |
1 Year |
5 Years |
Since 2/9/17 (Inception) |
Class I |
12.13% |
10.85% |
8.93% |
S&P 500® Index |
16.35% |
14.98% |
14.95% |
Cboe S&P 500 BuyWrite Index℠ |
7.75% |
9.54% |
7.13% | Performance does not reflect the deduction of taxes that a shareholder would pay on Fund distributions or redemption of Fund shares. Performance assumes that all dividends and distributions, if any, were reinvested. For more recent performance information, visit www.eatonvance.com/performance.php. THE FUND'S PAST PERFORMANCE IS NO GUARANTEE OF FUTURE RESULTS. |
|
| Performance Inception Date |
Feb. 09, 2017
|
|
| No Deduction of Taxes [Text Block] |
Performance does not reflect the deduction of taxes that a shareholder would pay on Fund distributions or redemption of Fund shares.
|
|
| Updated Performance Information Location [Text Block] |
For more recent performance information, visit www.eatonvance.com/performance.php.
|
|
| AssetsNet |
$ 1,309,196,126
|
|
| Holdings Count | Holding |
193
|
|
| Advisory Fees Paid, Amount |
$ 4,595,416
|
|
| InvestmentCompanyPortfolioTurnover |
25.00%
|
|
| Additional Fund Statistics [Text Block] |
Total Net Assets |
$1,309,196,126 |
# of Portfolio Holdings |
193 |
Portfolio Turnover Rate |
25% |
Total Advisory Fees Paid |
$4,595,416 | |
|
| Holdings [Text Block] |
Asset Allocation (% of total investments)
Value |
Value |
Short-Term Investments |
49.8% |
Common Stocks |
50.2% | |
|
| Largest Holdings [Text Block] |
Top Ten Holdings (% of total investments)Footnote Referencea
NVIDIA Corp. |
4.0% |
Apple, Inc. |
3.3% |
Microsoft Corp. |
2.8% |
Amazon.com, Inc. |
2.1% |
Alphabet, Inc., Class A |
1.8% |
Broadcom, Inc. |
1.5% |
Alphabet, Inc., Class C |
1.4% |
Meta Platforms, Inc., Class A |
1.3% |
Tesla, Inc. |
1.1% |
JPMorgan Chase & Co. |
0.9% |
Total |
20.2% |
| Footnote |
Description |
Footnotea |
Excluding short-term investments | |
|
| Material Fund Change [Text Block] |
|
|
| Updated Prospectus Phone Number |
1-800-260-0761
|
|