Pay vs Performance Disclosure - USD ($)
|
6 Months Ended |
12 Months Ended |
Dec. 31, 2024 |
Jun. 30, 2024 |
Dec. 31, 2025 |
Dec. 31, 2024 |
Dec. 31, 2023 |
| Pay vs Performance Disclosure |
|
|
|
|
|
| Pay vs Performance Disclosure, Table |
|
|
| | | | | | | | | | | | | | | | | | | Summary Compensation Table Total for First PEO(1) | | Summary Compensation Table Total for Second PEO(1) | | Compensation Actually Paid (3) to First PEO (1) | | Compensation Actually Paid (3) to Second PEO (1) | | Average Summary Compensation Table Total for Non-PEO NEOs(2) | | Average Compensation Actually Paid (3) to Non-PEO NEOs | | Value of Initial Fixed $100 Investment Based on Total Stockholder Return | | Net Income (Loss) Attributable to Common Stockholders in thousands) | | | | | | | | | | | | | | | | | | | | | | | | | | | | | | | | | | | | | | | | | | | | | | | | | | | | | | | | | | | | | | | | | | | | |
|
|
|
| Named Executive Officers, Footnote |
|
|
Mr. Zsigray was the PEO in 2025. During 2024 the PEO role changed from Mr. Hays to Mr. Zsigray effective June 30 2024. Mr. Hays was the PEO in 2023. (2)Our Non-PEO NEOs for each of the covered years were as follows: for 2025, Messrs. Eubanks, Rose and Coe; for 2024, Messrs. Eubanks and Rose; and for 2023, Messrs. Eubanks and Rose.
|
|
|
| PEO Total Compensation Amount |
|
|
$ 5,022,605
|
|
|
| PEO Actually Paid Compensation Amount |
|
|
$ 4,903,328
|
|
|
| Adjustment To PEO Compensation, Footnote |
|
|
"Compensation Actually Paid" is the summary compensation table total for the PEO (column (b) above) and average summary compensation table total for the Non-PEO NEOs (column (d) above), as applicable, with the below adjustments to the value of equity adjusted as follows pursuant to Item 402(v)(2)(iii)(C) of Regulation S-K. The “Compensation Actually Paid” amounts do not reflect the actual amount of compensation earned by or paid to the PEOs or Non-PEO NEOs in the applicable year. In the table below, the unvested equity values are computed in accordance with the methodology used for financial reporting purposes, and for unvested PSUs or Performance LTIPs, based on the probable outcome of such performance-based vesting conditions as of the last day of the covered year. | | | | | | | | | | | | | | | Summary Compensation Table Total | | | | | Less:New awards made during year | | | | | Plus: New awards unvested at end of year | | | | | Plus: Change in value of prior-year awards unvested at end of year | | | | | Plus: New awards vested during the year | | | | | Plus: Change in value of prior-year awards vested at end of year | | | | | | | | | | | | | | | Compensation Actually Paid | | | | |
|
|
|
| Non-PEO NEO Average Total Compensation Amount |
|
|
$ 868,882
|
$ 742,656
|
$ 1,060,440
|
| Non-PEO NEO Average Compensation Actually Paid Amount |
|
|
$ 846,373
|
578,383
|
665,107
|
| Adjustment to Non-PEO NEO Compensation Footnote |
|
|
"Compensation Actually Paid" is the summary compensation table total for the PEO (column (b) above) and average summary compensation table total for the Non-PEO NEOs (column (d) above), as applicable, with the below adjustments to the value of equity adjusted as follows pursuant to Item 402(v)(2)(iii)(C) of Regulation S-K. The “Compensation Actually Paid” amounts do not reflect the actual amount of compensation earned by or paid to the PEOs or Non-PEO NEOs in the applicable year. In the table below, the unvested equity values are computed in accordance with the methodology used for financial reporting purposes, and for unvested PSUs or Performance LTIPs, based on the probable outcome of such performance-based vesting conditions as of the last day of the covered year. | | | | | | | | | | | | | | | Summary Compensation Table Total | | | | | Less:New awards made during year | | | | | Plus: New awards unvested at end of year | | | | | Plus: Change in value of prior-year awards unvested at end of year | | | | | Plus: New awards vested during the year | | | | | Plus: Change in value of prior-year awards vested at end of year | | | | | | | | | | | | | | | Compensation Actually Paid | | | | |
|
|
|
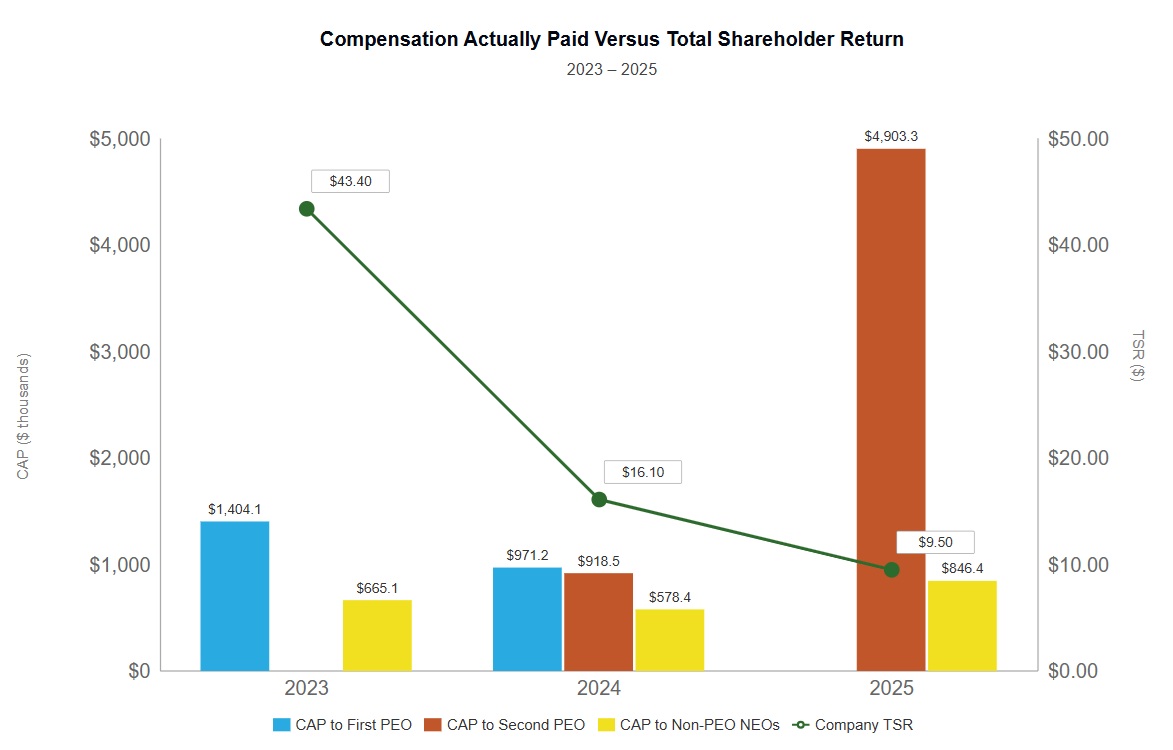
| Compensation Actually Paid vs. Total Shareholder Return |
|
|
|
|
|
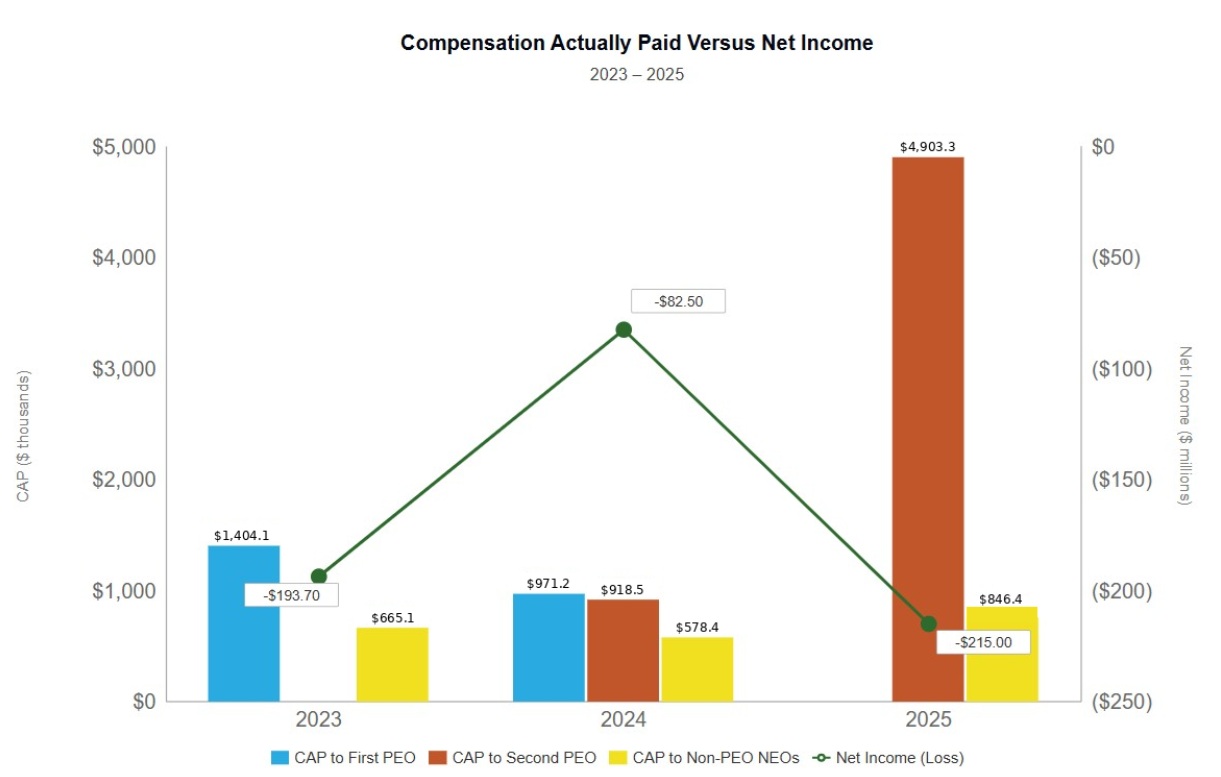
| Compensation Actually Paid vs. Net Income |
|
|
|
|
|
| Total Shareholder Return Amount |
|
|
$ 9.53
|
16.08
|
43.40
|
| Net Income (Loss) Available to Common Stockholders, Basic |
|
|
$ (215,004,000)
|
$ (82,522,000)
|
$ (193,693,000)
|
| PEO Name |
Mr. Zsigray
|
Mr. Hays
|
Mr. Zsigray
|
Mr. Hays
|
Mr. Hays
|
| Mr. Zsigray [Member] |
|
|
|
|
|
| Pay vs Performance Disclosure |
|
|
|
|
|
| PEO Total Compensation Amount |
|
|
$ 5,022,605
|
$ 858,748
|
|
| PEO Actually Paid Compensation Amount |
|
|
4,903,328
|
918,490
|
|
| Mr. Hays [Member] |
|
|
|
|
|
| Pay vs Performance Disclosure |
|
|
|
|
|
| PEO Total Compensation Amount |
|
|
|
1,473,796
|
$ 2,413,054
|
| PEO Actually Paid Compensation Amount |
|
|
|
$ 971,194
|
$ 1,404,138
|
| PEO | Aggregate Grant Date Fair Value of Equity Award Amounts Reported in Summary Compensation Table |
|
|
|
|
|
| Pay vs Performance Disclosure |
|
|
|
|
|
| Adjustment to Compensation, Amount |
|
|
0
|
|
|
| PEO | Year-end Fair Value of Equity Awards Granted in Covered Year that are Outstanding and Unvested |
|
|
|
|
|
| Pay vs Performance Disclosure |
|
|
|
|
|
| Adjustment to Compensation, Amount |
|
|
0
|
|
|
| PEO | Year-over-Year Change in Fair Value of Equity Awards Granted in Prior Years That are Outstanding and Unvested |
|
|
|
|
|
| Pay vs Performance Disclosure |
|
|
|
|
|
| Adjustment to Compensation, Amount |
|
|
(99,427)
|
|
|
| PEO | Vesting Date Fair Value of Equity Awards Granted and Vested in Covered Year |
|
|
|
|
|
| Pay vs Performance Disclosure |
|
|
|
|
|
| Adjustment to Compensation, Amount |
|
|
0
|
|
|
| PEO | Change in Fair Value as of Vesting Date of Prior Year Equity Awards Vested in Covered Year |
|
|
|
|
|
| Pay vs Performance Disclosure |
|
|
|
|
|
| Adjustment to Compensation, Amount |
|
|
(19,850)
|
|
|
| PEO | Prior Year End Fair Value of Equity Awards Granted in Any Prior Year that Fail to Meet Applicable Vesting Conditions During Covered Year |
|
|
|
|
|
| Pay vs Performance Disclosure |
|
|
|
|
|
| Adjustment to Compensation, Amount |
|
|
0
|
|
|
| PEO | Dividends or Other Earnings Paid on Equity Awards not Otherwise Reflected in Total Compensation for Covered Year |
|
|
|
|
|
| Pay vs Performance Disclosure |
|
|
|
|
|
| Adjustment to Compensation, Amount |
|
|
0
|
|
|
| Non-PEO NEO | Aggregate Grant Date Fair Value of Equity Award Amounts Reported in Summary Compensation Table |
|
|
|
|
|
| Pay vs Performance Disclosure |
|
|
|
|
|
| Adjustment to Compensation, Amount |
|
|
0
|
|
|
| Non-PEO NEO | Year-end Fair Value of Equity Awards Granted in Covered Year that are Outstanding and Unvested |
|
|
|
|
|
| Pay vs Performance Disclosure |
|
|
|
|
|
| Adjustment to Compensation, Amount |
|
|
0
|
|
|
| Non-PEO NEO | Year-over-Year Change in Fair Value of Equity Awards Granted in Prior Years That are Outstanding and Unvested |
|
|
|
|
|
| Pay vs Performance Disclosure |
|
|
|
|
|
| Adjustment to Compensation, Amount |
|
|
0
|
|
|
| Non-PEO NEO | Vesting Date Fair Value of Equity Awards Granted and Vested in Covered Year |
|
|
|
|
|
| Pay vs Performance Disclosure |
|
|
|
|
|
| Adjustment to Compensation, Amount |
|
|
0
|
|
|
| Non-PEO NEO | Change in Fair Value as of Vesting Date of Prior Year Equity Awards Vested in Covered Year |
|
|
|
|
|
| Pay vs Performance Disclosure |
|
|
|
|
|
| Adjustment to Compensation, Amount |
|
|
(1,702)
|
|
|
| Non-PEO NEO | Prior Year End Fair Value of Equity Awards Granted in Any Prior Year that Fail to Meet Applicable Vesting Conditions During Covered Year |
|
|
|
|
|
| Pay vs Performance Disclosure |
|
|
|
|
|
| Adjustment to Compensation, Amount |
|
|
(20,806)
|
|
|
| Non-PEO NEO | Dividends or Other Earnings Paid on Equity Awards not Otherwise Reflected in Total Compensation for Covered Year |
|
|
|
|
|
| Pay vs Performance Disclosure |
|
|
|
|
|
| Adjustment to Compensation, Amount |
|
|
$ 0
|
|
|