Pay vs Performance Disclosure - USD ($)
Dec. 31, 2025
Dec. 31, 2024
Dec. 31, 2023
Dec. 31, 2022
Dec. 31, 2021
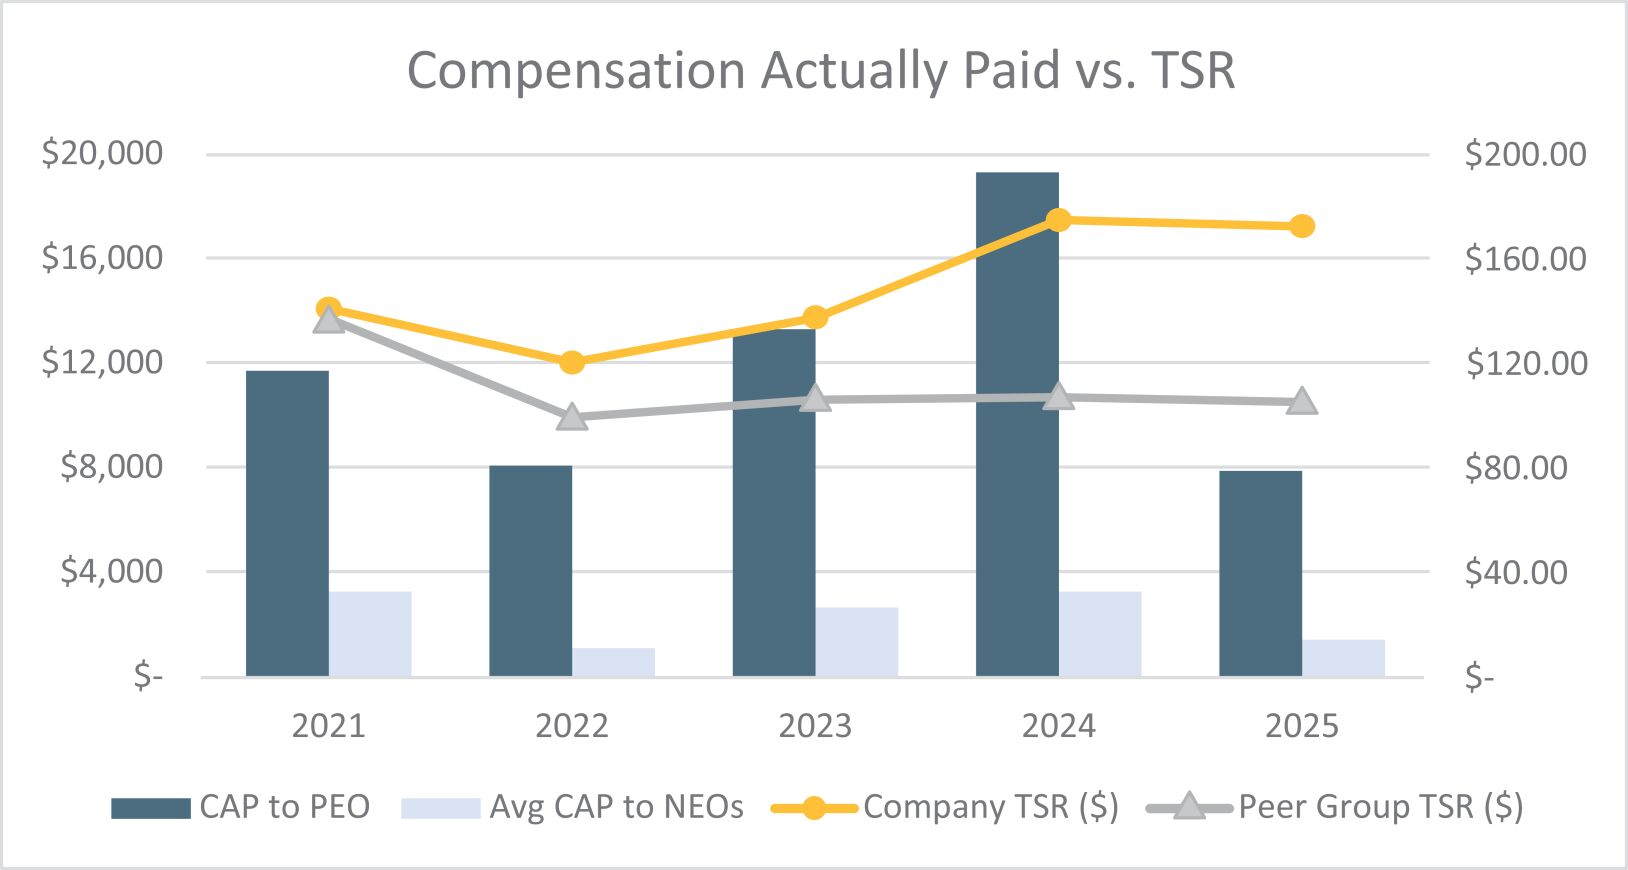
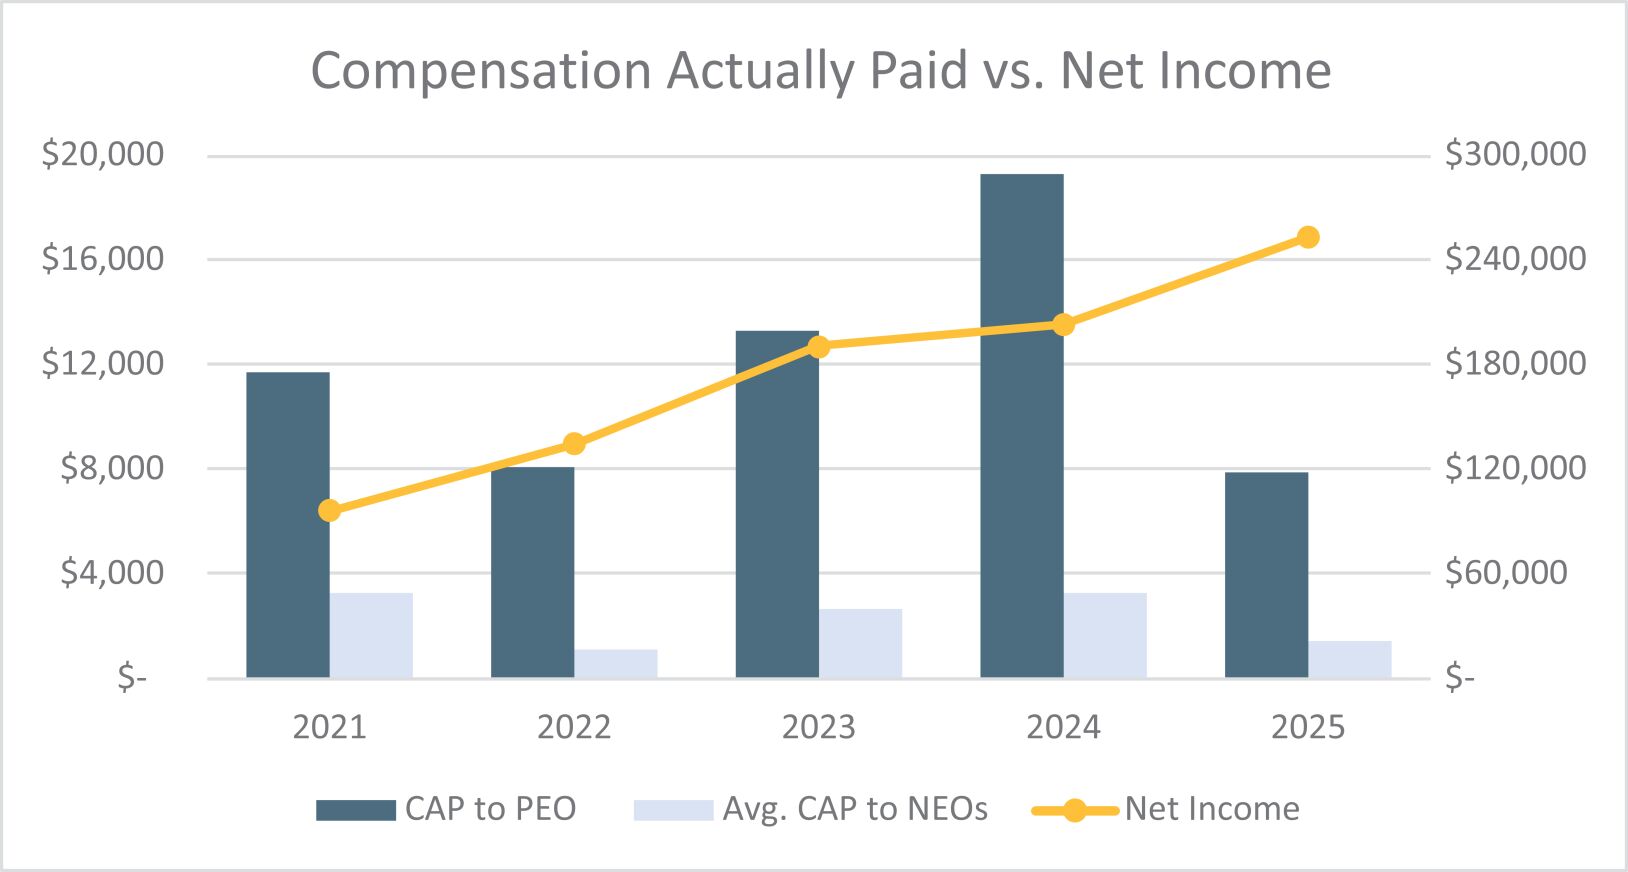
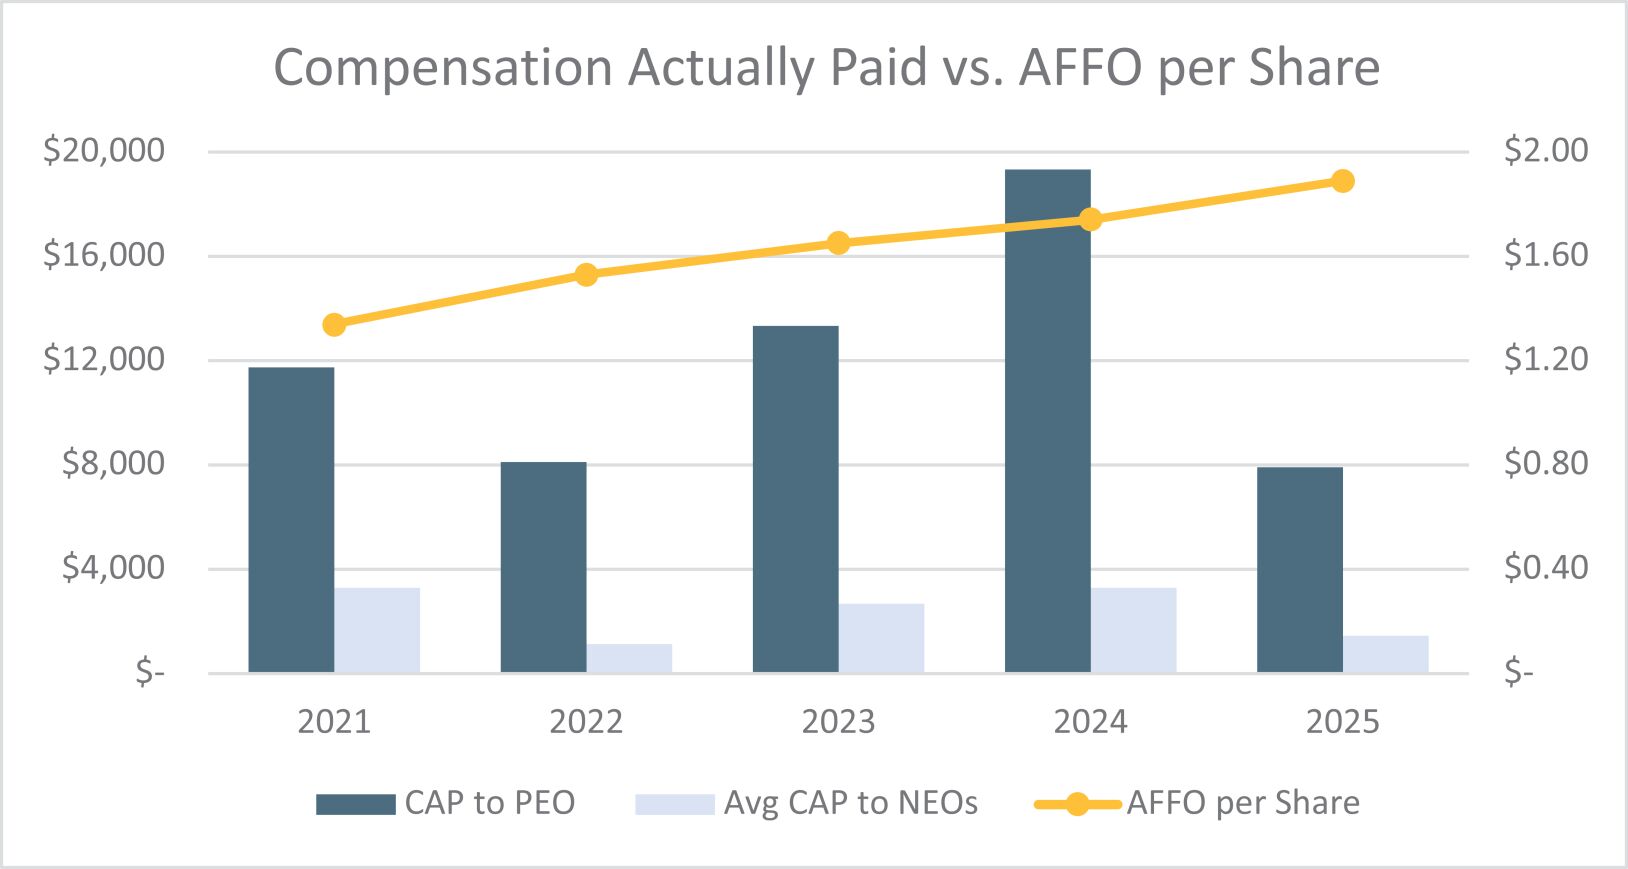
Pay Versus Performance
The following table provides historical total summary compensation and compensation actually paid (“
CAP
”) for our principal executive officer (“PEO
”) and other NEOs as an average and provides historical information regarding our performance (dollar amounts in thousands): Value of Initial Fixed $100 Investment Based on: (4) |
||||||||||||||||||||||||||||||||
Year (1) |
Summary Compensation Table Total for PEO (2) |
Compensation Actually Paid to PEO (3) |
Average Summary Compensation Table Total for Non-PEO NEOs (2) |
Average Compensation Actually Paid to Non-PEO NEOs (3) |
Total Shareholder Return |
Peer Group Total Shareholder Return (5) |
Net Income |
AFFO per Share (6) |
||||||||||||||||||||||||
2025 |
$ | 9,634 | $ | 7,905 | $ | 2,094 | $ | 1,445 | $ | 172.60 | $ | 105.43 | $ | 253,731 | $ | 1.89 | ||||||||||||||||
2024 |
$ | 8,339 | $ | 19,329 | $ | 2,051 | $ | 3,286 | $ | 175.10 | $ | 107.29 | $ | 203,638 | $ | 1.74 | ||||||||||||||||
2023 |
$ | 7,302 | $ | 13,326 | $ | 2,137 | $ | 2,678 | $ | 137.62 | $ | 106.31 | $ | 191,415 | $ | 1.65 | ||||||||||||||||
2022 |
$ | 9,786 | $ | 8,111 | $ | 1,742 | $ | 1,129 | $ | 120.61 | $ | 99.59 | $ | 134,742 | $ | 1.53 | ||||||||||||||||
2021 |
$ | 5,893 | $ | 11,738 | $ | 1,769 | $ | 3,285 | $ | 141.17 | $ | 137.29 | $ | 96,211 | $ | 1.34 | ||||||||||||||||
(1) |
Mr. Mavoides has served as the PEO for the entirety of the years presented and our other NEOs for the applicable years were as follows: |
| • | 2025: Mark E. Patten; A Joseph Peil; and R. Max Jenkins. |
| • | 2024: Mark E. Patten; A Joseph Peil; and R. Max Jenkins. |
| • | 2023: Mark E. Patten. |
| • | 2022 and 2021: Gregg A. Seibert and Mark E. Patten. |
(2) |
Amounts reported in these columns represent (i) the total compensation reported in the Summary Compensation Table for the applicable year in the case of our PEO and (ii) the average of the total compensation reported in the Summary Compensation Table for the applicable year for our NEOs for the applicable year other than the PEO for such years. |
(3) |
To calculate CAP, adjustments were made to the amounts reported in the Summary Compensation Table for the applicable year. A reconciliation of the adjustments for Mr. Mavoides and for the average of the other NEOs is set forth following the footnotes to this table. |
(4) |
Pursuant to rules of the SEC, the comparison assumes $100 was invested on December 31, 2020. Historic stock price performance is not necessarily indicative of future stock price performance. |
(5) |
The TSR peer group consists of the companies in the FTSE NAREIT All Equity REITs index, an independently prepared index that includes U.S. equity REITs. |
(6) |
As noted in the Compensation Discussion and Analysis section above titled “Corporate Metrics, Weightings and Results,” for 2025, the Compensation Committee determined that AFFO per Share continues to be viewed as a core driver of the Company’s performance and stockholder value creation and, accordingly, was utilized as a key performance metric for the annual performance-based cash bonus awards. AFFO per Share is a non-GAAP financial measure. See Annex A for a reconciliation of non-GAAP financial measures to the most directly comparable financial measures calculated in accordance with GAAP. |
Compensation Actually Paid Adjustments
The following table provides a reconciliation of (A) total compensation from the summary compensation table in the applicable year for our PEO or average for our other NEOs to (B) total CAP to our PEO or average CAP to our other NEOs (dollar amounts in thousands):
(MINUS) |
PLUS |
PLUS (MINUS) |
PLUS |
PLUS (MINUS) |
(MINUS) |
PLUS |
EQUALS |
|||||||||||||||||||||||||||||
Year |
Summary Compensation Table Total (1) |
Grant Date Fair Value of Stock Awards Granted in Fiscal Year (2) |
Fair Value at Fiscal Year-End ofOutstanding and Unvested Stock Awards Granted in Fiscal Year (3) |
Change in Fair Value of Outstanding and Unvested Stock Awards Granted in Prior Fiscal Years (4) |
Fair Value at Vesting of Stock Awards Granted in Fiscal Year That Vested During Fiscal Year (5) |
Change in Fair Value as of Vesting Date of Stock Awards Granted in Prior Years for Which Applicable Vesting Conditions were Satisfied During Fiscal Year (6) |
Fair Value as of Prior Fiscal Year-End of Stock Awards Granted in Prior Fiscal Years That Failed to Meet Applicable Vesting Conditions During Fiscal Year (7) |
Value of Dividends or Other Earnings Paid on Stock or Option Awards Not Otherwise Reflected in Fair Value or Total Compensation (8) |
CAP |
|||||||||||||||||||||||||||
Peter M. Mavoides (PEO) |
||||||||||||||||||||||||||||||||||||
2025 |
$ | 9,634 | $ | (6,853 | ) | $ | 3,762 | $ | 482 | $ | — | $ | 499 | $ | — | $ | 381 | $ | 7,905 | |||||||||||||||||
2024 |
$ | 8,339 | $ | (5,958 | ) | $ | 8,181 | $ | 5,535 | $ | — | $ | 3,033 | $ | — | $ | 199 | $ | 19,329 | |||||||||||||||||
2023 |
$ | 7,302 | $ | (4,858 | ) | $ | 5,297 | $ | 3,834 | $ | — | $ | 1,574 | $ | — | $ | 177 | $ | 13,326 | |||||||||||||||||
2022 |
$ | 9,786 | $ | (8,019 | ) | $ | 8,022 | $ | (1,313 | ) | $ | — | $ | (501 | ) | $ | — | $ | 136 | $ | 8,111 | |||||||||||||||
2021 |
$ | 5,893 | $ | (3,953 | ) | $ | 5,700 | $ | 2,159 | $ | — | $ | 1,827 | $ | — | $ | 112 | $ | 11,738 | |||||||||||||||||
Other NEOs (Average) (9) |
||||||||||||||||||||||||||||||||||||
2025 |
$ | 2,094 | $ | (1,132 | ) | $ | 376 | $ | (2 | ) | $ | — | $ | 49 | $ | — | $ | 60 | $ | 1,445 | ||||||||||||||||
2024 |
$ | 2,051 | $ | (922 | ) | $ | 1,504 | $ | 338 | $ | — | $ | 291 | $ | — | $ | 24 | $ | 3,286 | |||||||||||||||||
2023 |
$ | 2,137 | $ | (822 | ) | $ | 1,059 | $ | 113 | $ | — | $ | 150 | $ | — | $ | 41 | $ | 2,678 | |||||||||||||||||
2022 |
$ | 1,742 | $ | (907 | ) | $ | 689 | $ | (231 | ) | $ | — | $ | (199 | ) | $ | — | $ | 35 | $ | 1,129 | |||||||||||||||
2021 |
$ | 1,769 | $ | (710 | ) | $ | 1,024 | $ | 559 | $ | — | $ | 581 | $ | — | $ | 62 | $ | 3,285 | |||||||||||||||||
(1) |
Represents Total Compensation as reported in the Summary Compensation Table for the indicated fiscal year. With respect to the other NEOs, amounts shown represent averages. |
(2) |
Represents the grant date fair value of the stock awards granted during the indicated fiscal year, computed in accordance with the methodology used for financial reporting purposes. |
(3) |
Represents the fair value as of the indicated fiscal year-end of the outstanding and unvested stock awards granted during such fiscal year, computed in accordance with the methodology used for financial reporting purposes. |
(4) |
Represents the change in fair value during the indicated fiscal year of each stock award that was granted in a prior fiscal year and that remained outstanding and unvested as of the last day of the indicated fiscal year, computed in accordance with the methodology used for financial reporting purposes and, for awards subject to performance-based vesting conditions, based on the probable outcome of such performance-based vesting conditions as of the last day of the fiscal year. |
(5) |
Represents the fair value at vesting of the stock awards that were granted and vested during the indicated fiscal year, computed in accordance with the methodology used for financial reporting purposes. |
(6) |
Represents the change in fair value, measured from the prior fiscal year-end to the vesting date, of each stock award that was granted in a prior fiscal year and which vested during the indicated fiscal year, computed in accordance with the methodology used for financial reporting purposes. |
(7) |
Represents the fair value as of the last day of the prior fiscal year of the stock awards that were granted in a prior fiscal year and which failed to meet the applicable vesting conditions in the indicated fiscal year, computed in accordance with the methodology used for financial reporting purposes. |
(8) |
Represents cash dividends paid with respect to unvested time-based RSU awards and distributions paid with respect to unvested LTIP Units, in accordance with their terms and conditions to qualify for profits interests. The number of shares subject to a performance-based RSU increases for dividends paid by the Company and are reflected in the other columns to this table. |
(9) |
See footnote 1 in the Pay Versus Performance table above for the NEOs included in the average for each year. |
(1) |
Mr. Mavoides has served as the PEO for the entirety of the years presented and our other NEOs for the applicable years were as follows: |
| • | 2025: Mark E. Patten; A Joseph Peil; and R. Max Jenkins. |
| • | 2024: Mark E. Patten; A Joseph Peil; and R. Max Jenkins. |
| • | 2023: Mark E. Patten. |
| • | 2022 and 2021: Gregg A. Seibert and Mark E. Patten. |
Compensation Actually Paid Adjustments
The following table provides a reconciliation of (A) total compensation from the summary compensation table in the applicable year for our PEO or average for our other NEOs to (B) total CAP to our PEO or average CAP to our other NEOs (dollar amounts in thousands):
(MINUS) |
PLUS |
PLUS (MINUS) |
PLUS |
PLUS (MINUS) |
(MINUS) |
PLUS |
EQUALS |
|||||||||||||||||||||||||||||
Year |
Summary Compensation Table Total (1) |
Grant Date Fair Value of Stock Awards Granted in Fiscal Year (2) |
Fair Value at Fiscal Year-End ofOutstanding and Unvested Stock Awards Granted in Fiscal Year (3) |
Change in Fair Value of Outstanding and Unvested Stock Awards Granted in Prior Fiscal Years (4) |
Fair Value at Vesting of Stock Awards Granted in Fiscal Year That Vested During Fiscal Year (5) |
Change in Fair Value as of Vesting Date of Stock Awards Granted in Prior Years for Which Applicable Vesting Conditions were Satisfied During Fiscal Year (6) |
Fair Value as of Prior Fiscal Year-End of Stock Awards Granted in Prior Fiscal Years That Failed to Meet Applicable Vesting Conditions During Fiscal Year (7) |
Value of Dividends or Other Earnings Paid on Stock or Option Awards Not Otherwise Reflected in Fair Value or Total Compensation (8) |
CAP |
|||||||||||||||||||||||||||
Peter M. Mavoides (PEO) |
||||||||||||||||||||||||||||||||||||
2025 |
$ | 9,634 | $ | (6,853 | ) | $ | 3,762 | $ | 482 | $ | — | $ | 499 | $ | — | $ | 381 | $ | 7,905 | |||||||||||||||||
2024 |
$ | 8,339 | $ | (5,958 | ) | $ | 8,181 | $ | 5,535 | $ | — | $ | 3,033 | $ | — | $ | 199 | $ | 19,329 | |||||||||||||||||
2023 |
$ | 7,302 | $ | (4,858 | ) | $ | 5,297 | $ | 3,834 | $ | — | $ | 1,574 | $ | — | $ | 177 | $ | 13,326 | |||||||||||||||||
2022 |
$ | 9,786 | $ | (8,019 | ) | $ | 8,022 | $ | (1,313 | ) | $ | — | $ | (501 | ) | $ | — | $ | 136 | $ | 8,111 | |||||||||||||||
2021 |
$ | 5,893 | $ | (3,953 | ) | $ | 5,700 | $ | 2,159 | $ | — | $ | 1,827 | $ | — | $ | 112 | $ | 11,738 | |||||||||||||||||
Other NEOs (Average) (9) |
||||||||||||||||||||||||||||||||||||
2025 |
$ | 2,094 | $ | (1,132 | ) | $ | 376 | $ | (2 | ) | $ | — | $ | 49 | $ | — | $ | 60 | $ | 1,445 | ||||||||||||||||
2024 |
$ | 2,051 | $ | (922 | ) | $ | 1,504 | $ | 338 | $ | — | $ | 291 | $ | — | $ | 24 | $ | 3,286 | |||||||||||||||||
2023 |
$ | 2,137 | $ | (822 | ) | $ | 1,059 | $ | 113 | $ | — | $ | 150 | $ | — | $ | 41 | $ | 2,678 | |||||||||||||||||
2022 |
$ | 1,742 | $ | (907 | ) | $ | 689 | $ | (231 | ) | $ | — | $ | (199 | ) | $ | — | $ | 35 | $ | 1,129 | |||||||||||||||
2021 |
$ | 1,769 | $ | (710 | ) | $ | 1,024 | $ | 559 | $ | — | $ | 581 | $ | — | $ | 62 | $ | 3,285 | |||||||||||||||||
(1) |
Represents Total Compensation as reported in the Summary Compensation Table for the indicated fiscal year. With respect to the other NEOs, amounts shown represent averages. |
(2) |
Represents the grant date fair value of the stock awards granted during the indicated fiscal year, computed in accordance with the methodology used for financial reporting purposes. |
(3) |
Represents the fair value as of the indicated fiscal year-end of the outstanding and unvested stock awards granted during such fiscal year, computed in accordance with the methodology used for financial reporting purposes. |
(4) |
Represents the change in fair value during the indicated fiscal year of each stock award that was granted in a prior fiscal year and that remained outstanding and unvested as of the last day of the indicated fiscal year, computed in accordance with the methodology used for financial reporting purposes and, for awards subject to performance-based vesting conditions, based on the probable outcome of such performance-based vesting conditions as of the last day of the fiscal year. |
(5) |
Represents the fair value at vesting of the stock awards that were granted and vested during the indicated fiscal year, computed in accordance with the methodology used for financial reporting purposes. |
(6) |
Represents the change in fair value, measured from the prior fiscal year-end to the vesting date, of each stock award that was granted in a prior fiscal year and which vested during the indicated fiscal year, computed in accordance with the methodology used for financial reporting purposes. |
(7) |
Represents the fair value as of the last day of the prior fiscal year of the stock awards that were granted in a prior fiscal year and which failed to meet the applicable vesting conditions in the indicated fiscal year, computed in accordance with the methodology used for financial reporting purposes. |
(8) |
Represents cash dividends paid with respect to unvested time-based RSU awards and distributions paid with respect to unvested LTIP Units, in accordance with their terms and conditions to qualify for profits interests. The number of shares subject to a performance-based RSU increases for dividends paid by the Company and are reflected in the other columns to this table. |
(9) |
See footnote 1 in the Pay Versus Performance table above for the NEOs included in the average for each year. |
Most Important Financial Performance Measures to Link Company Performance to CAP
The following is a list of financial performance measures, which in our assessment represent the most important financial performance measures used by the Company to link CAP to the NEOs for 2025. Please see the Compensation Discussion and Analysis above for a further description of these metrics and how they are used in the Company’s executive compensation program:
| • | AFFO per Share |
| • | Pro Forma Net Debt-to-Annualized re Ratio |
| • | Relative TSR |
“Corporate Metrics, Weightings and Results,”
for 2025, the Compensation Committee determined that AFFO per Share continues to be viewed as a core driver of the Company’s performance and stockholder value creation and, accordingly, was utilized as a key performance metric for the annual performance-based cash bonus awards. AFFO per Share is a non-GAAP
financial measure. See Annex A for a reconciliation of non-GAAP
financial measures to the most directly comparable financial measures calculated in accordance with GAAP.