AVERAGE | AVERAGE | |||||||||||||||||||
| | | SUMMARY | | COMPENSATION | | ||||||||||||||
COMPENSATION | ACTUALLY | Value of Initial fixed $100 | ||||||||||||||||||
TABLE TOTAL | PAID TO | Investment BASED ON4: | ||||||||||||||||||
SUMMARY | SUMMARY | COMPENSATION | COMPENSATION | FOR NON-CEO | NON-CEO | PEER GROUP | ||||||||||||||
COMPENSATION | COMPENSATION | ACTUALLY | ACTUALLY | NAMED | NAMED | TOTAL | TOTAL | NET | ADJUSTED | |||||||||||
TABLE TOTAL | TABLE TOTAL | PAID TO | PAID TO | EXECUTIVE | EXECUTIVE | SHAREHOLDER | SHAREHOLDER | INCOME | EBITDA 5 | |||||||||||
YEAR | FOR FIRST CEO 1 | FOR SECOND CEO 1 | FIRST CEO 2 | SECOND CEO 2 | OFFICERS 3 | OFFICERS 2,3 | RETURN | RETURN | ($M) | ($M) | ||||||||||
(a) | (b) | (b) | (c) | (c) | (d) | (e) | (f) | (g) | (h) | (i) | ||||||||||
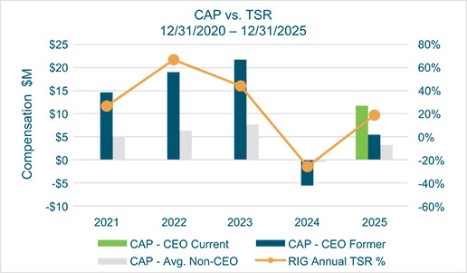
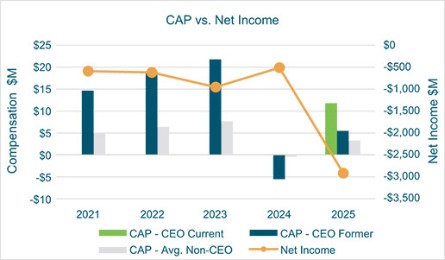
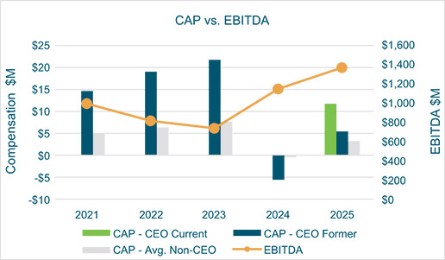
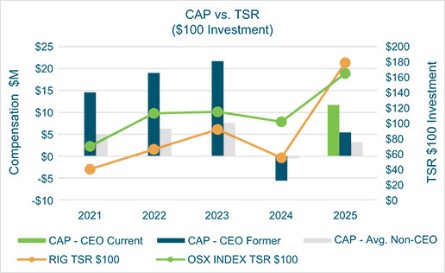
2025 | $ 7,106,087 | $ 8,793,715 | $ 5,439,302 | $ 11,653,021 | $ 3,094,187 | $ 3,159,154 | $ 179 | $ 165 | $ (2,915) | $ 1,370 | ||||||||||
2024 | $ 10,938,141 | N/A | $ (5,609,409) | N/A | $ 3,734,275 | $ (512,328) | $ 55 | $ 102 | $ (512) | $ 1,148 | ||||||||||
2023 |
| $ 11,355,216 | N/A | $ 21,695,979 | N/A | $ 4,427,539 | $ 7,592,127 | $ 92 | $ 115 | $ (954) | $ 738 | |||||||||
2022 |
| $ 11,733,864 | N/A | $ 18,982,502 | N/A | $ 4,213,127 | $ 6,391,352 | $ 66 | $ 113 | $ (621) | $ 816 | |||||||||
2021 |
| $ 13,715,358 | N/A | $ 14,571,784 | N/A | $ 4,735,382 | $ 1,679,139 | $ 40 | $ 70 | $ (591) | $ 995 | |||||||||
| (1) | Amounts shown represent the total compensation reported for our first, former CEO, Mr. Thigpen for 2025, 2024, 2023, 2022 and 2021 and our second, current CEO, Mr. Adamson, for 2025. |
| (2) | Amounts shown represent the amount of “compensation actually paid”, as computed in accordance with SEC rules. These amounts do not reflect the actual compensation paid to our CEO or other NEOs during the applicable year, but also include (i) the year-end value of equity awards granted during the reported year, (ii) the change in the value of equity awards that were unvested at the end of the prior year, measured through the date the awards vested or were forfeited, or through the end of the reported fiscal year, and (iii) certain pension-related costs. |
| (3) | Amounts shown represent the total compensation reported for our Non-CEO, NEOs: Messrs. Vayda, Long, Mackenzie, and Pack for 2025; Messrs. Vayda, Adamson, Long, Mackenzie, and former NEO’s Mey, and Davis for 2024; Messrs. Adamson, Long, and former NEO’s Mey and Davis for 2023, 2022 and 2021. |
| (4) | Reflects cumulative total shareholder return of the Philadelphia SE Oil Services Sector (OSX) index, as of December 31, 2025, weighted according to each companies’ market capitalization at the beginning of each period for which a return is indicated. The OSX is the peer group utilized by Transocean for purposes of Item 201(e) of Regulation S-K under the Exchange Act in Transocean’s Annual Report on Form 10-K for the year ended December 31, 2025. |
| (5) | Adjusted EBITDA represents income before interest expense, interest income, taxes, depreciation and amortization, and excluding certain identified charges and credits. See Appendix A in this proxy statement for a reconciliation of Adjusted EBITDA to net income, the most directly comparable financial measure prepared and calculated in accordance with GAAP. |
The following tables set forth the requisite adjustments to determine Compensation Actually Paid (CAP) to our CEO and the average Compensation Actually Paid (CAP) to our non-CEO Named Executive Officers for fiscal year 2025.
The summary compensation table total for our current and former CEOs and the average summary compensation table totals for non-CEO Named Executive Officers are adjusted to arrive at the compensation actually paid and average compensation actually paid each year using the methodology as indicated in the table.
With respect to equity award adjustments for 2025 as disclosed in the table below, the valuation assumptions used to calculate fair values did not materially differ from those disclosed at the time of grant.
The values shown in the following table are for our current President and Chief Executive Officer, Keelan Adamson.
| 2025 | |
(U.S. $) | ||
Summary Compensation Table | $8,793,715 | |
Adjustments to Determine Compensation Actually Paid for Current CEO | ||
Deduction for Change in the Actuarial Present Values reported under the “Change in Pension Value and Nonqualified Deferred Compensation Earnings” Column of the Summary Compensation Table | ($66,010) | |
Increase for “Service Cost” for Pension Plans | - | |
Increase for “Prior Service Cost” for Pension Plans | - | |
Deduction for amounts reported under the “Stock Awards” column in the Summary Compensation Table | ($5,771,957) | |
Deduction for amounts reported under the “Option Awards” column in the Summary Compensation Table | - | |
Increase for fair value of awards granted during year that remain unvested as of year-end | $9,763,585 | |
Increase for fair value of awards granted during year that vest during year | - | |
Increase/deduction for change in fair value from prior year-end to current year-end of awards granted prior to year that were outstanding and unvested as of year-end | ($137,237) | |
Increase/deduction for change in fair value from prior year-end to vesting date of awards granted prior to year that vested during year | ($147,902) | |
Deduction of fair value of awards granted prior to year that were forfeited during year | ($781,173) | |
Increase based on dividends or other earnings paid during year prior to vesting date of award | - | |
Total Adjustments | $2,859,307 | |
Compensation Actually Paid (CAP) to CEO - Adamson | $11,653,021 |
The values shown in the following table are for our former Chief Executive Officer, Jeremy Thigpen who now serves as our Executive Chair.
| 2025 | |
(U.S. $) | ||
Summary Compensation Table | $7,106,087 | |
Adjustments to Determine Compensation Actually Paid for Prior CEO | ||
Deduction for Change in the Actuarial Present Values reported under the “Change in Pension Value and Nonqualified Deferred Compensation Earnings” Column of the Summary Compensation Table | - | |
Increase for “Service Cost” for Pension Plans | - | |
Increase for “Prior Service Cost” for Pension Plans | - | |
Deduction for amounts reported under the “Stock Awards” column in the Summary Compensation Table | ($3,740,429) | |
Deduction for amounts reported under the “Option Awards” column in the Summary Compensation Table | - | |
Increase for fair value of awards granted during year that remain unvested as of year-end | $4,995,969 | |
Increase for fair value of awards granted during year that vest during year | - | |
Increase/deduction for change in fair value from prior year-end to current year-end of awards granted prior to year that were outstanding and unvested as of year-end | ($309,933) | |
Increase/deduction for change in fair value from prior year-end to vesting date of awards granted prior to year that vested during year | ($380,469) | |
Deduction of fair value of awards granted prior to year that were forfeited during year | ($2,231,924) | |
Increase based on dividends or other earnings paid during year prior to vesting date of award | - | |
Total Adjustments | ($1,666,786) | |
Compensation Actually Paid (CAP) to CEO - Thigpen | $5,439,302 |
The individuals who were non-CEO Named Executive Officers during the applicable year are Messrs. Vayda, Long, Mackenzie, and Pack.
| 2025 | |
(U.S. $) | ||
Summary Compensation Table | $3,094,187 | |
Adjustments to Determine Compensation Actually Paid for Non-CEO NEOs | ||
Deduction for Change in the Actuarial Present Values reported under the “Change in Pension Value and Nonqualified Deferred Compensation Earnings” Column of the Summary Compensation Table | ($1,757) | |
Increase for “Service Cost” for Pension Plans | - | |
Increase for “Prior Service Cost” for Pension Plans | - | |
Deduction for amounts reported under the “Stock Awards” column in the Summary Compensation Table | ($1,608,597) | |
Deduction for amounts reported under the “Option Awards” column in the Summary Compensation Table | - | |
Increase for fair value of awards granted during year that remain unvested as of year-end | $2,148,551 | |
Increase for fair value of awards granted during year that vest during year | - | |
Increase/deduction for change in fair value from prior year-end to current year-end of awards granted prior to year that were outstanding and unvested as of year-end | ($58,663) | |
Increase/deduction for change in fair value from prior year-end to vesting date of awards granted prior to year that vested during year | ($66,178) | |
Deduction of fair value of awards granted prior to year that were forfeited during year | ($348,389) | |
Increase based on dividends or other earnings paid during year prior to vesting date of award | - | |
Total Adjustments | $64,967 | |
Compensation Actually Paid (CAP) to Non-CEO Named Executive Officers | $3,159,154 |
| (1) | Amounts shown represent the total compensation reported for our first, former CEO, Mr. Thigpen for 2025, 2024, 2023, 2022 and 2021 and our second, current CEO, Mr. Adamson, for 2025. |
| (3) | Amounts shown represent the total compensation reported for our Non-CEO, NEOs: Messrs. Vayda, Long, Mackenzie, and Pack for 2025; Messrs. Vayda, Adamson, Long, Mackenzie, and former NEO’s Mey, and Davis for 2024; Messrs. Adamson, Long, and former NEO’s Mey and Davis for 2023, 2022 and 2021. |
| (4) | Reflects cumulative total shareholder return of the Philadelphia SE Oil Services Sector (OSX) index, as of December 31, 2025, weighted according to each companies’ market capitalization at the beginning of each period for which a return is indicated. The OSX is the peer group utilized by Transocean for purposes of Item 201(e) of Regulation S-K under the Exchange Act in Transocean’s Annual Report on Form 10-K for the year ended December 31, 2025. |
| (2) | Amounts shown represent the amount of “compensation actually paid”, as computed in accordance with SEC rules. These amounts do not reflect the actual compensation paid to our CEO or other NEOs during the applicable year, but also include (i) the year-end value of equity awards granted during the reported year, (ii) the change in the value of equity awards that were unvested at the end of the prior year, measured through the date the awards vested or were forfeited, or through the end of the reported fiscal year, and (iii) certain pension-related costs. |
The values shown in the following table are for our current President and Chief Executive Officer, Keelan Adamson.
| 2025 | |
(U.S. $) | ||
Summary Compensation Table | $8,793,715 | |
Adjustments to Determine Compensation Actually Paid for Current CEO | ||
Deduction for Change in the Actuarial Present Values reported under the “Change in Pension Value and Nonqualified Deferred Compensation Earnings” Column of the Summary Compensation Table | ($66,010) | |
Increase for “Service Cost” for Pension Plans | - | |
Increase for “Prior Service Cost” for Pension Plans | - | |
Deduction for amounts reported under the “Stock Awards” column in the Summary Compensation Table | ($5,771,957) | |
Deduction for amounts reported under the “Option Awards” column in the Summary Compensation Table | - | |
Increase for fair value of awards granted during year that remain unvested as of year-end | $9,763,585 | |
Increase for fair value of awards granted during year that vest during year | - | |
Increase/deduction for change in fair value from prior year-end to current year-end of awards granted prior to year that were outstanding and unvested as of year-end | ($137,237) | |
Increase/deduction for change in fair value from prior year-end to vesting date of awards granted prior to year that vested during year | ($147,902) | |
Deduction of fair value of awards granted prior to year that were forfeited during year | ($781,173) | |
Increase based on dividends or other earnings paid during year prior to vesting date of award | - | |
Total Adjustments | $2,859,307 | |
Compensation Actually Paid (CAP) to CEO - Adamson | $11,653,021 |
The values shown in the following table are for our former Chief Executive Officer, Jeremy Thigpen who now serves as our Executive Chair.
| 2025 | |
(U.S. $) | ||
Summary Compensation Table | $7,106,087 | |
Adjustments to Determine Compensation Actually Paid for Prior CEO | ||
Deduction for Change in the Actuarial Present Values reported under the “Change in Pension Value and Nonqualified Deferred Compensation Earnings” Column of the Summary Compensation Table | - | |
Increase for “Service Cost” for Pension Plans | - | |
Increase for “Prior Service Cost” for Pension Plans | - | |
Deduction for amounts reported under the “Stock Awards” column in the Summary Compensation Table | ($3,740,429) | |
Deduction for amounts reported under the “Option Awards” column in the Summary Compensation Table | - | |
Increase for fair value of awards granted during year that remain unvested as of year-end | $4,995,969 | |
Increase for fair value of awards granted during year that vest during year | - | |
Increase/deduction for change in fair value from prior year-end to current year-end of awards granted prior to year that were outstanding and unvested as of year-end | ($309,933) | |
Increase/deduction for change in fair value from prior year-end to vesting date of awards granted prior to year that vested during year | ($380,469) | |
Deduction of fair value of awards granted prior to year that were forfeited during year | ($2,231,924) | |
Increase based on dividends or other earnings paid during year prior to vesting date of award | - | |
Total Adjustments | ($1,666,786) | |
Compensation Actually Paid (CAP) to CEO - Thigpen | $5,439,302 |
The individuals who were non-CEO Named Executive Officers during the applicable year are Messrs. Vayda, Long, Mackenzie, and Pack.
| 2025 | |
(U.S. $) | ||
Summary Compensation Table | $3,094,187 | |
Adjustments to Determine Compensation Actually Paid for Non-CEO NEOs | ||
Deduction for Change in the Actuarial Present Values reported under the “Change in Pension Value and Nonqualified Deferred Compensation Earnings” Column of the Summary Compensation Table | ($1,757) | |
Increase for “Service Cost” for Pension Plans | - | |
Increase for “Prior Service Cost” for Pension Plans | - | |
Deduction for amounts reported under the “Stock Awards” column in the Summary Compensation Table | ($1,608,597) | |
Deduction for amounts reported under the “Option Awards” column in the Summary Compensation Table | - | |
Increase for fair value of awards granted during year that remain unvested as of year-end | $2,148,551 | |
Increase for fair value of awards granted during year that vest during year | - | |
Increase/deduction for change in fair value from prior year-end to current year-end of awards granted prior to year that were outstanding and unvested as of year-end | ($58,663) | |
Increase/deduction for change in fair value from prior year-end to vesting date of awards granted prior to year that vested during year | ($66,178) | |
Deduction of fair value of awards granted prior to year that were forfeited during year | ($348,389) | |
Increase based on dividends or other earnings paid during year prior to vesting date of award | - | |
Total Adjustments | $64,967 | |
Compensation Actually Paid (CAP) to Non-CEO Named Executive Officers | $3,159,154 |
As described in detail in our CD&A, the Committee utilizes multiple key financial, operational, and environmental and safety measures to correlate our Named Executive Officer’s compensation to Company performance. In particular, the majority of compensation actually paid to our executives is based on the performance of Company stock. The key performance measures for 2025 are:
COMPANY SELECTED METRICS | ||
Relative Total Shareholder Return | ||
Adjusted EBITDA | ||
Uptime(1) | ||
Environmental and Safety(2) | ||
Company Free Cash Flow(3) | ||
(1) This is a non-financial performance measurement that is defined in the CD&A (2) Specific Company developed environmental & safety targets are explained in the CD&A (3) Details for Company Free Cash Flow performance are explained in the CD&A |
| (5) | Adjusted EBITDA represents income before interest expense, interest income, taxes, depreciation and amortization, and excluding certain identified charges and credits. See Appendix A in this proxy statement for a reconciliation of Adjusted EBITDA to net income, the most directly comparable financial measure prepared and calculated in accordance with GAAP. |