Pay vs Performance Disclosure
Feb. 28, 2021
Dec. 31, 2021
Dec. 31, 2025
USD ($)
Dec. 31, 2024
USD ($)
Dec. 31, 2023
USD ($)
Dec. 31, 2022
USD ($)
Dec. 31, 2021
USD ($)
Summary Compensation Table Total for Peter Zaffino(1) ($) | Summary Compensation Table Total for Brian Duperreault(1) ($) | Compensation Actually Paid to Peter Zaffino(1),(2),(3) ($) | Compensation Actually Paid to Brian Duperreault (1),(2),(3) ($) | Average Summary Compensation Table Total for Non-PEO NEOs(1) ($) | Average Compensation Actually Paid to Non-PEO NEOs(1),(2),(3) ($) | Value of Initial Fixed $100 Investment based on:(4) | Net Income ($ Millions) | Accident Year Combined Ratio, as adjusted*(5) (%) | ||||||||||||||||||||||||
| Year | TSR ($) | Peer Group TSR ($) | ||||||||||||||||||||||||||||||
| 2025 | 32,460,049 | — | 67,983,800 | — | 6,915,060 | 8,606,869 | 253.09 | 234.32 | 3,097 | 88.3 | ||||||||||||||||||||||
| 2024 | 24,638,373 | — | 33,931,497 | — | 6,493,761 | 6,722,095 | 210.84 | 212.86 | (926) | 88.2 | ||||||||||||||||||||||
| 2023 | 24,617,936 | — | 38,715,733 | — | 8,096,539 | 6,186,239 | 192.10 | 157.12 | 3,878 | 87.7 | ||||||||||||||||||||||
| 2022 | 75,314,199 | — | 90,844,101 | — | 9,077,342 | 12,293,363 | 175.08 | 141.79 | 11,273 | 88.7 | ||||||||||||||||||||||
| 2021 | 21,905,220 | 13,969,537 | 52,445,392 | 45,269,700 | 10,476,911 | 20,741,560 | 153.92 | 119.28 | 10,906 | 91.0 | ||||||||||||||||||||||
| Year | Summary Compensation Table Total for Peter Zaffino ($) | Exclusion of Stock Awards and Option Awards for Peter Zaffino ($) | Inclusion of Equity Values for Peter Zaffino ($) | Compensation Actually Paid to Peter Zaffino ($) | ||||||||||
| 2025 | 32,460,049 | (18,459,849) | 53,983,600 | 67,983,800 | ||||||||||
| Year | Average Summary Compensation Table Total for Non-PEO NEOs ($) | Average Exclusion of Stock Awards and Option Awards for Non-PEO NEOs ($) | Average Inclusion of Equity Values for Non-PEO NEOs ($) | Average Compensation Actually Paid to Non-PEO NEOs ($) | ||||||||||
| 2025 | 6,915,060 | (2,571,801) | 4,263,610 | 8,606,869 | ||||||||||
The amounts in the Inclusion of Equity Values in the tables above are derived from the amounts set forth in the following tables. Please note that any columns included in the calculation of Compensation Actually Paid that contain a “0” did not have an amount in that category for that year.
| Year | Year-End Fair Value of Equity Awards Granted During Year That Remained Unvested as of Last Day of Year for Peter Zaffino ($) | Change in Fair Value from Last Day of Prior Year to Last Day of Year of Unvested Equity Awards for Peter Zaffino ($) | Average Vesting-Date Fair Value of Equity Awards Granted During Year that Vested During Year for Peter Zaffino ($) | Change in Fair Value from Last Day of Prior Year to Vesting Date of Unvested Equity Awards that Vested During Year for Peter Zaffino ($) | Fair Value at Last Day of Prior Year of Equity Awards Forfeited During Year for Peter Zaffino ($) | Total - Inclusion of Equity Values for Peter Zaffino ($) | ||||||||||||||
| 2025 | 20,941,570 | 32,134,363 | 0 | 907,667 | 0 | 53,983,600 | ||||||||||||||
| Year | Average Year-End Fair Value of Equity Awards Granted During Year That Remained Unvested as of Last Day of Year for Non-PEO NEOs ($) | Average Change in Fair Value from Last Day of Prior Year to Last Day of Year of Unvested Equity Awards for Non-PEO NEOs ($) | Average Vesting-Date Fair Value of Equity Awards Granted During Year that Vested During Year for Non-PEO NEOs ($) | Average Change in Fair Value from Last Day of Prior Year to Vesting Date of Unvested Equity Awards that Vested During Year for Non-PEO NEOs ($) | Average Fair Value at Last Day of Prior Year of Equity Awards Forfeited During Year for Non-PEO NEOs ($) | Total - Average Inclusion of Equity Values for Non-PEO NEOs ($) | ||||||||||||||
| 2025 | 2,931,361 | 1,239,149 | 0 | 93,100 | 0 | 4,263,610 | ||||||||||||||
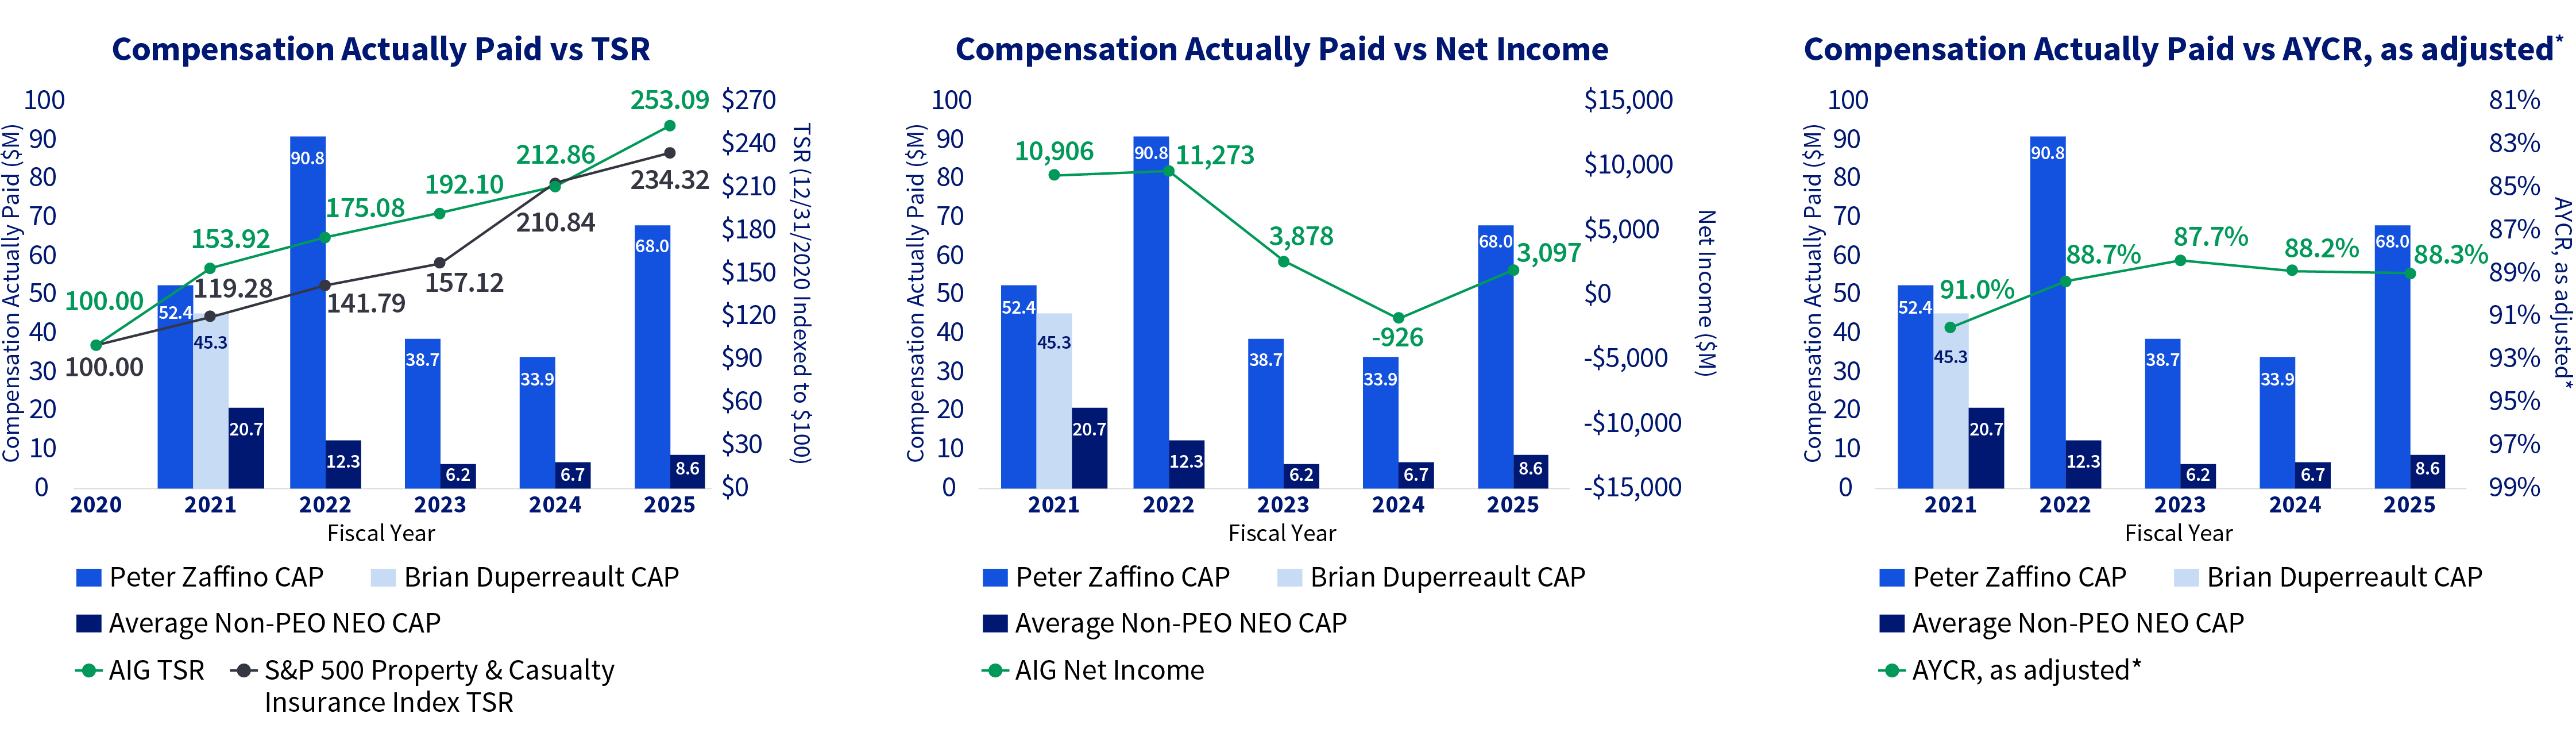
Relationship Between PEO and Non-PEO NEO Compensation Actually Paid and Company Financial Performance Measures
The following charts set forth the relationship between Compensation Actually Paid (CAP) to our PEO, the Average CAP to our
Non-PEO NEOs, with the following three measures of financial performance, against the five most recently completed fiscal years:
Non-PEO NEOs, with the following three measures of financial performance, against the five most recently completed fiscal years:
nthe cumulative TSR for the Company and the Peer Group
nour Net Income
nour Company-selected measure, AYCR, as adjusted*
Accident Year Combined Ratio, as adjusted* | Calendar Year Combined Ratio | Diluted Adjusted After-tax Income Attributable to AIG Common Shareholders Per Share* | Core Operating Return on Equity* | Relative Total Shareholder Return | ||||||||||||||||||||||||||||