Average | ||||||||||||||||
Summary | Summary | Average | ||||||||||||||
Compensation | Compensation | Compensation | Compensation | |||||||||||||
Total | Actually Paid | Total for | Actually paid to | Value of Initial Fixed $100 | GAAP | |||||||||||
for CEO (1) | To CEO | Other NEOs (1) | Other NEOs | Investment Based On: | Net Income | Combined | ||||||||||
Year | | ($) | | (1), (2), (3) ($) | | ($) | | (1), (2), (3) ($) | | TSR | | Peer Group (4) | | ($) (in millions) | | Ratio (5) |
2025 | 4,187,838 | 3,810,904 | 1,319,467 | 1,183,027 | 125.0 | 134.3 | 99.3 | 99.0% | ||||||||
2024 |
| 3,679,625 |
| 3,274,933 |
| 1,223,190 |
| 1,295,394 |
| 126.1 | 129.0 |
| 70.7 | 101.1% | ||
2023 |
| 1,962,783 |
| 664,623 |
| 831,208 |
| 277,912 |
| 111.3 |
| 104.4 |
| 18.9 | 107.7% | |
2022 |
| 2,753,190 |
| 2,521,325 |
| 1,100,348 |
| 997,797 |
| 117.7 |
| 92.1 |
| 46.6 | 97.2% | |
2021 |
| 3,236,556 |
| 3,644,065 |
| 1,245,166 |
| 1,436,698 |
| 114.1 |
| 88.5 |
| 130.7 | 93.0% | |
| 1. | George M. Murphy was our CEO for each year presented. The individuals comprising the Other NEOs for years 2021-2023 presented were James D. Berry, Paul J. Narciso, Stephen A. Varga, and Christopher T. Whitford. The individuals comprising the Other NEOs for years 2024-2025 were John P. Drago, Paul J. Narciso, Stephen A. Varga, and Christopher T. Whitford, as James D. Berry retired effective July 1, 2024. |
| 2. | The amounts shown for Compensation Actually Paid (“CAP”) have been calculated in accordance with Item 402(v) of Regulation S-K and do not reflect compensation actually earned, realized, or received by the company’s CEO or Other |
| NEOs. These amounts reflect the Summary Compensation Table Total (“SCT”) with certain adjustments as described in footnote 3 below. |
| 3. | CAP reflects the exclusions and inclusions of certain amounts for the CEO and the Other NEOs as set forth below. Equity values are calculated in accordance with FASB ASC Topic 718. Amounts in the Exclusion of Stock Awards column are the totals from the Stock Awards columns set forth in the Summary Compensation Table for the listed year. |
Summary | Exclusion of | Inclusion of | Compensation | |||||
Compensation | Stock Awards for | Equity Values | Actually Paid To | |||||
Total for CEO | CEO | for CEO | CEO | |||||
Year | | ($) | | ($) | | ($) | | ($) |
2025 | 4,187,838 | (1,100,000) | 723,066 | 3,810,904 | ||||
2024 |
| 3,679,625 | (1,100,000) | 695,308 |
| 3,274,933 | ||
2023 |
| 1,962,783 |
| (1,000,000) |
| (298,160) |
| 664,623 |
2022 |
| 2,753,190 |
| (900,000) |
| 668,135 |
| 2,521,325 |
2021 |
| 3,236,556 |
| (800,000) |
| 1,207,509 |
| 3,644,065 |
Average | Average | Average | ||||||
Summary | Exclusion of | Inclusion of | Average | |||||
Compensation | Stock Awards | Equity Values | Compensation | |||||
Total for | for | for | Actually Paid | |||||
Other NEOs | Other NEOs | Other NEOs | to Other NEOs | |||||
Year | ($) | | ($) | | ($) | | ($) | |
2025 | 1,319,467 | (387,500) | 251,059 | 1,183,027 | ||||
2024 |
| 1,223,190 | (187,500) |
| 259,704 |
| 1,295,394 | |
2023 |
| 831,208 |
| (381,250) |
| (172,046) |
| 277,912 |
2022 |
| 1,100,348 |
| (375,000) |
| 272,449 |
| 997,797 |
2021 |
| 1,245,166 |
| (381,250) |
| 572,782 |
| 1,436,698 |
Year-End | Change In | |||||||||||
Fair Value | Fair Value | |||||||||||
Of Equity | Change In | From Last Day | ||||||||||
Awards | Fair Value | Vesting Date | Of Prior Year | |||||||||
Granted | From Last Day | Fair Value Of | To Vesting | Fair Value At | ||||||||
During Year | Of Prior Year | Equity Awards | Date Of | Last Day Of | ||||||||
That Remained | To Last Day Of | Granted | Unvested | Prior Year Of | ||||||||
Unvested | Year Of | During Year | Equity Awards | Equity Awards | Total | |||||||
As Of Last Day | Unvested | That Vested | That Vested | Forfeited | Inclusion of | |||||||
Of Year For | Equity Awards | During Year | During Year | During Year | Equity Values | |||||||
CEO | For CEO | For CEO | For CEO | For CEO | for CEO | |||||||
Year | | ($) | | ($) | | ($) | | ($) | | ($) | | ($) |
2025 | 925,181 | (169,445) | - | (32,670) | - | 723,066 | ||||||
2024 |
| 835,206 | 62,010 | - | (201,907) |
| - |
| 695,308 | |||
2023 |
| 513,326 |
| (716,501) |
| - |
| (94,985) |
| - |
| (298,160) |
2022 |
| 868,509 |
| (116,686) |
| - |
| (83,688) |
| - |
| 668,135 |
2021 |
| 1,142,299 |
| 88,148 |
| - |
| (22,938) |
| - |
| 1,207,509 |
Average | ||||||||||||
Year-End | Average Change | |||||||||||
Fair Value Of | Average Change | Average | In Fair Value | |||||||||
Equity Awards | In Fair Value | Vesting Date | From Last Day | Average | ||||||||
Granted During | From Last Day | Fair Value | Of Prior Year | Fair Value | ||||||||
Year That | Of Prior Year | Of Equity Awards | To Vesting Date | At Last Day Of | Total - | |||||||
Remained | To Last Day | Granted During | Of Unvested | Prior Year Of | Average | |||||||
Unvested As Of | Of Year Of | Year That Vested | Equity Awards | Equity Awards | Inclusion Of | |||||||
Last Day | Unvested Equity | During Year | That Vested | Forfeited | Equity Values | |||||||
Of Year For | Awards For | For | During Year For | During Year For | For | |||||||
Other NEOs | Other NEOs | Other NEOs | Other NEOs | Other NEOs | Other NEOs | |||||||
Year | | ($) | | ($) | | ($) | | ($) | | ($) | | ($) |
2025 | 325,922 | (62,249) | - | (12,614) | - | 251,059 | ||||||
2024 |
| 303,737 | 27,162 | - | (71,195) | - |
| 259,704 | ||||
2023 |
| 195,697 |
| (325,494) | - | (42,249) |
| - |
| (172,046) | ||
2022 |
| 361,820 |
| (55,434) | - | (33,937) |
| - |
| 272,449 | ||
2021 |
| 544,437 |
| 37,131 | - | (8,786) |
| - |
| 572,782 |
| 4. | The Insurance Peer Group TSR set forth in this table utilizes a peer group comprised of seven selected property & casualty insurance companies as used in our stock performance graph required by Item 201(e) of Regulation S-K included in our Annual Report on Form 10-K for the year ended December 31, 2025. The Compensation Peer Group consists of Donegal Group, Inc., Erie Indemnity Company, Horace Mann Educators Corporation, The Hanover Insurance Group, Inc., Mercury General Corp., Selective Insurance Group, Inc., and United Fire Group. The comparison assumes $100 was invested for the period starting December 31, 2020, through the end of the listed year in the company and in the peer group, respectively. All dollar values assume reinvestment of the pre-tax value of dividends paid by companies, where applicable, included in the peer group. Historical stock performance is not necessarily indicative of future stock performance. This Insurance Peer Group TSR is not the same group as the Performance Peer Financials Group used by the Committee to determine performance-based compensation awards or the Compensation Peer Group used by the Committee as a reference for compensation program design. See Compensation of Named Executive Officers, Compensation Discussion and Analysis, Benchmarking and Peer Group beginning on Page 27 for more information about the Committee's selection and use of these Peer Groups in making compensation decisions. |
| 5. | For 2025, we determined Combined Ratio to be the most important financial performance measure used to link company performance to CAP for our CEO and Other NEOs in 2025 and 2024. This performance measure may not have been the most important financial performance measure for years 2023 and 2022, and we may determine a different financial performance measure to be the most important financial performance measure in future years. |
| 1. | George M. Murphy was our CEO for each year presented. The individuals comprising the Other NEOs for years 2021-2023 presented were James D. Berry, Paul J. Narciso, Stephen A. Varga, and Christopher T. Whitford. The individuals comprising the Other NEOs for years 2024-2025 were John P. Drago, Paul J. Narciso, Stephen A. Varga, and Christopher T. Whitford, as James D. Berry retired effective July 1, 2024. |
| 4. | The Insurance Peer Group TSR set forth in this table utilizes a peer group comprised of seven selected property & casualty insurance companies as used in our stock performance graph required by Item 201(e) of Regulation S-K included in our Annual Report on Form 10-K for the year ended December 31, 2025. The Compensation Peer Group consists of Donegal Group, Inc., Erie Indemnity Company, Horace Mann Educators Corporation, The Hanover Insurance Group, Inc., Mercury General Corp., Selective Insurance Group, Inc., and United Fire Group. The comparison assumes $100 was invested for the period starting December 31, 2020, through the end of the listed year in the company and in the peer group, respectively. All dollar values assume reinvestment of the pre-tax value of dividends paid by companies, where applicable, included in the peer group. Historical stock performance is not necessarily indicative of future stock performance. This Insurance Peer Group TSR is not the same group as the Performance Peer Financials Group used by the Committee to determine performance-based compensation awards or the Compensation Peer Group used by the Committee as a reference for compensation program design. See Compensation of Named Executive Officers, Compensation Discussion and Analysis, Benchmarking and Peer Group beginning on Page 27 for more information about the Committee's selection and use of these Peer Groups in making compensation decisions. |
| 3. | CAP reflects the exclusions and inclusions of certain amounts for the CEO and the Other NEOs as set forth below. Equity values are calculated in accordance with FASB ASC Topic 718. Amounts in the Exclusion of Stock Awards column are the totals from the Stock Awards columns set forth in the Summary Compensation Table for the listed year. |
Summary | Exclusion of | Inclusion of | Compensation | |||||
Compensation | Stock Awards for | Equity Values | Actually Paid To | |||||
Total for CEO | CEO | for CEO | CEO | |||||
Year | | ($) | | ($) | | ($) | | ($) |
2025 | 4,187,838 | (1,100,000) | 723,066 | 3,810,904 | ||||
2024 |
| 3,679,625 | (1,100,000) | 695,308 |
| 3,274,933 | ||
2023 |
| 1,962,783 |
| (1,000,000) |
| (298,160) |
| 664,623 |
2022 |
| 2,753,190 |
| (900,000) |
| 668,135 |
| 2,521,325 |
2021 |
| 3,236,556 |
| (800,000) |
| 1,207,509 |
| 3,644,065 |
Year-End | Change In | |||||||||||
Fair Value | Fair Value | |||||||||||
Of Equity | Change In | From Last Day | ||||||||||
Awards | Fair Value | Vesting Date | Of Prior Year | |||||||||
Granted | From Last Day | Fair Value Of | To Vesting | Fair Value At | ||||||||
During Year | Of Prior Year | Equity Awards | Date Of | Last Day Of | ||||||||
That Remained | To Last Day Of | Granted | Unvested | Prior Year Of | ||||||||
Unvested | Year Of | During Year | Equity Awards | Equity Awards | Total | |||||||
As Of Last Day | Unvested | That Vested | That Vested | Forfeited | Inclusion of | |||||||
Of Year For | Equity Awards | During Year | During Year | During Year | Equity Values | |||||||
CEO | For CEO | For CEO | For CEO | For CEO | for CEO | |||||||
Year | | ($) | | ($) | | ($) | | ($) | | ($) | | ($) |
2025 | 925,181 | (169,445) | - | (32,670) | - | 723,066 | ||||||
2024 |
| 835,206 | 62,010 | - | (201,907) |
| - |
| 695,308 | |||
2023 |
| 513,326 |
| (716,501) |
| - |
| (94,985) |
| - |
| (298,160) |
2022 |
| 868,509 |
| (116,686) |
| - |
| (83,688) |
| - |
| 668,135 |
2021 |
| 1,142,299 |
| 88,148 |
| - |
| (22,938) |
| - |
| 1,207,509 |
| 3. | CAP reflects the exclusions and inclusions of certain amounts for the CEO and the Other NEOs as set forth below. Equity values are calculated in accordance with FASB ASC Topic 718. Amounts in the Exclusion of Stock Awards column are the totals from the Stock Awards columns set forth in the Summary Compensation Table for the listed year. |
Average | Average | Average | ||||||
Summary | Exclusion of | Inclusion of | Average | |||||
Compensation | Stock Awards | Equity Values | Compensation | |||||
Total for | for | for | Actually Paid | |||||
Other NEOs | Other NEOs | Other NEOs | to Other NEOs | |||||
Year | ($) | | ($) | | ($) | | ($) | |
2025 | 1,319,467 | (387,500) | 251,059 | 1,183,027 | ||||
2024 |
| 1,223,190 | (187,500) |
| 259,704 |
| 1,295,394 | |
2023 |
| 831,208 |
| (381,250) |
| (172,046) |
| 277,912 |
2022 |
| 1,100,348 |
| (375,000) |
| 272,449 |
| 997,797 |
2021 |
| 1,245,166 |
| (381,250) |
| 572,782 |
| 1,436,698 |
Average | ||||||||||||
Year-End | Average Change | |||||||||||
Fair Value Of | Average Change | Average | In Fair Value | |||||||||
Equity Awards | In Fair Value | Vesting Date | From Last Day | Average | ||||||||
Granted During | From Last Day | Fair Value | Of Prior Year | Fair Value | ||||||||
Year That | Of Prior Year | Of Equity Awards | To Vesting Date | At Last Day Of | Total - | |||||||
Remained | To Last Day | Granted During | Of Unvested | Prior Year Of | Average | |||||||
Unvested As Of | Of Year Of | Year That Vested | Equity Awards | Equity Awards | Inclusion Of | |||||||
Last Day | Unvested Equity | During Year | That Vested | Forfeited | Equity Values | |||||||
Of Year For | Awards For | For | During Year For | During Year For | For | |||||||
Other NEOs | Other NEOs | Other NEOs | Other NEOs | Other NEOs | Other NEOs | |||||||
Year | | ($) | | ($) | | ($) | | ($) | | ($) | | ($) |
2025 | 325,922 | (62,249) | - | (12,614) | - | 251,059 | ||||||
2024 |
| 303,737 | 27,162 | - | (71,195) | - |
| 259,704 | ||||
2023 |
| 195,697 |
| (325,494) | - | (42,249) |
| - |
| (172,046) | ||
2022 |
| 361,820 |
| (55,434) | - | (33,937) |
| - |
| 272,449 | ||
2021 |
| 544,437 |
| 37,131 | - | (8,786) |
| - |
| 572,782 |
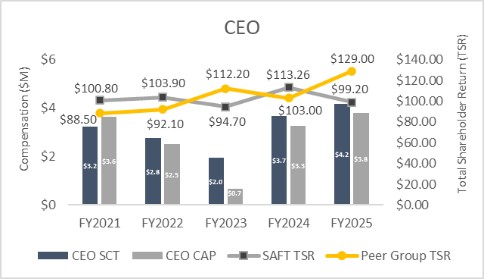
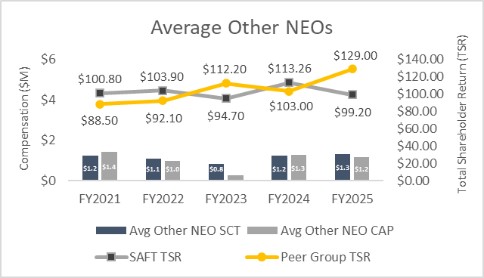
CAP and Cumulative TSR
As shown in the charts below, the CEO and Other NEOs’ CAP amounts are aligned with the Company’s TSR. This is due primarily to the company's use of equity incentives, which are tied directly to stock price in addition to the company’s financial performance. As described in more detail in Compensation of Named Executive Officers, Compensation Discussion and Analysis, Long-Term Incentive beginning on Page 25, the Committee selected 3-year TSR relative to the Performance Peer Group as the performance objective for performance-based restricted stock awards that were granted in the listed years. The same measure also applied to performance-based restricted stock awards that vested during the listed years.
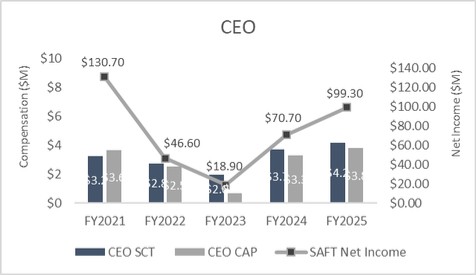
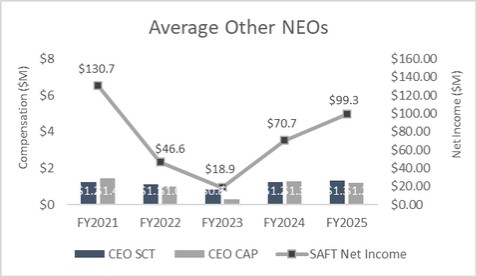
CAP and Net Income
As shown in the charts below, the Company’s net income has varied significantly in the years presented. This is due in large part to the inclusion of the change in fair value in our equity portfolio in the net income calculation in accordance with FASB, Accounting Standards Update (ASU) 2016-01, Financial Instruments - Overall (Subtopic 825-10) - Recognition and Measurement of Financial Assets and Financial Liabilities. Stock market volatility throughout the period also affected the valuations of outstanding equity incentives.
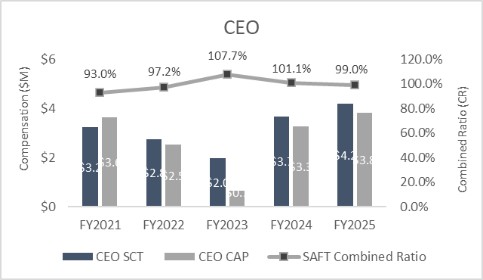
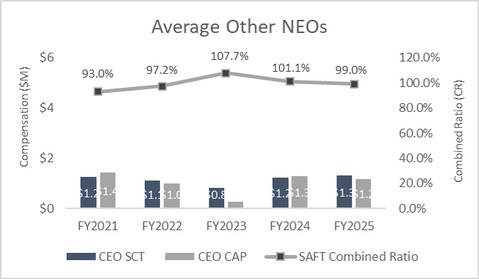
CAP and Combined Ratio
The charts below show the CEO and Other NEOs’ CAP amounts compared to the company's Combined Ratio. As described in more detail in Compensation of Named Executive Officers, Compensation Discussion and Analysis, beginning on Page 18, the committee selected Combined Ratio relative to the Performance Peer Group targets as the performance objective for long-term incentive compensation awards that were granted in the listed years.
CAP and Cumulative TSR
As shown in the charts below, the CEO and Other NEOs’ CAP amounts are aligned with the Company’s TSR. This is due primarily to the company's use of equity incentives, which are tied directly to stock price in addition to the company’s financial performance. As described in more detail in Compensation of Named Executive Officers, Compensation Discussion and Analysis, Long-Term Incentive beginning on Page 25, the Committee selected 3-year TSR relative to the Performance Peer Group as the performance objective for performance-based restricted stock awards that were granted in the listed years. The same measure also applied to performance-based restricted stock awards that vested during the listed years.
The principal financial metrics that we use to link compensation actually paid to our performance for 2025, are as follows:
Financial Performance Measures | |||||||||||
Earnings Before Interest, Taxes, Changes in Unrealized Gains and Losses on Equity Securities and Credit Loss Expense | |||||||||||
Combined Ratio | |||||||||||
Relative Total Shareholder Return |
| 5. | For 2025, we determined Combined Ratio to be the most important financial performance measure used to link company performance to CAP for our CEO and Other NEOs in 2025 and 2024. This performance measure may not have been the most important financial performance measure for years 2023 and 2022, and we may determine a different financial performance measure to be the most important financial performance measure in future years. |