v3.26.1
Pay vs Performance Disclosure - USD ($)
12 Months Ended
Dec. 31, 2025
Dec. 31, 2024
Dec. 31, 2023
Dec. 31, 2022
Dec. 31, 2021
Pay vs Performance Disclosure          
Pay vs Performance Disclosure, Table

The following table shows the relationship between executive compensation actually paid to our Principal Executive Officer (“PEO”) and other NEOs, including our Chief Financial Officer, Chief Scientific Officer and Laboratory Director, and President and Chief Operating Officer (“Non-PEO NEOs”), and certain financial performance of the Company during the last five fiscal years ended December 31, 2025, 2024, 2023, 2022, and 2021.

Year

Summary Compensation Table Total for PEO


Compensation Actually Paid to PEO


Average Summary Compensation Table Total for Non-PEO NEOs


Average Compensation Actually Paid to Non-PEO NEOs


Value of Initial Fixed $100 Investment Based On:


Net Income


Total Revenue


Total Share-holder Return


Peer Group Total Share-holder Return


($)


($)


($)


($)


($)


($)


($ Millions)


($ Millions)


(a)

(b) (1)


(c) (2)


(d) (3)


(e) (4)


(f) (5)


(g) (6)


(h) (7)


(i) (8)


2025


6,207,000


9,488,033


2,644,420


4,032,850


50


120


(60.5

)


322.7


2024


6,128,000


4,064,580


2,237,139


1,334,343


35


91


(42.7

)


283.5


2023


5,309,167


5,035,476


1,687,019


1,715,482


55


92


(167.8

)


289.2


2022


5,233,873


3,448,273


3,829,640


(2,733,189

)


57


89


143.4


619.0


2021


5,664,303


5,664,303


758,236


6,545,715


193


99


507.4


992.6


Footnotes:

(1)
The dollar amounts reported in column (b) are the amounts of total compensation reported for Ming Hsieh, our Chief Executive Officer (our PEO), for each corresponding year in the “Total” column of the Summary Compensation Table.
(2)
The dollar amounts reported in column (c) represent the amount of compensation actually paid (“CAP”) to Mr. Hsieh, as computed in accordance with SEC rules. The dollar amounts do not reflect the actual amount of compensation earned by or paid to Mr. Hsieh during the applicable year.

In accordance with SEC rules, the following adjustments were made to Mr. Hsieh’s total compensation for each year to determine CAP:


Footnote (2) - Table 1


Year

Reported Summary Compensation Table Total for PEO


Reported Value of Equity Awards


Equity Award Adjustments


Compensation Actually Paid to PEO


($)


($)


($)


($)


(a)

(b)


(c) (i)


(d) (ii)


(e)


2025


6,207,000


4,000,000


7,281,033


9,488,033


2024


6,128,000


4,000,000


1,936,580


4,064,580


2023


5,309,167


3,000,000


2,726,309


5,035,476


2022


5,233,873


3,572,400


1,786,800


3,448,273


2021


5,664,303


5,664,303


i.
The grant date fair value of equity awards in column (c) of Footnote (2) - Table 1 represents the total of the amounts reported in the “Stock Awards” column in the Summary Compensation Table for the applicable year.
ii.
The equity award adjustments in column (d) of Footnote (2) - Table 1 include the addition (or subtraction, as applicable) of the following: (1) the year-end fair value of any equity awards granted in the applicable year that are outstanding and unvested as of the end of the year; (2) the amount of change as of the end of the applicable year (from the end of the prior fiscal year) in fair value of any awards granted in prior years that are outstanding and unvested as of the end of the applicable year; and (3) for awards granted in prior years that vest in the applicable year, the amount equal to the change as of the vesting date (from the end of the prior fiscal year) in fair value. The valuation assumptions used to calculate fair values did not materially differ from those disclosed at the time of grant. The amounts deducted or added in calculating the equity award adjustments are as follows:


Footnote (2) - Table 2


Year

Year End Fair Value of Equity Awards Granted During the Year that Remained Unvested


Year over Year Change in Fair Value of Equity Awards Granted in Prior Years that Remained Unvested


Fair Value as of Vesting Date of Equity Awards Granted and Vested in the Year


Year over Year Change in Fair Value of Equity Awards Granted in Prior Years that Vested in the Year


Fair Value at the End of the Prior Year of Equity Awards that Failed to Meet Vesting Conditions in the Year


Value of Dividends or other Earnings Paid on Stock or Option Awards not Otherwise Reflected in Fair Value or Total Compensation


Total Equity Award Adjustments


($)


($)


($)


($)


($)


($)


($)


(a)

(b)


(c)


(d)


(e)


(f)


(g)


(h)


2025


6,450,572


882,788


(52,327

)


7,281,033


2024


3,045,334


(718,710

)


(390,043

)


1,936,580


2023


2,740,263


(32,625

)


89,667


(70,996

)


2,726,309


2022


1,786,800


1,786,800


2021


(3)
The dollar amounts reported in column (d) represent the average of the amounts reported for the Company’s NEOs as a group (excluding the Company’s PEO) in the “Total” column of the Summary Compensation Table in each applicable year. The names of each of the NEOs (excluding the Company’s PEO) included for purposes of calculating the average amounts in each applicable year are as follows: Paul Kim, our Chief Financial Officer, Hanlin Gao, our Chief Scientific Officer and Laboratory Director, and Jian Xie, our President and Chief Operating Officer, for 2021, 2022, 2023, 2024, and 2025.
(4)
The dollar amounts reported in column (e) represent the average amount of CAP to the NEOs as a group (excluding the Company’s PEO), as computed in accordance with SEC rules. The dollar amounts do not reflect the actual average amount of compensation earned by or paid to the NEOs as a group (excluding the Company’s PEO) during the applicable year.

In accordance with the SEC rules, the following adjustments were made to average total compensation for the NEOs as a group (excluding the Company’s PEO) for each year to determine the CAP, using the same methodology described above in Footnote 2:

Footnote (4) - Table 1


Year

Average Reported Summary Compensation Table Total for Non-PEO NEOs


Average Reported Value of Equity Awards


Average Equity Award Adjustments


Average Compensation Actually Paid to Non-PEO NEOs


($)


($)


($)


($)


(a)

(b)


(c)


(d) (i)


(e)


2025


2,644,420


1,728,000


3,116,431


4,032,850


2024


2,237,139


1,440,000


537,204


1,334,343


2023


1,687,019


864,000


892,463


1,715,482


2022


3,829,640


3,115,000


(3,447,829

)


(2,733,189

)

2021


758,236


89,857


5,877,336


6,545,715


i.
The amounts deducted or added in calculating the total average equity award adjustments are as follows:


Footnote (4) - Table 2


Year

Average Year End Fair Value of Equity Awards Granted During the Year that Remained Unvested


Year over Year Average Change in Fair Value of Equity Awards Granted in Prior Years that Remained Unvested


Average Fair Value as of Vesting Date of Equity Awards Granted and Vested in the Year


Year over Year Average Change in Fair Value of Equity Awards Granted in Prior Years that Vested in the Year


Average Fair Value at the End of the Prior Year of Equity Awards that Failed to Meet Vesting Conditions in the Year


Average Value of Dividends or other Earnings Paid on Stock or Option Awards not Otherwise Reflected in Fair Value or Total Compensation


Total Average Equity Award Adjustments


($)


($)


($)


($)


($)


($)


($)


(a)

(b)


(c)


(d)


(e)


(f)


(g)


(h)


2025


2,786,652


322,319


7,460


3,116,431


2024


1,096,324


(299,444

)


(259,676

)


537,204


2023


789,185


(37,573

)


166,402


(25,551

)


892,463


2022


1,489,000


(3,304,514

)


(1,632,315

)


(3,447,829

)

2021


117,355


3,904,479


1,855,502


5,877,336


(5)
The cumulative total stockholder return (“TSR”) amounts reported in column (f) are calculated in the same manner as required under Item 201(e) of Regulation S-K, measuring the total stockholder return from the market close on the last trading day before the earliest fiscal year in the table, or December 31, 2020, through to and including the end of the fiscal year for which total stockholder return is calculated, or December 31, 2025.
(6)
The weighted peer group TSR amounts reported in column (g) reflect the Company’s peer group (NASDAQ Biotechnology Index) as reflected in our Annual Report pursuant to Item 201(e) of Regulation S-K for the fiscal year ended December 31, 2025. Each year reflects what the cumulative value of $100 would be, including the reinvestment of dividends, if such amount were invested as of market close on December 31, 2020.
(7)
The dollar amounts reported in column (h) are the Company’s net income amounts reflected in the Company’s audited financial statements for the applicable year.
(8)
While the Company uses numerous financial and non-financial performance measures for the purpose of evaluating performance for the Company’s compensation programs, the Company has determined that revenue is the financial performance measure that, in the Company’s assessment, represents the most important performance measure (that is not otherwise required to be disclosed in the Pay Versus Performance Table) used by the company to link compensation actually paid to the Company’s NEOs, for the most recently completed fiscal year, to company performance. The dollar amounts reported in column (i) are the Company’s revenue amounts reflected in the Company’s audited financial statements for the applicable year.
       
Company Selected Measure Name Total Revenue        
Named Executive Officers, Footnote
(1)
The dollar amounts reported in column (b) are the amounts of total compensation reported for Ming Hsieh, our Chief Executive Officer (our PEO), for each corresponding year in the “Total” column of the Summary Compensation Table.
       
Peer Group Issuers, Footnote
(6)
The weighted peer group TSR amounts reported in column (g) reflect the Company’s peer group (NASDAQ Biotechnology Index) as reflected in our Annual Report pursuant to Item 201(e) of Regulation S-K for the fiscal year ended December 31, 2025. Each year reflects what the cumulative value of $100 would be, including the reinvestment of dividends, if such amount were invested as of market close on December 31, 2020.
       
PEO Total Compensation Amount $ 6,207,000 $ 6,128,000 $ 5,309,167 $ 5,233,873 $ 5,664,303
PEO Actually Paid Compensation Amount $ 9,488,033 4,064,580 5,035,476 3,448,273 5,664,303
Adjustment To PEO Compensation, Footnote
(2)
The dollar amounts reported in column (c) represent the amount of compensation actually paid (“CAP”) to Mr. Hsieh, as computed in accordance with SEC rules. The dollar amounts do not reflect the actual amount of compensation earned by or paid to Mr. Hsieh during the applicable year.

In accordance with SEC rules, the following adjustments were made to Mr. Hsieh’s total compensation for each year to determine CAP:


Footnote (2) - Table 1


Year

Reported Summary Compensation Table Total for PEO


Reported Value of Equity Awards


Equity Award Adjustments


Compensation Actually Paid to PEO


($)


($)


($)


($)


(a)

(b)


(c) (i)


(d) (ii)


(e)


2025


6,207,000


4,000,000


7,281,033


9,488,033


2024


6,128,000


4,000,000


1,936,580


4,064,580


2023


5,309,167


3,000,000


2,726,309


5,035,476


2022


5,233,873


3,572,400


1,786,800


3,448,273


2021


5,664,303


5,664,303


i.
The grant date fair value of equity awards in column (c) of Footnote (2) - Table 1 represents the total of the amounts reported in the “Stock Awards” column in the Summary Compensation Table for the applicable year.
ii.
The equity award adjustments in column (d) of Footnote (2) - Table 1 include the addition (or subtraction, as applicable) of the following: (1) the year-end fair value of any equity awards granted in the applicable year that are outstanding and unvested as of the end of the year; (2) the amount of change as of the end of the applicable year (from the end of the prior fiscal year) in fair value of any awards granted in prior years that are outstanding and unvested as of the end of the applicable year; and (3) for awards granted in prior years that vest in the applicable year, the amount equal to the change as of the vesting date (from the end of the prior fiscal year) in fair value. The valuation assumptions used to calculate fair values did not materially differ from those disclosed at the time of grant. The amounts deducted or added in calculating the equity award adjustments are as follows:


Footnote (2) - Table 2


Year

Year End Fair Value of Equity Awards Granted During the Year that Remained Unvested


Year over Year Change in Fair Value of Equity Awards Granted in Prior Years that Remained Unvested


Fair Value as of Vesting Date of Equity Awards Granted and Vested in the Year


Year over Year Change in Fair Value of Equity Awards Granted in Prior Years that Vested in the Year


Fair Value at the End of the Prior Year of Equity Awards that Failed to Meet Vesting Conditions in the Year


Value of Dividends or other Earnings Paid on Stock or Option Awards not Otherwise Reflected in Fair Value or Total Compensation


Total Equity Award Adjustments


($)


($)


($)


($)


($)


($)


($)


(a)

(b)


(c)


(d)


(e)


(f)


(g)


(h)


2025


6,450,572


882,788


(52,327

)


7,281,033


2024


3,045,334


(718,710

)


(390,043

)


1,936,580


2023


2,740,263


(32,625

)


89,667


(70,996

)


2,726,309


2022


1,786,800


1,786,800


2021


Non-PEO NEO Average Total Compensation Amount $ 2,644,420 2,237,139 1,687,019 3,829,640 758,236
Non-PEO NEO Average Compensation Actually Paid Amount $ 4,032,850 1,334,343 1,715,482 (2,733,189) 6,545,715
Adjustment to Non-PEO NEO Compensation Footnote
(4)
The dollar amounts reported in column (e) represent the average amount of CAP to the NEOs as a group (excluding the Company’s PEO), as computed in accordance with SEC rules. The dollar amounts do not reflect the actual average amount of compensation earned by or paid to the NEOs as a group (excluding the Company’s PEO) during the applicable year.

In accordance with the SEC rules, the following adjustments were made to average total compensation for the NEOs as a group (excluding the Company’s PEO) for each year to determine the CAP, using the same methodology described above in Footnote 2:

Footnote (4) - Table 1


Year

Average Reported Summary Compensation Table Total for Non-PEO NEOs


Average Reported Value of Equity Awards


Average Equity Award Adjustments


Average Compensation Actually Paid to Non-PEO NEOs


($)


($)


($)


($)


(a)

(b)


(c)


(d) (i)


(e)


2025


2,644,420


1,728,000


3,116,431


4,032,850


2024


2,237,139


1,440,000


537,204


1,334,343


2023


1,687,019


864,000


892,463


1,715,482


2022


3,829,640


3,115,000


(3,447,829

)


(2,733,189

)

2021


758,236


89,857


5,877,336


6,545,715


i.
The amounts deducted or added in calculating the total average equity award adjustments are as follows:


Footnote (4) - Table 2


Year

Average Year End Fair Value of Equity Awards Granted During the Year that Remained Unvested


Year over Year Average Change in Fair Value of Equity Awards Granted in Prior Years that Remained Unvested


Average Fair Value as of Vesting Date of Equity Awards Granted and Vested in the Year


Year over Year Average Change in Fair Value of Equity Awards Granted in Prior Years that Vested in the Year


Average Fair Value at the End of the Prior Year of Equity Awards that Failed to Meet Vesting Conditions in the Year


Average Value of Dividends or other Earnings Paid on Stock or Option Awards not Otherwise Reflected in Fair Value or Total Compensation


Total Average Equity Award Adjustments


($)


($)


($)


($)


($)


($)


($)


(a)

(b)


(c)


(d)


(e)


(f)


(g)


(h)


2025


2,786,652


322,319


7,460


3,116,431


2024


1,096,324


(299,444

)


(259,676

)


537,204


2023


789,185


(37,573

)


166,402


(25,551

)


892,463


2022


1,489,000


(3,304,514

)


(1,632,315

)


(3,447,829

)

2021


117,355


3,904,479


1,855,502


5,877,336


Compensation Actually Paid vs. Total Shareholder Return

img4783984_7.gif

       
Compensation Actually Paid vs. Company Selected Measure

img4783984_5.gifimg4783984_6.gif

       
Total Shareholder Return Vs Peer Group

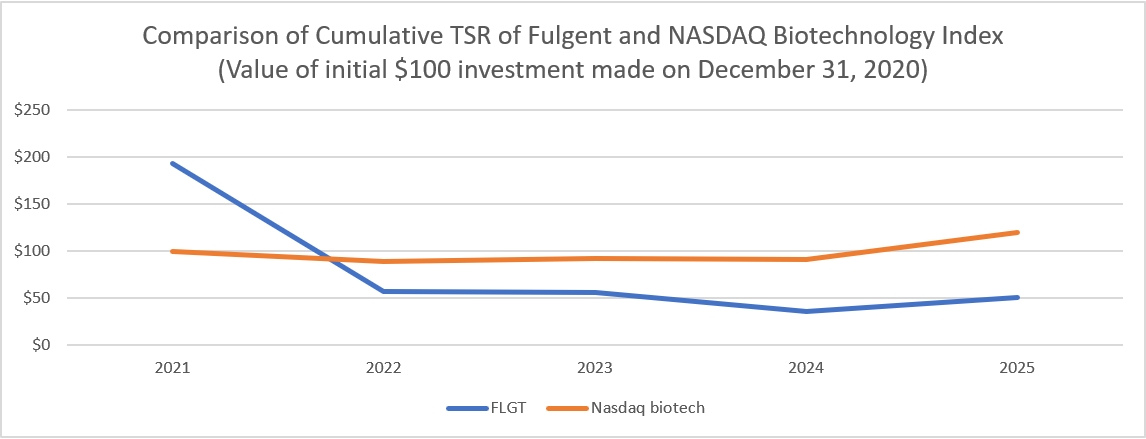
The following graph compares our cumulative TSR over the five most recently completed fiscal years to that of the NASDAQ Biotechnology Index (“Index”) over the same period.

img4783984_4.jpg

       
Tabular List, Table

The most important financial performance measures used by the Company to link executive compensation actually paid to the Company’s NEOs, for the most recently completed fiscal year, to the Company’s performance are as follows:

(1)
Revenue
(2)
EBITDA
(3)
Total Stockholder Return
(4)
Earnings Per Share
(5)
Adjusted EBITDA (1)
(1)
Adjusted EBITDA is GAAP income (loss) plus or minus interest (expense) income, plus or minus provisions (benefits) for income taxes, plus goodwill impairment loss, plus acquisition-related costs, plus equity-based compensation expenses, plus depreciation and amortization, plus impairment loss of investments, plus insurance expense related to transferable tax credits, plus one-time professional liability expense, and plus or minus other charges or gains, as identified, that management believes are not representative of the Company’s operations.
       
Total Shareholder Return Amount $ 50 35 55 57 193
Peer Group Total Shareholder Return Amount 120 91 92 89 99
Net Income (Loss) $ (60,500,000) $ (42,700,000) $ (167,800,000) $ 143,400,000 $ 507,400,000
Company Selected Measure Amount 322,700,000 283,500,000 289,200,000 619,000,000 992,600,000
PEO Name Ming Hsieh Ming Hsieh Ming Hsieh Ming Hsieh Ming Hsieh
Measure:: 1          
Pay vs Performance Disclosure          
Name Revenue        
Measure:: 2          
Pay vs Performance Disclosure          
Name EBITDA        
Measure:: 3          
Pay vs Performance Disclosure          
Name Total Stockholder Return        
Measure:: 4          
Pay vs Performance Disclosure          
Name Earnings Per Share        
Measure:: 6          
Pay vs Performance Disclosure          
Name Adjusted EBITDA        
PEO | Aggregate Grant Date Fair Value of Equity Award Amounts Reported in Summary Compensation Table          
Pay vs Performance Disclosure          
Adjustment to Compensation, Amount $ (4,000,000) $ (4,000,000) $ (3,000,000) $ (3,572,400)  
PEO | Equity Awards Adjustments, Excluding Value Reported in Compensation Table          
Pay vs Performance Disclosure          
Adjustment to Compensation, Amount 7,281,033 1,936,580 2,726,309 1,786,800  
PEO | Year-end Fair Value of Equity Awards Granted in Covered Year that are Outstanding and Unvested          
Pay vs Performance Disclosure          
Adjustment to Compensation, Amount 6,450,572 3,045,334 2,740,263 1,786,800  
PEO | Year-over-Year Change in Fair Value of Equity Awards Granted in Prior Years That are Outstanding and Unvested          
Pay vs Performance Disclosure          
Adjustment to Compensation, Amount 882,788 (718,710) (32,625)    
PEO | Change in Fair Value as of Vesting Date of Prior Year Equity Awards Vested in Covered Year          
Pay vs Performance Disclosure          
Adjustment to Compensation, Amount (52,327) (390,043) 89,667    
PEO | Prior Year End Fair Value of Equity Awards Granted in Any Prior Year that Fail to Meet Applicable Vesting Conditions During Covered Year          
Pay vs Performance Disclosure          
Adjustment to Compensation, Amount     (70,996)    
Non-PEO NEO | Aggregate Grant Date Fair Value of Equity Award Amounts Reported in Summary Compensation Table          
Pay vs Performance Disclosure          
Adjustment to Compensation, Amount (1,728,000) (1,440,000) (864,000) (3,115,000) $ (89,857)
Non-PEO NEO | Equity Awards Adjustments, Excluding Value Reported in Compensation Table          
Pay vs Performance Disclosure          
Adjustment to Compensation, Amount 3,116,431 537,204 892,463 (3,447,829) 5,877,336
Non-PEO NEO | Year-end Fair Value of Equity Awards Granted in Covered Year that are Outstanding and Unvested          
Pay vs Performance Disclosure          
Adjustment to Compensation, Amount 2,786,652 1,096,324 789,185 1,489,000 117,355
Non-PEO NEO | Year-over-Year Change in Fair Value of Equity Awards Granted in Prior Years That are Outstanding and Unvested          
Pay vs Performance Disclosure          
Adjustment to Compensation, Amount 322,319 (299,444) (37,573) (3,304,514) 3,904,479
Non-PEO NEO | Change in Fair Value as of Vesting Date of Prior Year Equity Awards Vested in Covered Year          
Pay vs Performance Disclosure          
Adjustment to Compensation, Amount $ 7,460 $ (259,676) 166,402 $ (1,632,315) $ 1,855,502
Non-PEO NEO | Prior Year End Fair Value of Equity Awards Granted in Any Prior Year that Fail to Meet Applicable Vesting Conditions During Covered Year          
Pay vs Performance Disclosure          
Adjustment to Compensation, Amount     $ (25,551)