On April 28, 2025, the shareholders of Tortoise Energy Infrastructure Total Return Fund, a series of Managed Portfolio Series, a Delaware statutory trust that is registered as an open-end management investment company (the “Predecessor Fund”), approved an Agreement and Plan of Reorganization (the “Plan”) by and between Managed Portfolio Series, on behalf of the Predecessor Fund, and Tortoise Capital Series Trust (the “Trust”), on behalf of the Fund, pursuant to which the Predecessor Fund would be reorganized through an asset and liabilities acquisition into the Fund (the “Reorganization”). The Reorganization was completed on May 9, 2025. As a result of the Reorganization, the Fund has assumed the performance history of the Predecessor Fund.
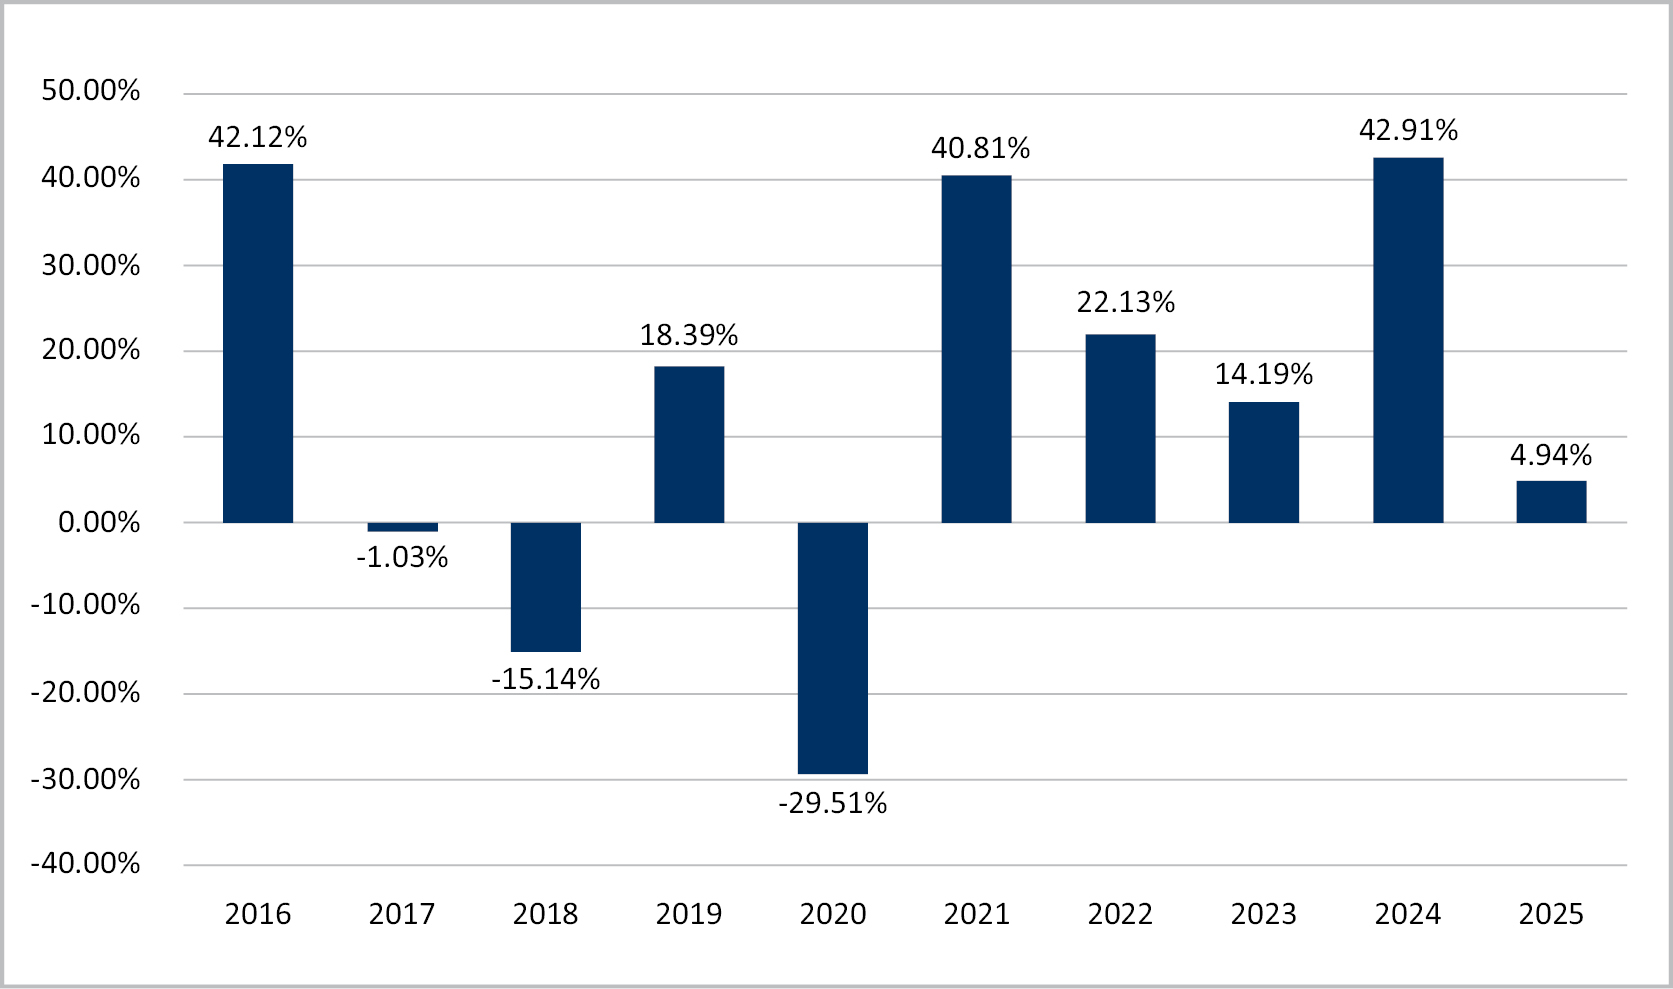
The accompanying bar chart and table provide some indication of the risks of investing in the Fund. The bar chart shows the changes in the Fund’s annual total returns from year to year. Following the bar chart is the Fund’s highest and lowest quarterly returns during the periods shown in the bar chart. The table illustrates how the Fund’s average annual returns for the 1-year, 5-year, 10-year and since-inception periods compare with those of a broad measure of market performance. Fund returns shown in the performance table reflect the maximum sales charge of 5.50% for the Fund’s A Class and the contingent deferred sales charge of 1.00% during the one-year period for the C Class. Past performance (before and after taxes) will not necessarily continue in the future.
Updated information on the Fund’s results can be obtained by visiting www.tortoisecapital.com or by calling toll-free at (844) 874-6339.
____________
(1) Fund’s calendar year-to-date total return based on net asset value for the period January 1, 2026 to February 28, 2026 was 18.9%.
During the periods shown in the chart above:
| Best Quarter | Worst Quarter | |||||
| Quarter Ended | 29.35% | Quarter Ended | -49.32% | |||
| Average Annual Total Returns for the Periods | 1 Year | 5 Years | 10 years | ||||||
| A Class (with load) |
|
|
| ||||||
| Return Before Taxes (based on NAV) | -1.04 | % | 22.41 | % | 10.44 | % | |||
| Institutional Class |
|
|
| ||||||
| Return Before Taxes (no load based on NAV) | 4.94 | % | 24.11 | % | 11.36 | % | |||
| Return After Taxes on Distributions | 4.47 | % | 23.49 | % | 10.86 | % | |||
| Return After Taxes on Distributions and Sale of Fund Shares | 3.25 | % | 19.72 | % | 9.26 | % | |||
| C Class(2) (with load synthetic) |
|
|
| ||||||
| Return Before Taxes (based on NAV) | 2.87 | % | 22.85 | % | 10.26 | % | |||
| Index Performance |
|
|
| ||||||
| S&P 500® Index (reflects no deduction for fees, expenses or taxes) | 17.88 | % | 14.42 | % | 14.82 | % | |||
| Alerian Midstream Energy Select Index (reflects no deduction for fees, expenses or taxes)(3) | 6.58 | % | 24.26 | % | 12.70 | % | |||
| Tortoise North American Pipeline IndexSM (reflects no deduction for fees, expenses or taxes)(4) | 8.22 | % | 21.57 | % | 12.76 | % | |||
____________
(1) No returns are shown for T Class Shares since T Class Shares are not currently available for purchase. Average annual total returns for T Class Shares would have been substantially similar to those for other classes offered by the Fund because each class of shares would be invested in the same portfolio of securities, and the annual returns would differ only to the extent that the classes have different expenses.
(2) The Fund offers multiple classes of shares. The Institutional Class and A Class commenced operations on May 31, 2011 and C Class commenced operations on September 19, 2012. Performance shown prior to inception of the C Class is based on the performance of the Institutional Class, adjusted for the higher expenses applicable to C Class.
(3) The Alerian Midstream Energy Select Index is a composite of North American energy infrastructure companies engaged in midstream energy activities.
(4) The Tortoise North American Pipeline IndexSM is a float-adjusted, capitalization weighted index of pipeline companies headquartered in the United States and Canada.
After-tax returns in the above table are calculated using the historical highest individual federal marginal income tax rates and do not reflect the impact of state and local taxes. Actual after-tax returns depend on an investor’s tax situation and may differ from those shown, and after-tax returns shown are not relevant to investors who hold Shares through tax-advantaged arrangements, such as 401(k) plans or individual retirement accounts.
On June 26, 2025, the shareholders of the Fund approved an Agreement and Plan of Reorganization (the “Plan”) providing for the acquisition of all of the assets of Tortoise Global Water ESG Fund, a series of Managed Portfolio Series (the “Predecessor Fund” or the “Water Predecessor Fund”), by the Fund, a series of the Trust (the “Reorganization”). As a result of the Reorganization, the Fund has assumed the financial and performance history of the Predecessor Fund.
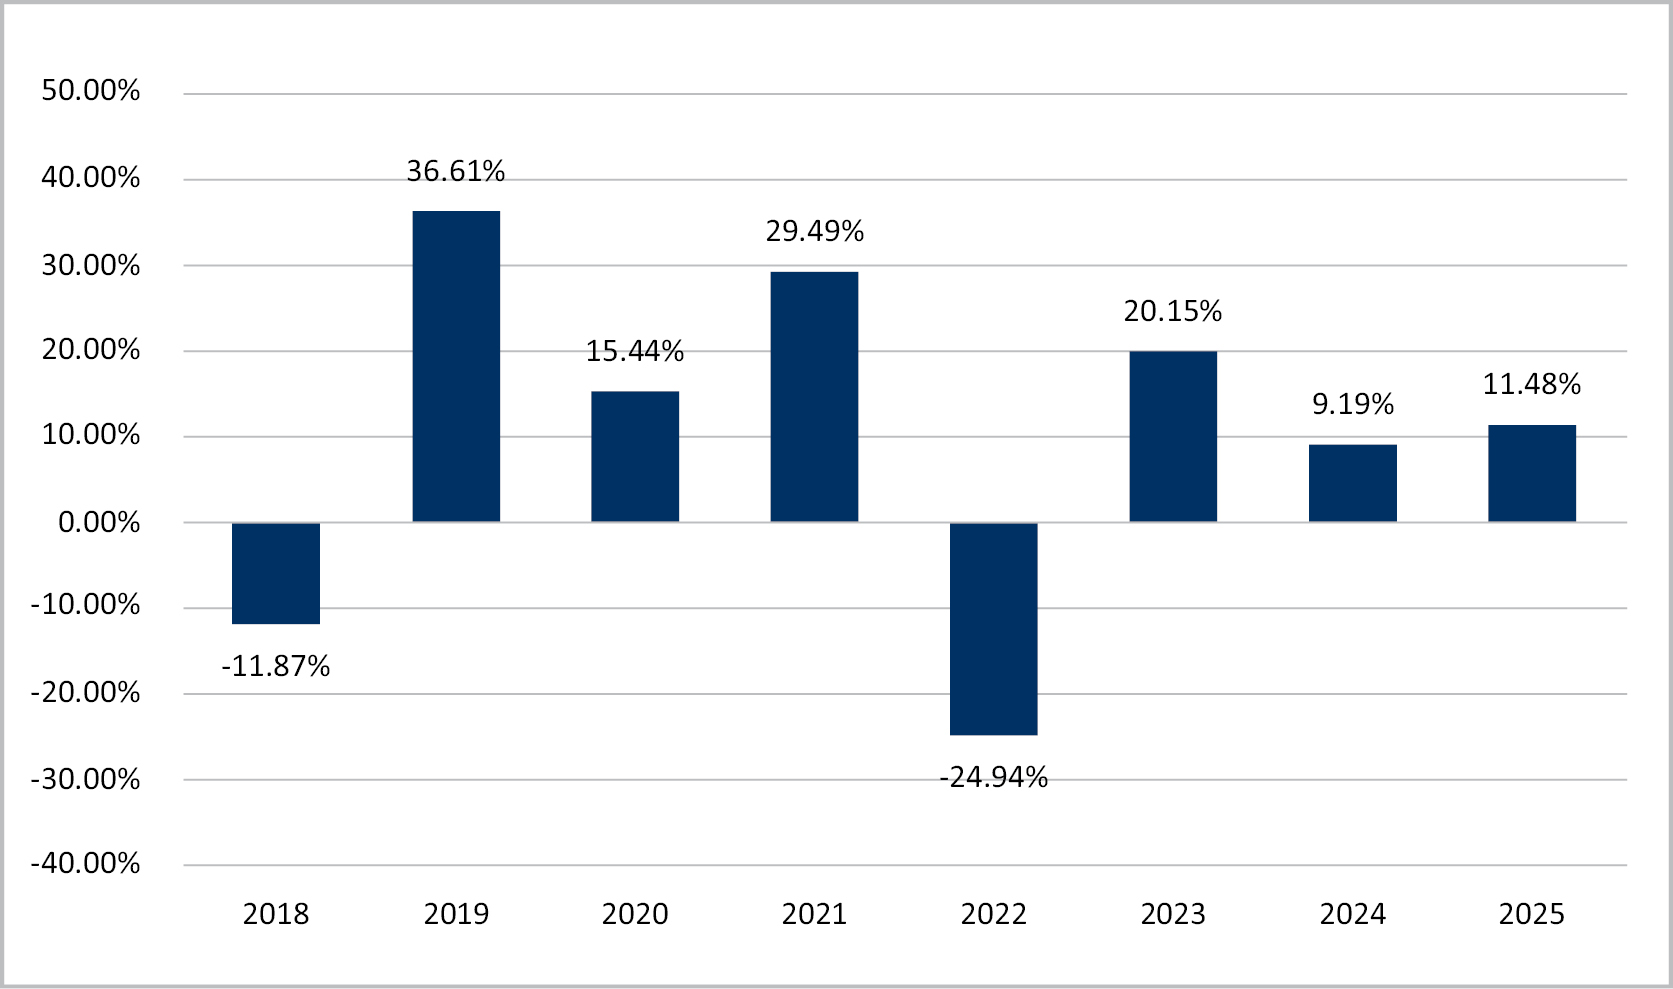
The accompanying bar chart and table provide some indication of the risks of investing in the Fund. The bar charts show the Fund’s and the Predecessor Fund’s performance for the calendar years ended December 31. The table illustrates how the Fund’s and the Predecessor Fund’s average annual returns for the 1-year, 5-year and since-inception periods compared with a broad measure
of market performance and the Underlying Index. Prior to June 15, 2018, the Predecessor Fund tracked a different underlying index. Performance shown prior to June 15, 2018 represents the performance of the Fund before the index change, and the performance shown in the bar chart and performance table for periods prior to July 11, 2025 represents the performance of the Predecessor Fund following the index change. The Underlying Index methodology was modified to remove ESG screening criteria following the Reorganization and the Underlying Index was rebalanced at the next regular rebalancing date to reflect these changes. The Fund’s and the Predecessor Fund’s past performance (before and after taxes) does not necessarily indicate how the Fund will perform in the future. The Fund adopted the financial statements and the performance history of the Predecessor Fund. Updated performance information is also available on the Fund’s website at www.tortoisecapital.com or by calling toll-free (855) 994-4437.
____________
(1) The Fund’s calendar year-to-date total return based on net asset value for the period January 1, 2026 to February 28, 2026 was 10.07%.
During the periods shown in the chart above:
| Best Quarter | Worst Quarter | |||||
| December 31, 2023 | 16.06% | March 31, 2020 | -20.44% | |||
| Average Annual Total Returns for the Periods | 1 Year | 5 Years | Since | ||||||
| Return Before Taxes (No Load) | 11.48 | % | 7.29 | % | 10.26 | % | |||
| Return After Taxes on Distributions | 10.41 | % | 6.78 | % | 9.79 | % | |||
| Return After Taxes on Distributions and Sale of Fund Shares (No Load) | 7.18 | % | 5.64 | % | 8.31 | % | |||
| Index Performance |
|
|
| ||||||
| S&P 500 Total Return Index (reflects no deduction for fees, expenses or taxes) | 17.88 | % | 14.42 | % | 14.78 | % | |||
| Tortoise Global Water Net Total Return IndexSM(1) (reflects no deduction for fees, expenses or taxes) | 11.60 | % | 7.49 | % | 10.81 | % | |||
| Tortoise TBLU Blend Index (reflects no deduction for fees, expenses or taxes) | 11.60 | % | 7.49 | % | 10.57 | % | |||
____________
(1) The Tortoise Global Water Net Total Return IndexSM (formerly known as Tortoise Global Water ESG Net Total Return Index) is a float-adjusted, capitalization weighted index of companies that are materially engaged in the water infrastructure or water management industries.
After-tax returns in the above table are calculated using the historical highest individual federal marginal income tax rates and do not reflect the impact of state and local taxes. Actual after-tax returns depend on an investor’s tax situation and may differ from those shown, and after-tax returns shown are not relevant to investors who hold shares through tax-advantaged arrangements, such as 401(k) plans or individual retirement.
On April 28, 2025, the shareholders of the Fund approved an Agreement and Plan of Reorganization (the “Plan”) providing for the acquisition of all of the assets of Tortoise North American Pipeline Fund (the “Predecessor Fund” or the “Pipeline Predecessor Fund”), a series of Managed Portfolio Series, by the Fund, a series of the Trust (the “Reorganization”). The Reorganization was completed on May 9, 2025. As a result of the Reorganization, the Fund has assumed the performance history of the Predecessor Fund.
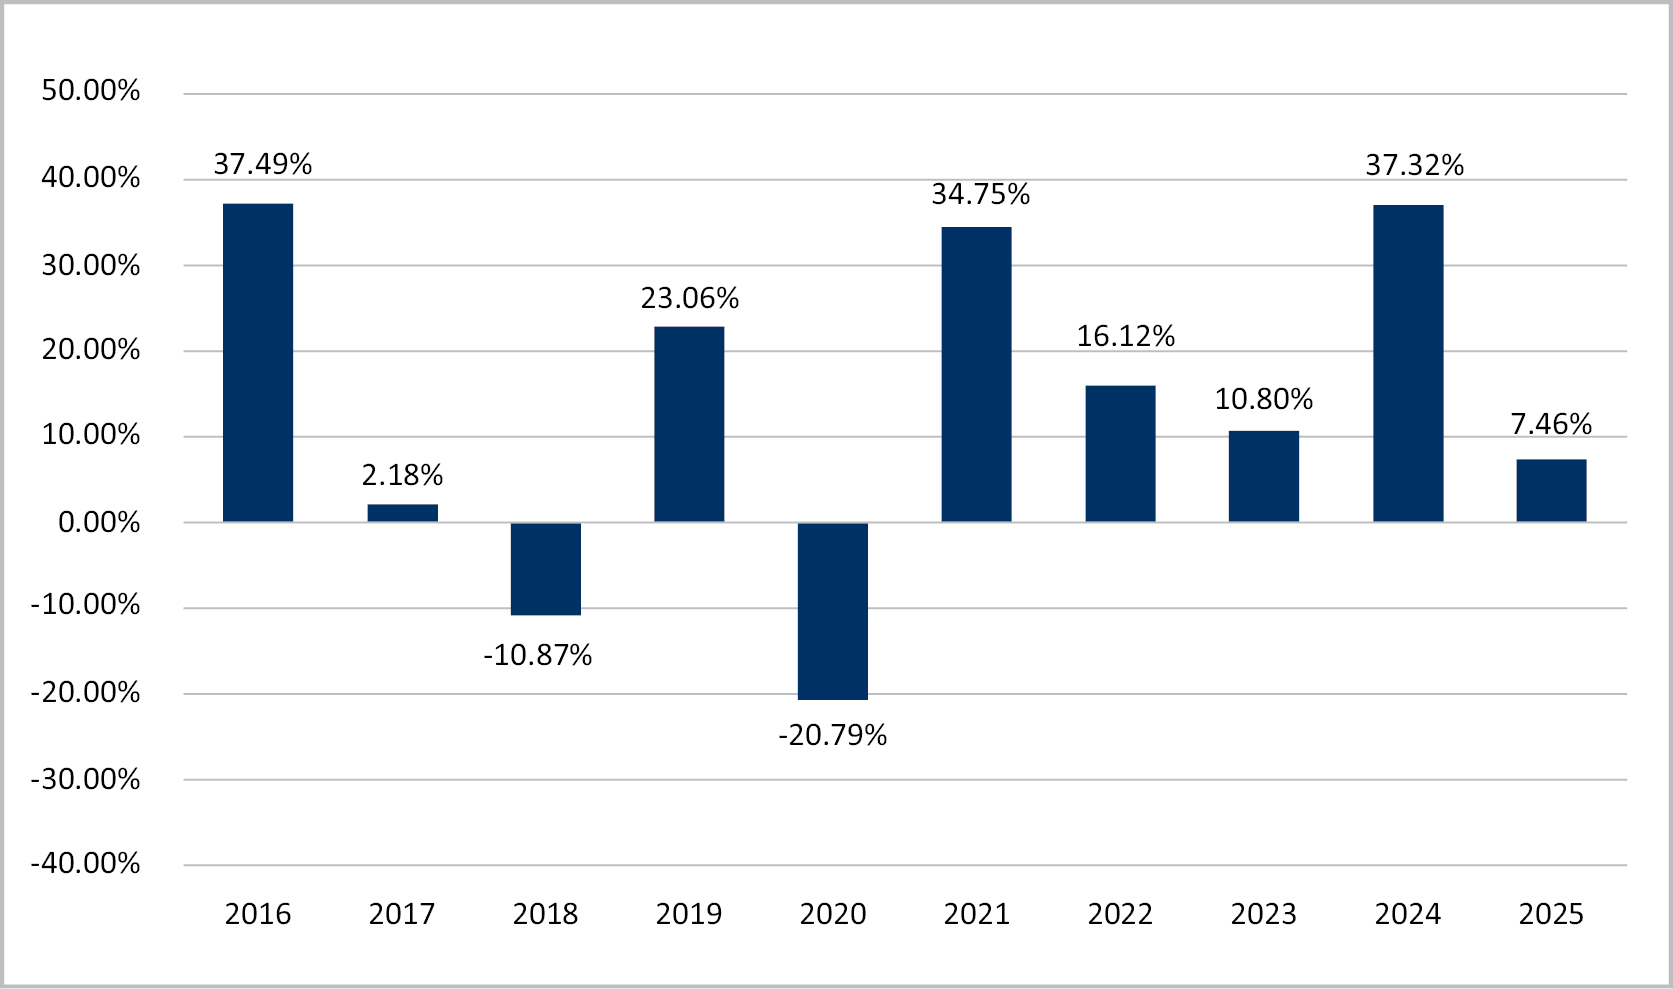
The accompanying bar chart and table provide some indication of the risks of investing in the Fund and the Predecessor Fund. The bar chart shows the Fund’s and the Predecessor Fund’s performance for the calendar years ended December 31. The table illustrates how the Fund’s average annual returns for the 1-year, 5-year and since-inception periods compared with a broad measure of market performance and the Underlying Index. On March 20, 2017, the assets of the Predecessor Fund, which had the same portfolio managers as the Fund and had identical investment strategies as the Fund, were transferred to the Fund in a tax-free reorganization. Performance shown for periods prior to May 9, 2025 represents the performance of the Predecessor Fund. The Fund’s and the Predecessor Fund’s past performance, before and after taxes, does not necessarily indicate how the Fund will perform in the future. The Fund adopted the financial statements and the performance history of the Predecessor Fund. Updated performance information is also available on the Fund’s website at www.tortoisecapital.com or by calling toll-free (855) 994-4437. The Predecessor Fund’s past performance (before and after taxes) is not necessarily an indication of how the Fund will perform in the future.
____________
(1) The Fund’s calendar year-to-date total return based on net asset value for the period January 1, 2026 to February 28, 2026 was 17.54%.
During the periods shown in the chart above:
| Best Quarter | Worst Quarter | |||||
| June 30, 2020 | 23.01% | March 31, 2020 | -40.54% | |||
| Average Annual Total Returns for the Periods | 1 Year | 5 Years | 10 Years | ||||||
| Performance |
|
|
| ||||||
| Return Before Taxes (No Load) | 7.46 | % | 20.67 | % | 12.06 | % | |||
| Return After Taxes on Distributions (No Load) | 6.86 | % | 19.92 | % | 11.32 | % | |||
| Return After Taxes on Distributions and Sale of Fund Shares (No Load) | 4.84 | % | 16.75 | % | 9.78 | % | |||
| Index Performance |
|
|
| ||||||
| S&P 500 Total Return Index (reflects no deduction for fees, expenses or taxes) | 17.88 | % | 14.42 | % | 14.82 | % | |||
| Tortoise North American Pipeline Total Return IndexSM (reflects no deduction for fees, expenses or taxes) | 8.22 | % | 21.57 | % | 12.76 | % | |||
After-tax returns in the above table are calculated using the historical highest individual federal marginal income tax rates and do not reflect the impact of state and local taxes. Actual after-tax returns depend on an investor’s tax situation and may differ from those shown, and after-tax returns shown are not relevant to investors who hold shares through tax-advantaged arrangements, such as 401(k) plans or individual retirement accounts.
No performance information is available for the Fund because it does not yet have a full calendar year of performance information.
On December 5, 2024, the stockholders of Tortoise Pipeline & Energy Fund, Inc., Tortoise Energy Independence Fund, Inc. and Tortoise Power and Energy Infrastructure Fund, Inc., each a Maryland corporation that is registered as a closed-end management investment company (the “Target Funds”), approved an Agreement and Plan of Merger (the “Plan”) by and between the Target Funds, and the Trust, on behalf of the Fund, pursuant to which each Target Fund would be merged with and into a wholly-owned subsidiary of the Fund (the “Mergers”). As a result of the Mergers, the Fund has assumed the performance history of Tortoise Power and Energy Infrastructure Fund, Inc. (the “Predecessor Fund”). Prior to the Mergers, the Predecessor Fund operated as a listed closed-end fund and had a greater flexibility to engage in leverage.
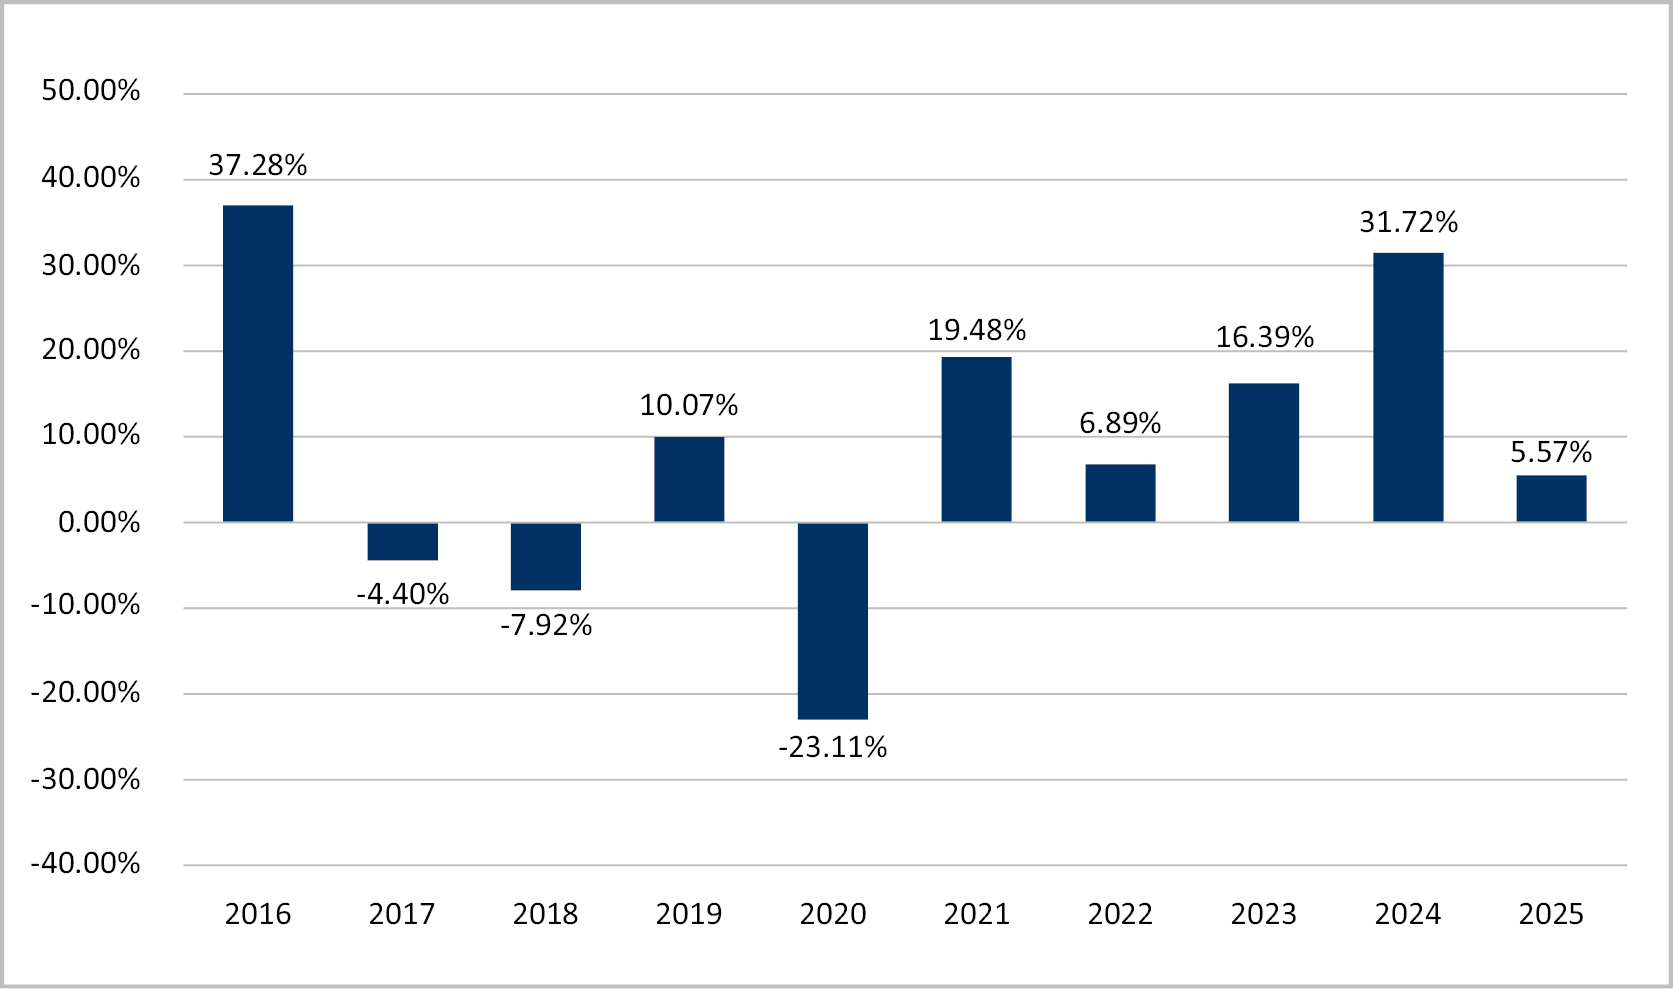
The accompanying bar chart and table provide some indication of the risks of investing in the Fund. The bar chart shows changes in the Fund’s annual total returns from year to year. Following the bar chart is the Fund’s highest and lowest quarterly returns during the periods shown in the bar chart. The table illustrates how the Fund’s average annual returns for the 1-year, 5-year and 10-year periods compare with those of a broad measure of market performance. Past performance (before and after taxes) will not necessarily continue in the future. The Fund’s past performance is not indicative of how the Fund will, or is expected to, perform in the future.
Updated information on the Fund’s results can be obtained by visiting www.tortoiseadvisors.com or by calling toll-free at 844-874-6339.
____________
(1) The Fund’s calendar year-to-date total return based on net asset value for the period January 1, 2026 to February 28, 2026 was 11.80%.
During the periods shown in the chart above:
| Best Quarter | Worst Quarter | |||||
| June 30, 2020 | 38.38% | March 31, 2020 | -51.94% | |||
| Average Annual Total Returns for the Periods | 1 Year | 5 Years | 10 Years | ||||||
| Performance |
|
|
| ||||||
| Return Before Taxes (No Load) | 5.57 | % | 15.63 | % | 7.77 | % | |||
| Return After Taxes on Distributions (No Load) | 5.25 | % | 14.83 | % | 6.11 | % | |||
| Return After Taxes on Distributions and Sale of Fund Shares (No Load) | 3.53 | % | 12.27 | % | 5.42 | % | |||
| Index Performance |
|
|
| ||||||
| 75% S&P 500 Energy 25% ICE BofA US High Yield Energy Index (reflects no deduction for fees, expenses or taxes) | 8.51 | % | 19.90 | % | 8.38 | % | |||
| S&P 500 Energy Sector Total Return Index (reflects no deduction for fees, expenses or taxes) | 8.67 | % | 23.78 | % | 8.32 | % | |||
| S&P 500 Total Return Index (reflects no deduction for fees, expenses or taxes) | 17.88 | % | 14.42 | % | 14.82 | % | |||
After-tax returns in the above table are calculated using the historical highest individual federal marginal income tax rates and do not reflect the impact of state and local taxes. Actual after-tax returns depend on an investor’s tax situation and may differ from those shown, and after-tax returns shown are not relevant to investors who hold shares through tax-advantaged arrangements, such as 401(k) plans or individual retirement accounts.
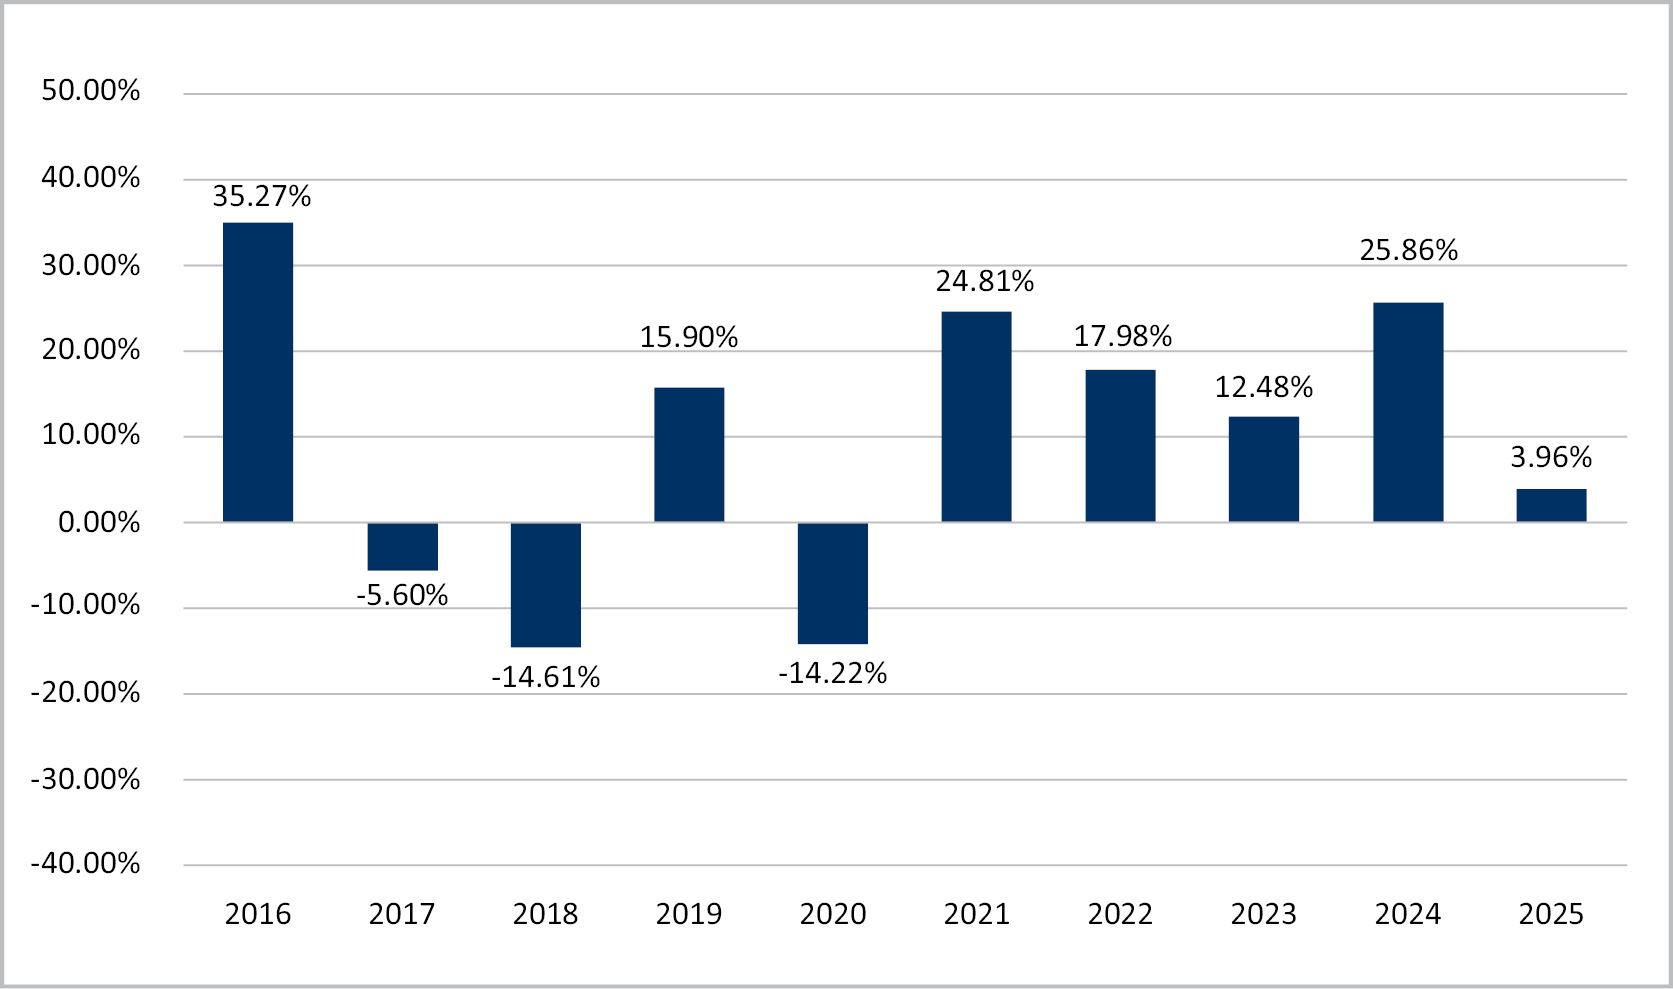
On May 7, 2025, the shareholders of Tortoise Energy Infrastructure and Income Fund, a series of Managed Portfolio Series, a Delaware statutory trust that registered as an open-end management investment company (“TNGY” or the “Predecessor Fund”), approved an Agreement and Plan of Reorganization (the “Plan”) by and between Managed Portfolio Series, on behalf of the Predecessor Fund, and the Trust, on behalf of the Fund, pursuant to which the Predecessor Fund would be reorganized by transferring all of the assets of the Predecessor Fund to the Fund, a newly formed actively-managed exchange-traded fund organized as a separate series of the Trust. As a result of the Reorganization, the Fund has assumed the performance history of the Predecessor Fund. The Predecessor Fund is the accounting successor to the Advisory Research MLP & Energy Income Fund (the “Energy Infrastructure and Income Predecessor Fund”). Accordingly, the performance shown in the bar chart and performance table for periods prior to November 15, 2019, represents the performance of the Energy Infrastructure and Income Predecessor Fund and the performance shown in the bar chart and performance table for periods from November 15, 2019 through June 13, 2025 represents the performance of the Predecessor Fund.
The accompanying bar chart and table provide some indication of the risks of investing in the Fund. The bar chart shows the changes in the Fund’s annual total returns from year to year. Following the bar chart is the Fund’s highest and lowest quarterly returns during the periods shown in the bar chart. The table illustrates how the Fund’s average annual returns for the 1-year, 5-year, 10-year and since-inception periods compare with those of a broad measure of market performance. The Fund’s past performance, before and after taxes, does not necessarily indicate how the Fund will perform in the future.
Updated information on the Fund’s results can be obtained by visiting www.tortoisecapital.com or by calling toll-free at (855) 822-3863.
____________
(1) The Fund’s year-to-date total return based on net asset value for the period January 1, 2026 to February 28, 2026 was 13.59%.
During the periods shown in the chart above:
| Best Quarter | Worst Quarter | |||||
| June 30, 2020 | 34.09% | March 31, 2020 | -43.64% | |||
| Average Annual Total Returns for the Periods | 1 Year | 5 Years | 10 Years | ||||||
| Return Before Taxes (No Load) | 3.96 | % | 16.73 | % | 8.92 | % | |||
| Return After Taxes on Distributions (No Load) | 3.00 | % | 16.08 | % | 8.22 | % | |||
| Return After Taxes on Distributions and Sale of Fund Shares (No Load) | 2.62 | % | 13.39 | % | 7.01 | % | |||
| Index Performance |
|
|
| ||||||
| Alerian MLP Index (reflects no deduction for fees, expenses or taxes)(2) | 2.04 | % | 25.69 | % | 8.67 | % | |||
| 75% S&P 500 Energy 25% ICE BofA US High Yield Energy Index (reflects no deduction for fees, expenses or taxes) | 8.51 | % | 19.90 | % | 8.38 | % | |||
| S&P 500 Energy Sector Total Return Index (reflects no deduction for fees, expenses or taxes) | 8.67 | % | 23.78 | % | 8.32 | % | |||
| S&P 500® Total Return Index (reflects no deduction for fees, expenses or taxes) | 17.88 | % | 14.42 | % | 14.82 | % | |||
____________
(1) Institutional Class shares of the Predecessor Fund commenced operations on December 27, 2010.
(2) The Alerian MLP Index is a composite of energy Master Limited Partnerships.
After-tax returns in the above table are calculated using the historical highest individual federal marginal income tax rates and do not reflect the impact of state and local taxes. Actual after-tax returns depend on an investor’s tax situation and may differ from those shown, and after-tax returns shown are not relevant to investors who hold Shares through tax-advantaged arrangements, such as 401(k) plans or individual retirement accounts.