Pay vs Performance Disclosure - USD ($)
Dec. 31, 2025
Dec. 31, 2024
Dec. 31, 2023
Dec. 31, 2022
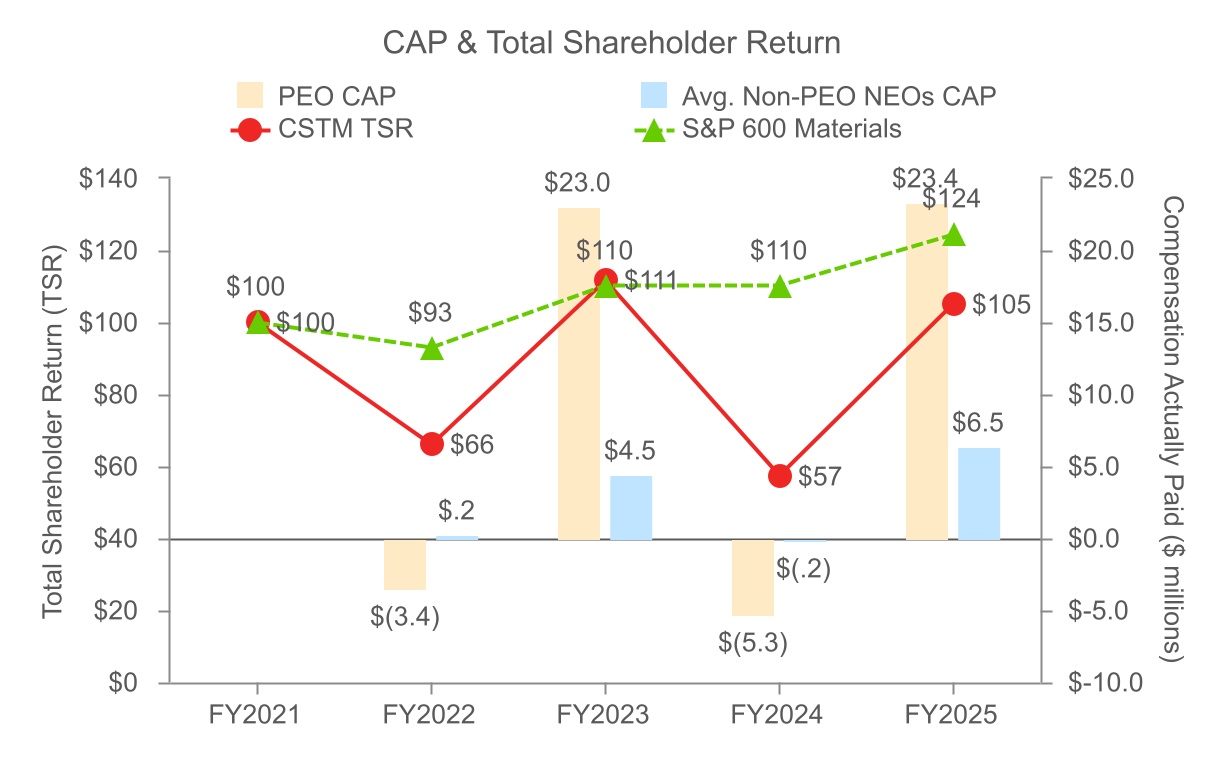
Year | Summary Compensation Table Total for PEO(1) | Compensation Actually Paid to PEO(2) | Average Summary Compensation Table Total for Non-PEO NEOs(3) | Average Compensation Actually Paid to Non-PEO NEOs(3) (4) | Value of Initial Fixed $100 Investment Based On: | Company Net Income ($M)(7) | EPA Segment Adjusted EBITDA ($M)(8) | |||||||||||||||||||||||||||||||||||||||||||
Company TSR(5) | Index TSR(6) | |||||||||||||||||||||||||||||||||||||||||||||||||
(a) | (b) | (c) | (d) | (e) | (f) | (g) | (h) | (i) | ||||||||||||||||||||||||||||||||||||||||||
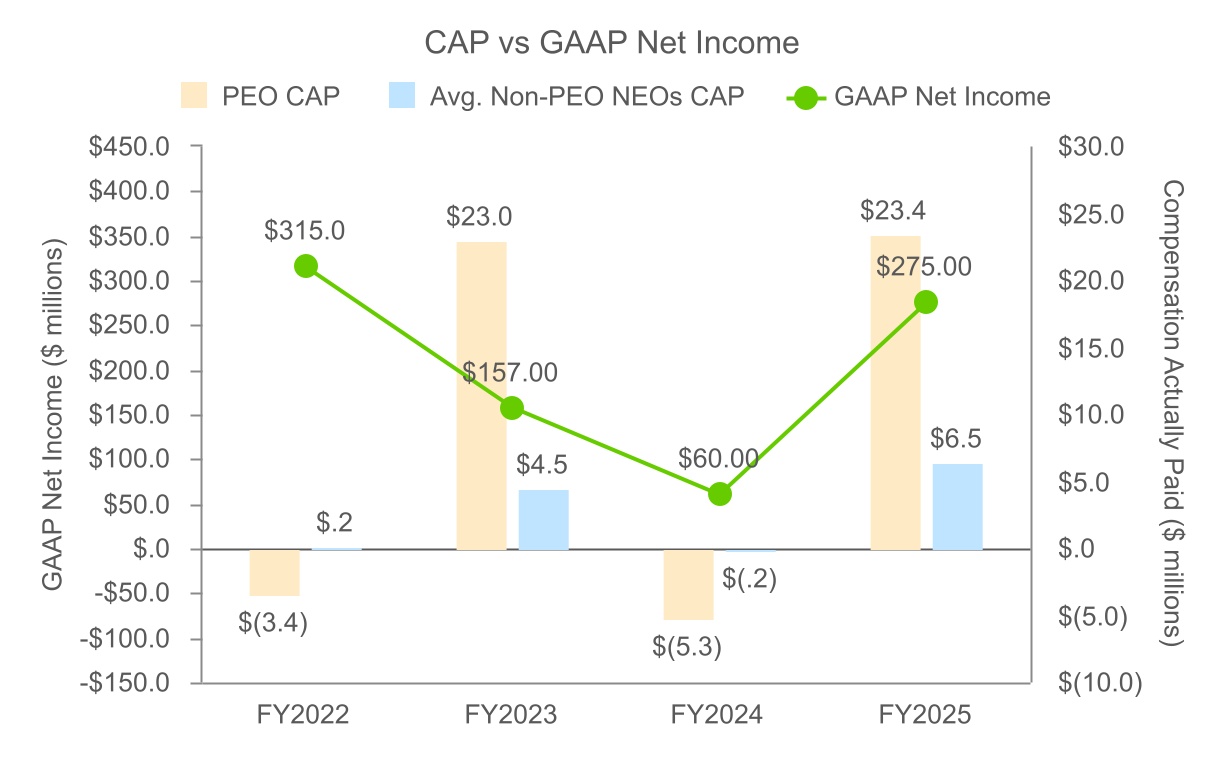
| 2025 | $ | 30,171,859 | $ | 23,364,716 | $ | 3,309,743 | $ | 6,452,675 | 105 | 124 | 275 | 719 | ||||||||||||||||||||||||||||||||||||||
| 2024 | $ | 8,881,752 | $ | (5,262,772) | $ | 2,210,067 | $ | (198,956) | 57 | 110 | 60 | 587 | ||||||||||||||||||||||||||||||||||||||
| 2023 | $ | 9,962,993 | $ | 23,041,552 | $ | 2,782,785 | $ | 4,450,187 | 111 | 110 | 157 | 756 | ||||||||||||||||||||||||||||||||||||||
| 2022 | $ | 8,939,010 | $ | (3,430,929) | $ | 2,607,284 | $ | 216,040 | 66 | 93 | 315 | 707 | ||||||||||||||||||||||||||||||||||||||
(6) Reflects total shareholder return indexed to $100 for the S&P 600 Materials Index (“Peer Group TSR”), which is an industry line peer group reported for the year ended December 31, 2025, and assuming reinvestment of all dividends, where applicable.
Year | SCT Total for PEO | Minus SCT Change in Pension Value for PEO | Plus Pension Value Service Cost | Minus SCT Equity for PEO | Plus (Minus) EOY Fair Value of Equity Awards Granted During Fiscal Year that are Outstanding and Unvested at EOY | Plus (Minus) Change from BOY to EOY in Fair Value of Awards Granted in Any Prior Fiscal Year that are Outstanding and Unvested at EOY | Plus (Minus) Change in Fair Value from BOY to Vesting Date of Awards Granted in Any Prior Fiscal Year that Vested During the Fiscal Year | Minus Fair Value at BOY of Awards Granted in Prior Year that were Forfeited During the Fiscal Year | PEO CAP | |||||||||||||||||||||||||||||||||||||||||||||||
| 2025 | $ | 30,171,859 | $ | — | $ | — | $ | 26,354,236 | $ | 8,855,046 | $ | 10,626,248 | $ | 186,085 | $ | (120,286) | $ | 23,364,716 | ||||||||||||||||||||||||||||||||||||||
| 2024 | $ | 8,881,752 | $ | — | $ | — | $ | 6,915,992 | $ | 2,165,146 | $ | (9,595,771) | $ | 202,093 | $ | — | $ | (5,262,772) | ||||||||||||||||||||||||||||||||||||||
| 2023 | $ | 9,962,993 | $ | — | $ | — | $ | 6,452,077 | $ | 8,989,200 | $ | 7,431,950 | $ | 3,109,486 | $ | — | $ | 23,041,552 | ||||||||||||||||||||||||||||||||||||||
| 2022 | $ | 8,939,010 | $ | — | $ | — | $ | 5,662,557 | $ | 2,453,831 | $ | (9,573,067) | $ | 411,854 | $ | — | $ | (3,430,929) | ||||||||||||||||||||||||||||||||||||||
(4) The dollar amounts reported in column (e) represent the amount of CAP for the non-PEO NEOs, as computed in accordance with Item 402(v) of Regulation S-K. The dollar amounts reported do not reflect the actual amount of compensation earned by or paid to these executive officers during the applicable year. As computed in accordance with Item 402(v) of Regulation S-K, the following adjustments were made to the non-PEO NEOs’ total compensation for each year to determine the compensation actually paid:
Year | SCT Total for Average Non-PEO NEOs | Minus SCT Change in Pension Value for Average Non-PEO NEOs | Plus Pension Value Service Cost | Minus SCT Equity for Average Non-PEO NEOs | Plus (Minus) EOY Fair Value of Equity Awards Granted During Fiscal Year that are Outstanding and Unvested at EOY | Plus (Minus) Change from BOY to EOY in Fair Value of Awards Granted in Any Prior Fiscal Year that are Outstanding and Unvested at EOY | Plus (Minus) Change in Fair Value from BOY to Vesting Date of Awards Granted in Any Prior Fiscal Year that Vested During the Fiscal Year | Average Non-PEO NEOs CAP | ||||||||||||||||||||||||||||||||||||||||||
| 2025 | $ | 3,309,743 | $ | (62,239) | $ | 14,107 | $ | 1,521,393 | $ | 2,735,006 | $ | 1,951,565 | $ | 25,884 | $ | 6,452,675 | ||||||||||||||||||||||||||||||||||
| 2024 | $ | 2,210,067 | $ | (94,505) | $ | 11,769 | $ | 1,132,487 | $ | 394,237 | $ | (1,614,630) | $ | 26,593 | $ | (198,956) | ||||||||||||||||||||||||||||||||||
| 2023 | $ | 2,782,785 | $ | (104,288) | $ | 10,166 | $ | 1,311,430 | $ | 1,774,887 | $ | 995,469 | $ | 302,598 | $ | 4,450,187 | ||||||||||||||||||||||||||||||||||
| 2022 | $ | 2,607,284 | $ | — | $ | 11,797 | $ | 1,187,029 | $ | 529,669 | $ | (1,818,052) | $ | 72,371 | $ | 216,040 | ||||||||||||||||||||||||||||||||||

| EPA Segment Adjusted EBITDA | ||
| EPA Adjusted Free Cash Flow | ||
| Relative Total Shareholder Return vs. S&P SmallCap 600 Materials Index and S&P MidCap 400 Materials Index | ||
(3) Reflects compensation amounts reported for the non-PEO NEOs, in the Summary Compensation Table (“SCT”), who were as follows:
| 2025 | 2024 | 2023 | 2022 | |||||||||||||||||
Jack Guo | Jack Guo | Jack Guo | Peter Matt | |||||||||||||||||
Ingrid Joerg | Ingrid Joerg | Ingrid Joerg | Ingrid Joerg | |||||||||||||||||
Phillipe Hoffman | Phillipe Hoffman | Phillipe Hoffman | Phillipe Hoffman | |||||||||||||||||
Ryan Jurkovic | Ryan Jurkovic | Ryan Jurkovic | Ryan Jurkovic | |||||||||||||||||
(7) The dollar amounts reported represent the amount of net income (in millions) under U.S. GAAP reflected in Constellium’s 10-K filed on February 25, 2026.
(8) We determined EPA Segment Adjusted EBITDA as the “company-selected measure” (as previously defined). EPA Segment Adjusted EBITDA is a non-GAAP measure and as previously disclosed in “Compensation Discussion and Analysis—Elements of Executive Compensation” was set in USD and under GAAP in 2025, and for 2022-2024 was set in Euros and under IFRS when the Company was a foreign private issuer. For fiscal years 2025, 2024, 2023, and 2022, the EPA Segment Adjusted EBITDA was $720, €542, €699 and €673 respectively. In fiscal year 2023, for the purposes of EPA payout calculations, an adjustment of €13.8 was made to the Adjusted EBITDA of €713, resulting in EPA Segment Adjusted EBITDA of €699. For fiscal years 2022 - 2024, the column reflects the EPA Segment Adjusted EBITDA converted from EUR to USD using the average exchange rate for the respective years (1 euro to 1.0821 USD in fiscal year 2024; 1 euro to 1.0810 USD in fiscal year 2023; and 1 euro to 1.507 USD in fiscal year 2022). The rates are sourced from European Central Bank.