The bar chart and performance table below show the variability of the Fund’s returns, which is some indication of the risks of investing in the Fund. The bar chart shows performance of the Shares for each full calendar year since the Fund’s inception. The performance table compares the performance of the Shares over time to the performance of a broad-based securities index. You should be aware that the Fund’s past performance (before and after taxes) may not be an indication of how the Fund will perform in the future. Updated performance information is available on the Fund’s website at: www.zacksetfs.com or by calling 855-813-3507.
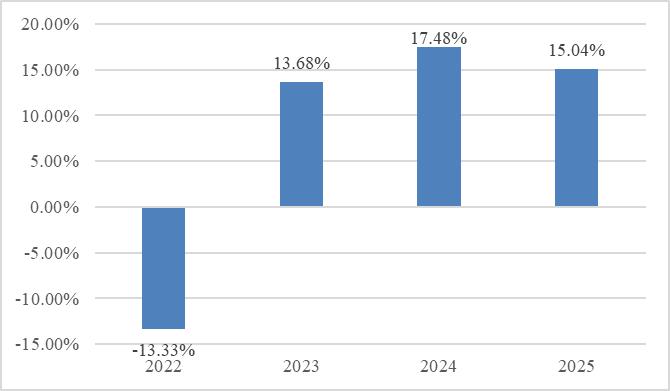
| Best Quarter | 12/31/2022 | 9.64% |
| Worst Quarter | 6/30/2022 | (12.23)% |
| One Year |
Since Inception(1) | |||
| Return Before Taxes | 15.04% | 8.65% | ||
| Return after Taxes on Distributions | 14.68% | 8.43% | ||
| Return after Taxes on Distributions and Sale of Fund Shares | 8.91% | 6.73% | ||
| Russell 3000® Index(2) | 17.15% | 10.74% |
| (1) | Inception date is August 23, 2021. |
| (2) | The Russell 3000® Index is composed of 3000 large U.S. companies, as determined by market capitalization. This portfolio of securities represents approximately 96% of the investable U.S. equity market. The Russell 3000® Index is comprised of stocks within the Russell 1000® and the Russell 2000® Indices. The Russell 3000® Index was developed with a base value of 140.00 as of December 31, 1986. |
The bar chart and performance table below show the variability of the Fund’s returns, which is some indication of the risks of investing in the Fund. The bar chart shows performance of the Shares for a full calendar year since the Fund’s inception. The performance table compares the performance of the Shares over time to the performance of a broad-based securities index. You should be aware that the Fund’s past performance (before and after taxes) may not be an indication of how the Fund will perform in the future. Updated performance information is available on the Fund’s website at: www.zacksetfs.com or by calling 855-813-3507.
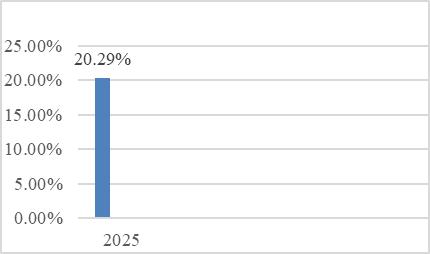
| Best Quarter | 6/30/2025 | 18.75% |
| Worst Quarter | 3/31/2025 | (10.12)% |
| One Year |
Since Inception(1) | |||
| Return Before Taxes | 20.29% | 16.97% | ||
| Return after Taxes on Distributions | 20.27% | 16.95% | ||
| Return after Taxes on Distributions and Sale of Fund Shares | 12.01% | 12.94% | ||
| Russell 3000® Index(2) | 17.15% | 11.63% |
| (1) | The Fund commenced operation on December 4, 2024. |
| (2) | The Russell 3000® Index is composed of 3000 large U.S. companies, as determined by market capitalization. This portfolio of securities represents approximately 96% of the investable U.S. equity market. The Russell 3000® Index is comprised of stocks within the Russell 1000® and the Russell 2000® Indices. The Russell 3000® Index was developed with a base value of 140.00 as of December 31, 1986. |
The bar chart and performance table below show the variability of the Fund’s returns, which is some indication of the risks of investing in the Fund. The bar chart shows performance of the Shares for each full calendar year since the Fund’s inception. The performance table compares the performance of the Shares over time to the performance of a broad-based securities index. You should be aware that the Fund’s past performance (before and after taxes) may not be an indication of how the Fund will perform in the future. Updated performance information is available on the Fund’s website at: www.zacksetfs.com or by calling 855-813-3507.
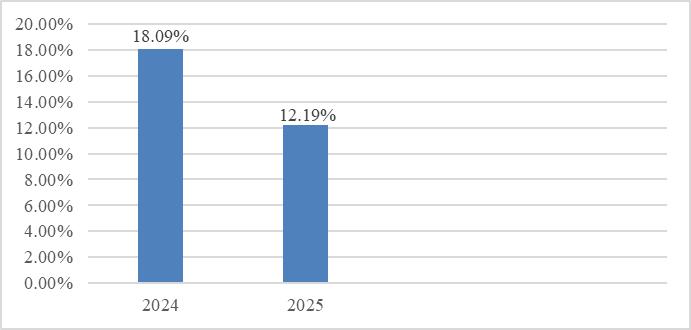
| Best Quarter | 6/30/25 | 12.13% |
| Worst Quarter | 3/31/25 | (8.89)% |
| One Year |
Since Inception(1) | |||
| Return Before Taxes | 12.19% | 20.28% | ||
| Return after Taxes on Distributions | 11.91% | 19.82% | ||
| Return after Taxes on Distributions and Sale of Fund Shares | 7.22% | 15.65% | ||
| Russell 3000® Index(2) | 17.15% | 24.23% |
| (1) | Inception date is October 2, 2023. |
| (2) | The Russell 3000® Index is composed of 3000 large U.S. companies, as determined by market capitalization. This portfolio of securities represents approximately 96% of the investable U.S. equity market. The Russell 3000® Index is comprised of stocks within the Russell 1000® and the Russell 2000® Indices. The Russell 3000® Index was developed with a base value of 140.00 as of December 31, 1986. |
Because the Fund has not been in operation for an entire calendar year, no Fund performance information is shown. You may request a copy of the Fund’s annual and semi-annual reports, once available, at no charge by calling the Fund at 855-813-3507. Interim information on the Fund’s results can be obtained by visiting the Fund’s website at www.zacksetfs.com.
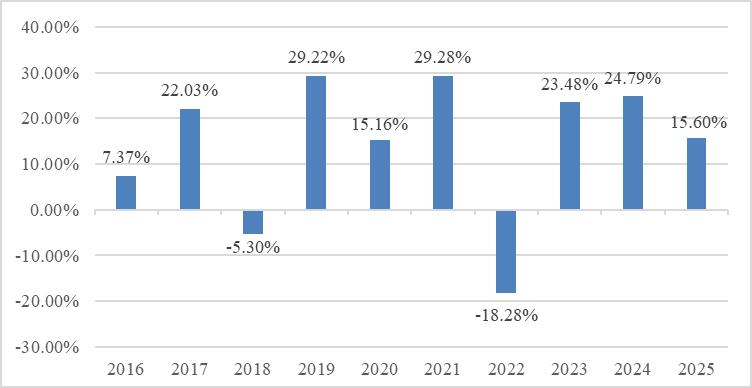
The following bar chart and tables provide an indication of the risks of investing in the Fund by showing changes in the Fund’s Institutional Class performance from year to year and by showing how the average annual total returns for each class compared to that of a broad-based securities market index. The Fund acquired all of the assets and liabilities of the Zacks All-Cap Core Fund (the “Predecessor Fund”), a series of Investment Managers Series Trust (the “Predecessor Trust”), in a tax-free reorganization on January 26, 2024. In connection with this acquisition, Institutional Class shares of the Predecessor Fund were exchanged for Institutional Class shares of the Fund. The Predecessor Fund had an investment objective and strategies that were, in all material respects, the same as those of
the Fund, and were managed in a manner that, in all material respects, complied with the investment guidelines and restrictions of the Fund. The performance information set forth below reflects the historical performance of the Predecessor Fund’s shares. Prior to October 31, 2016, Institutional Class shares were designated as Class A shares, which were subject to a 5.75% sales charge that is not reflected in the total return figures. You should be aware that the Fund’s past performance (before and after taxes) may not be an indication of how the Fund will perform in the future. Updated performance information is available on the Fund’s website at: www.zacksfunds.com or by calling 1-888-453-4003.
| Institutional Class Shares | ||||
| Highest Calendar Quarter Return at NAV (non-annualized): |
18.66% | Quarter Ended 06/30/2020 | ||
| Lowest Calendar Quarter Return at NAV (non-annualized): |
(18.59)% | Quarter Ended 03/31/2020 |
| Average Annual Total Returns for the Periods Ended December 31, 2025 |
1 year | 5 years | 10 years | |||
| Return Before Taxes | ||||||
| Institutional Class Shares | 15.60% | 13.48% | 13.26% | |||
| Return After Taxes on Distributions | ||||||
| Institutional Class Shares | 14.97% | 10.57% | 10.57% | |||
| Return After Taxes on Distributions and Sale of Fund Shares | ||||||
| Institutional Class Shares | 9.67% | 10.10% | 10.05% | |||
| Russell 3000® Index (Reflects no deductions for fees, expenses or taxes) | 17.15% | 13.15% | 14.29% |
The following bar chart and tables provide an indication of the risks of investing in the Fund by showing changes in the Fund’s Investor Class performance from year to year and by showing how the average annual total returns for each class compared to that of a broad-based securities market index. The Fund acquired all of the assets and liabilities of the Zacks Small-Cap Core Fund (the “Predecessor Fund”), a series of Investment Managers Series Trust (the “Predecessor Trust”), in a tax-free reorganization on January 26, 2024. In connection with this acquisition, Institutional Class and Investor Class shares of the Predecessor Fund were exchanged for Institutional Class shares and Investor Class shares of the Fund, respectively. The Predecessor Fund had an investment objective and strategies that were, in all material respects, the same as those of the Fund, and were managed in a manner that, in all material respects, complied with the investment guidelines and restrictions of the Fund. The performance information set forth below reflects the historical performance of the Predecessor Fund’s shares. You should be aware that the Fund’s past performance (before and after taxes) may not be an indication of how the Fund will perform in the future. Updated performance information is available on the Fund’s website at: www.zacksfunds.com or by calling 1-888-453-4003.
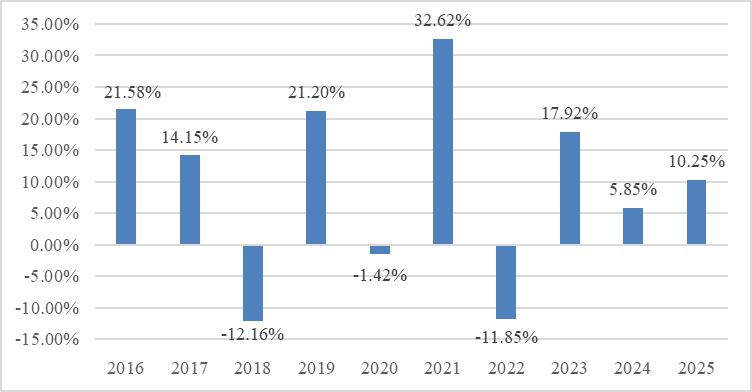
| Investor Class Shares | ||||
| Highest Calendar Quarter Return at NAV (non-annualized): |
24.13% |
Quarter Ended | ||
| Lowest Calendar Quarter Return at NAV (non-annualized): |
(34.77)% | Quarter Ended 03/31/2020 |
| Average Annual Total Returns for the Periods Ended December 31, 2025 |
1 year | 5 years | 10 years* | |||
| Return Before Taxes | ||||||
| Investor Class Shares | 10.25% | 9.98% | 8.89% | |||
| Institutional Class Shares | 10.53% | 10.26% | 9.17% | |||
| Return After Taxes on Distributions | ||||||
| Investor Class Shares | 10.25% | 8.53% | 7.17% | |||
| Return After Taxes on Distributions and Sale of Fund Shares | ||||||
| Investor Class Shares | 6.07% | 7.51% | 6.45% | |||
| Russell 3000® Index** (Reflects no deductions for fees, expenses or taxes) | 17.15% | 13.15% | 14.29% | |||
| Russell 2000® Index (Reflects no deductions for fees, expenses or taxes) | 11.29% | 4.68% | 8.13% |
| * | Investor Class shares were first offered on June 30, 2011. Institutional Class shares were first offered on February 28, 2014. The performance figures for Institutional Class shares include the performance for the Investor Class shares for the period prior to February 28, 2014. For such period Institutional Class shares would have had substantially similar performance as Investor Class because the shares are invested in the same portfolio of securities and the average annual total returns would have differed only to the extent that the expenses of Institutional Class shares were lower than the expenses of Investor Class shares and therefore, returns for Institutional Class shares would have been higher than those of Investor Class shares. | |
| ** | In accordance with new regulatory requirements, the Fund changed its broad-based securities market index from the Russell 2000® Index to the Russell 3000® Index. The Fund will continue to show the performance of the Russell 2000® Index for comparative purposes. |
After-tax performance is presented only for Investor Class shares of the Fund. The after-tax returns for other Fund classes may vary. Actual after-tax returns depend on the investor’s individual tax situation and may differ from the returns shown. After-tax returns are not relevant for shares held in tax-advantaged investment vehicles such as employer-sponsored 401(k) plans and individual retirement accounts (“IRAs”). The after-tax returns shown are calculated using the highest individual federal marginal income tax rates in effect during the periods presented and do not reflect the impact of state and local taxes.
The following bar chart and tables provide an indication of the risks of investing in the Fund by showing changes in the Fund’s Investor Class performance from year to year and by showing how the average annual total returns for each class compared to that of a broad-based securities market index. The Fund acquired all of the assets and liabilities of the Zacks Dividend Fund (the “Predecessor Fund”), a series of Investment Managers Series Trust (the “Predecessor Trust”), in a tax-free reorganization on January 26, 2024. In connection with this acquisition, Institutional Class and Investor Class shares of the Predecessor Fund were exchanged for Institutional Class shares and Investor Class shares of the Fund, respectively. The Predecessor Fund had an investment objective and strategies that were, in all material respects, the same as those of the Fund, and were managed in a manner that, in all material respects, complied with the investment guidelines and restrictions of the Fund. The performance information set forth below reflects the historical performance of the Predecessor Fund’s shares. You should be aware that the Fund’s past performance (before and after taxes) may not be an indication of how the Fund will perform in the future. Updated performance information is available on the Fund’s website at: www.zacksfunds.com or by calling 1-888-453-4003.
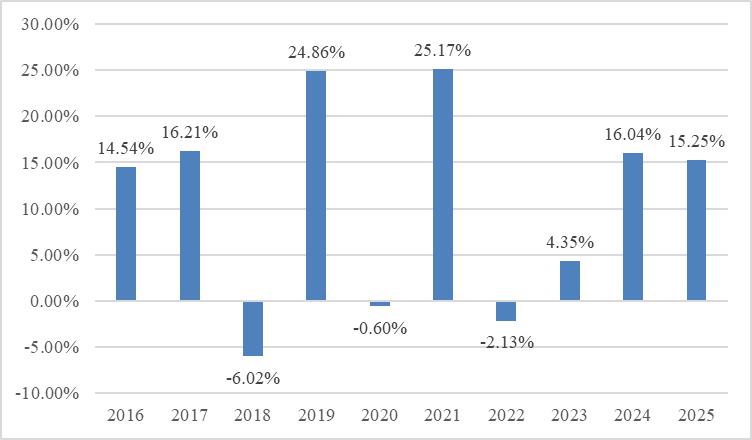
| Investor Class Shares | ||||
| Highest Calendar Quarter Return at NAV (non-annualized): |
15.00% | Quarter Ended 12/31/2022 | ||
| Lowest Calendar Quarter Return at NAV (non-annualized): |
(23.00)% | Quarter Ended 03/31/2020 |
| Average Annual Total Returns for the Periods Ended December 31, 2025 |
1 year | 5 years | 10 years* | |||
| Return Before Taxes | ||||||
| Investor Class Shares | 15.25% | 11.32% | 10.25% | |||
| Institutional Class Shares | 15.51% | 11.33% | 9.96% | |||
| Return After Taxes on Distributions* | ||||||
| Investor Class Shares | 14.27% | 9.70% | 8.78% | |||
| Return After Taxes on Distributions and Sale of Fund Shares* | ||||||
| Investor Class Shares | 9.72% | 8.50% | 7.80% | |||
| Russell 1000®** Index (Reflects no deductions for fees, expenses or taxes) | 17.37% | 13.59% | 14.59% | |||
| Russell 1000® Value Index (Reflects no deductions for fees, expenses or taxes) | 15.91% | 11.33% | 10.53% |
| * | Investor Class shares were first offered on January 31, 2014. Institutional Class shares were first offered on January 31, 2017. The performance figures for Institutional Class shares include the performance for the Investor Class shares for the period prior to January 31, 2017. For such period Institutional Class shares would have had substantially similar performance as Investor Class because the shares are invested in the same portfolio of securities and the average annual total returns would have differed only to the extent that the expenses of Institutional Class shares were lower than the expenses of Investor Class shares and therefore, returns for Institutional Class shares would have been higher than those of Investor Class shares. | |
| ** | In accordance with regulatory requirements, the Fund changed its broad-based securities market index from the Russell 1000® Value Index to the Russell 1000® Index. The Fund will continue to show the performance of the Russell 1000® Value Index for comparative purposes. |
After-tax performance is presented only for Investor Class shares of the Fund. The after-tax returns for other Fund classes may vary. Actual after-tax returns depend on the investor’s individual tax situation and may differ from the returns shown. After-tax returns are not relevant for shares held in tax-advantaged investment vehicles such as employer-sponsored 401(k) plans and individual retirement accounts (“IRAs”). The after-tax returns shown are calculated using the highest individual federal marginal income tax rates in effect during the periods presented and do not reflect the impact of state and local taxes.