Pay vs Performance Disclosure - USD ($)
Dec. 31, 2025
Dec. 31, 2024
Dec. 31, 2023
Dec. 31, 2022
Dec. 31, 2021
Year (a) | Summary Compensation Table Total for Current PEO(1) (b) | Compensation Actually Paid to Current PEO(2) (c) | Summary Compensation Table Total for Former PEO 1(1) (b1) | Compensation Actually Paid to Former PEO 1(2) (c1) | Summary Compensation Table Total for Former PEO 2(1) (b1) | Compensation Actually Paid to Former PEO 2(2) (c1) | Average Summary Compensation Table Total for Non-PEO NEOs(1) (d) | Average Compensation Actually Paid to Non-PEO NEOs(2) (e) | Value of Initial Fixed $100 Investment Based On: | Net Income(4) (in Millions) (h) | Economic Profit(5) (in Millions) (i) | |||||||||||||||||||||||||||
Total Share holder Return (f) | Peer Group Total Share holder Return(3) (g) | |||||||||||||||||||||||||||||||||||||
| 2025 | $11,711,611 | $12,431,757 | $23,696,453 | $ | 15,790,960 | N/A | N/A | $ | 4,583,430 | $ | 4,788,333 | $128 | $190 | $2,889 | $1,621 | |||||||||||||||||||||||
| 2024 | N/A | N/A | $ | 15,350,651 | $ | 11,276,787 | N/A | N/A | $ | 4,282,380 | $ | 3,295,035 | $112 | $159 | $3,470 | $2,341 | ||||||||||||||||||||||
| 2023 | N/A | N/A | $ | 14,074,235 | $ | 15,733,686 | N/A | N/A | $ | 4,114,993 | $ | 4,663,286 | $119 | $135 | $3,668 | $2,577 | ||||||||||||||||||||||
| 2022 | N/A | N/A | $ | 8,348,517 | $ | 9,301,674 | $ | 19,536,434 | $ | 9,694,786 | $ | 4,856,562 | $ | 3,422,243 | $105 | $114 | $4,114 | $2,890 | ||||||||||||||||||||
| 2021 | N/A | N/A | N/A | N/A | $ | 20,006,806 | $ | 32,556,244 | $ | 4,076,812 | $ | 6,737,795 | $126 | $121 | $3,730 | $2,414 | ||||||||||||||||||||||
(2)Compensation “actually paid” for the current PEO and average compensation “actually paid” for the non-PEO NEOs in 2025 reflect the respective amounts set forth in columns (b) and (d), adjusted as follows in the table below, as determined in accordance with SEC rules. These dollar amounts do not reflect the actual amount of compensation earned by or paid to the PEO and our other NEOs during the applicable year.
| Calculation for Current PEO | Calculation for Average of Non-PEO NEOs | |||||||
| Calculation of Compensation “Actually Paid” | Year 2025 ($) | Year 2025 ($) | ||||||
| Summary Compensation Table Total | 11,711,611 | 4,583,430 | ||||||
| Less Stock and Option Award Values Reported in Summary Compensation Table for the Covered Year | (10,633,407) | (2,746,394) | ||||||
| Plus Fair Value for Awards Granted in the Covered Year | 11,353,553 | 2,617,435 | ||||||
| Change in Fair Value of Awards from Prior Years that Vested in the Covered Year | — | 66,710 | ||||||
| Change in Fair Value of Outstanding Unvested Awards from Prior Years | — | 314,622 | ||||||
| Less Fair Value of Awards Forfeited during the Covered Year | — | — | ||||||
| Plus Fair Value of Incremental Dividends of Earnings Paid on Stock Awards | — | — | ||||||
| Less Aggregate Change in Actuarial Present Value of Accumulated Benefit Under Pension Plans | — | (91,813) | ||||||
| Plus Aggregate Service Cost and Prior Service Cost for Pension Plans | — | 44,343 | ||||||
| Compensation “Actually Paid” | 12,431,757 | 4,788,333 | ||||||
Fair values set forth in the table above are computed in accordance with ASC 718 as of the end of the respective fiscal year, other than fair values of awards that vest in the covered year, which are valued as of the applicable vesting date.
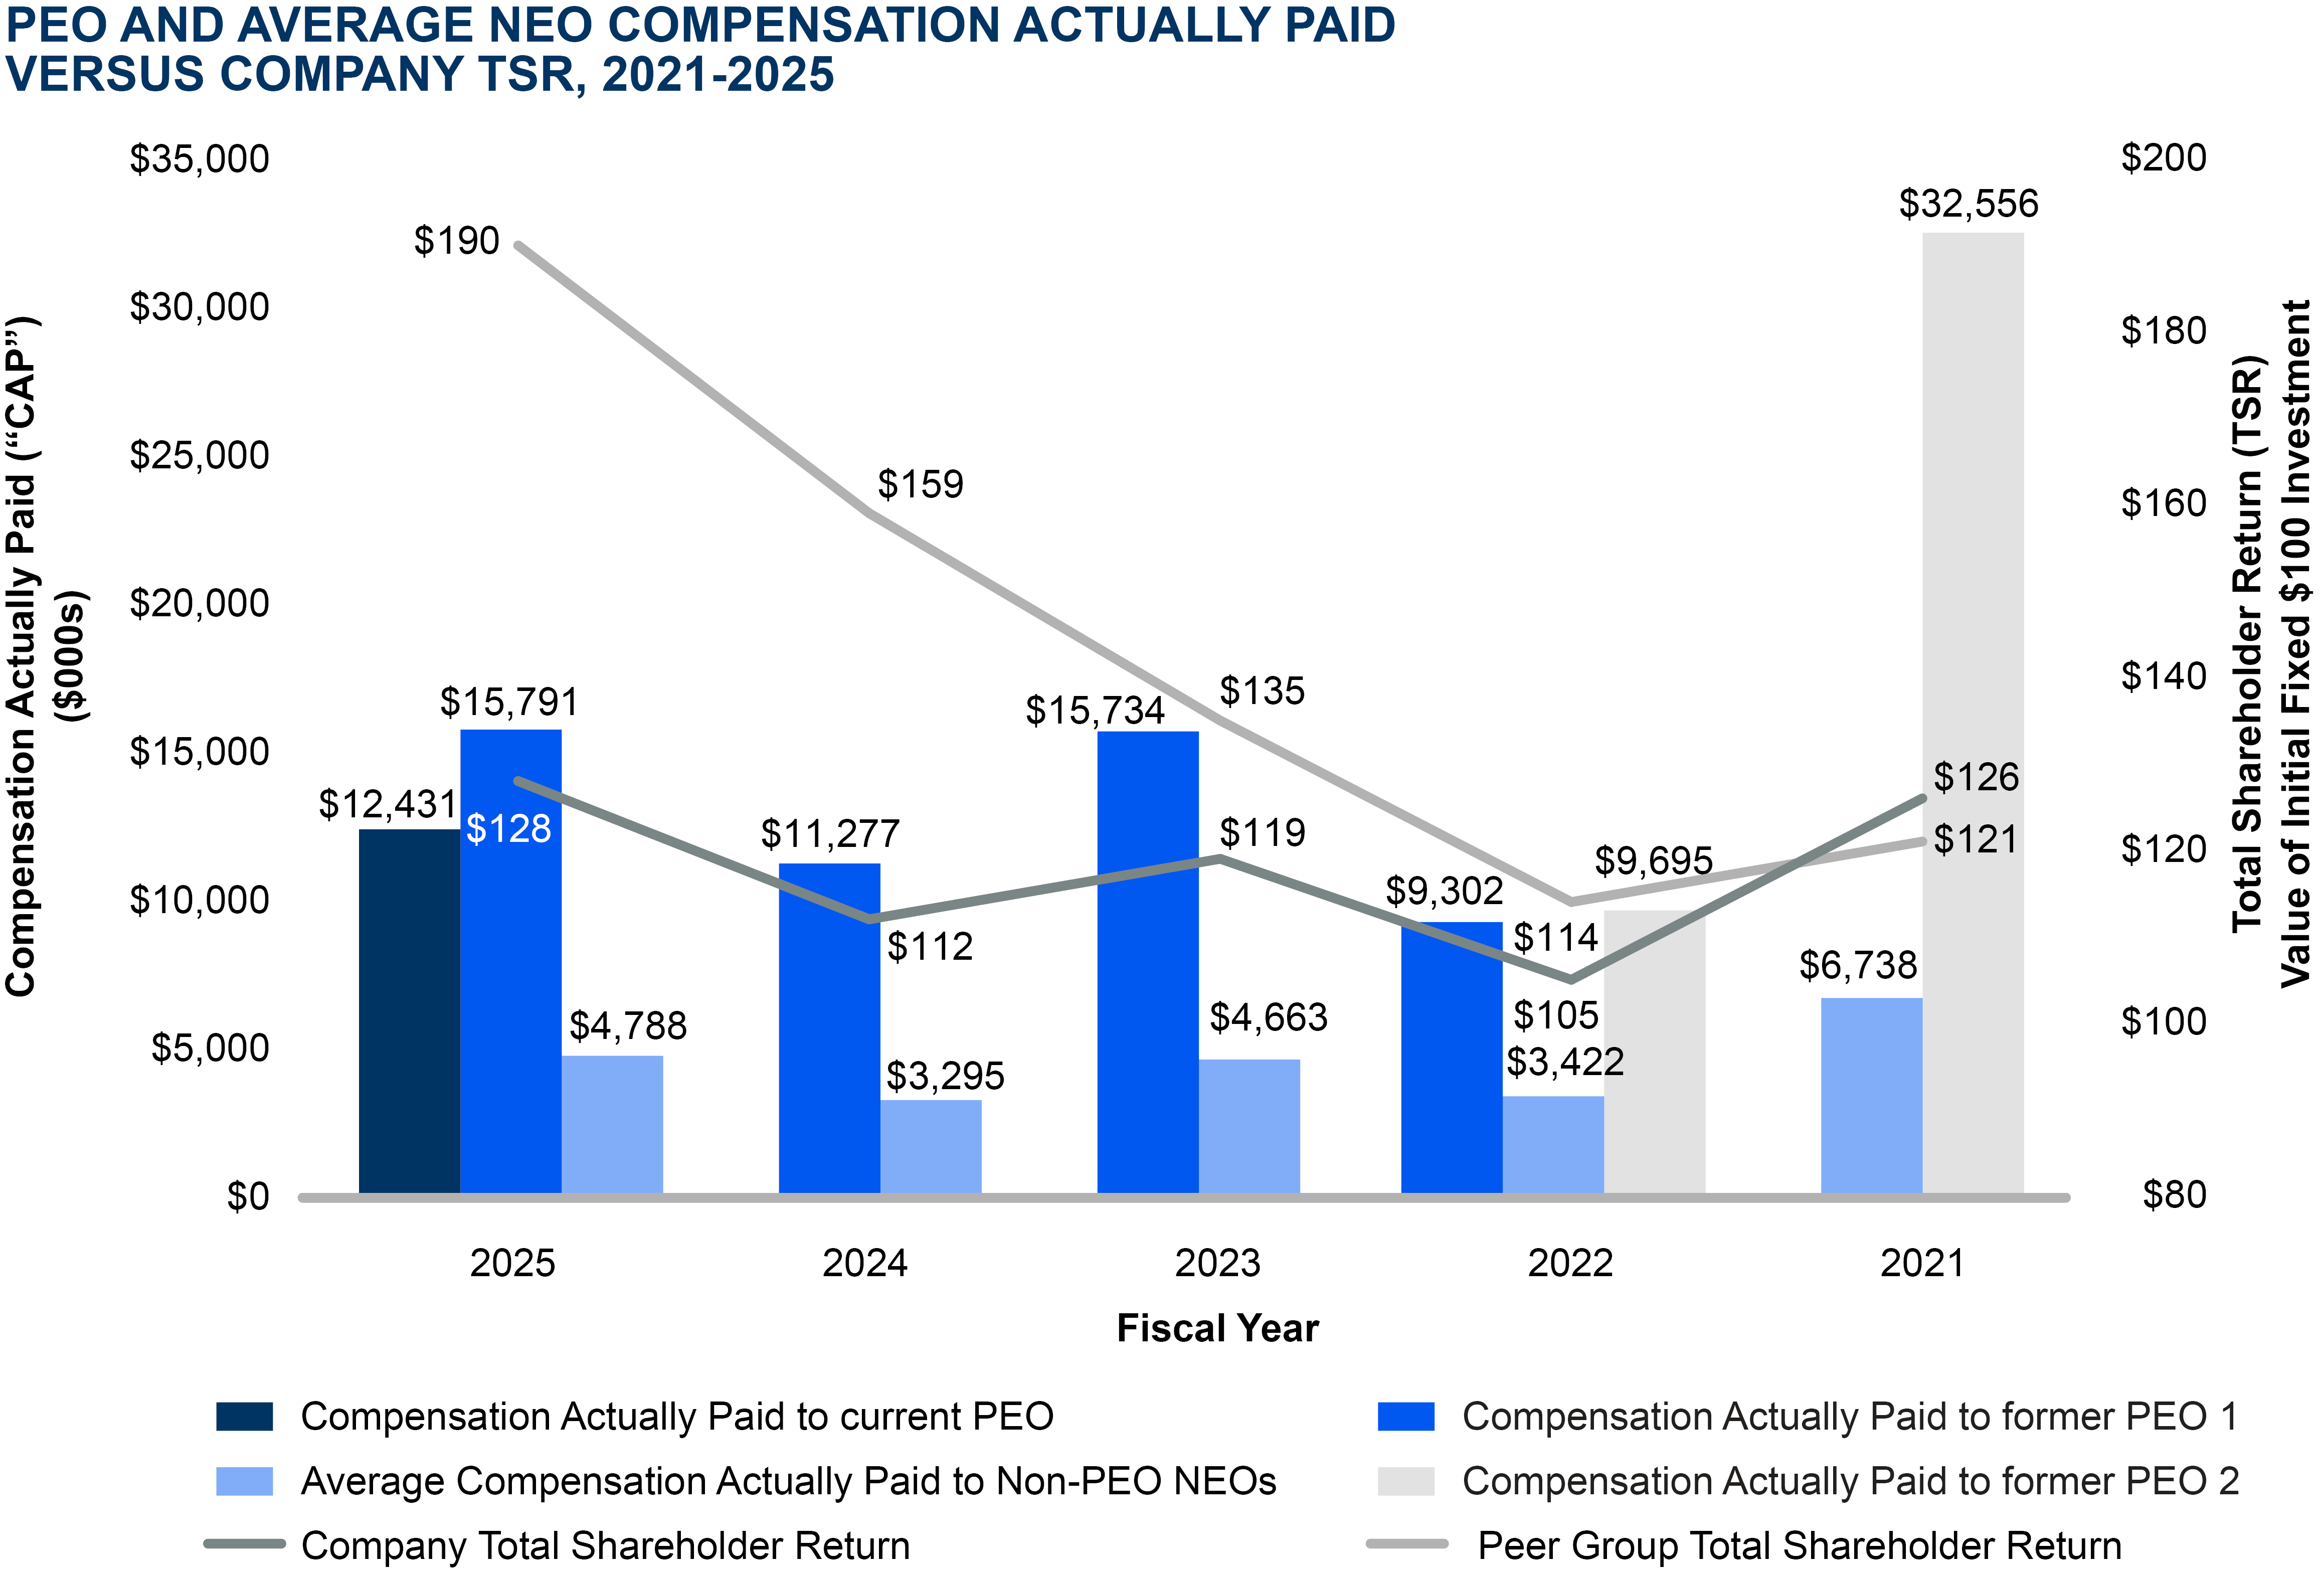
The following chart sets forth the relationship between “Compensation Actually Paid” to our PEO, the average of “Compensation Actually Paid” to our other NEOs, the Company’s cumulative TSR and the peer group’s cumulative TSR over the five-year period from 2021 through 2025. The peer group TSR is based on the S&P 500 Industrials Index.
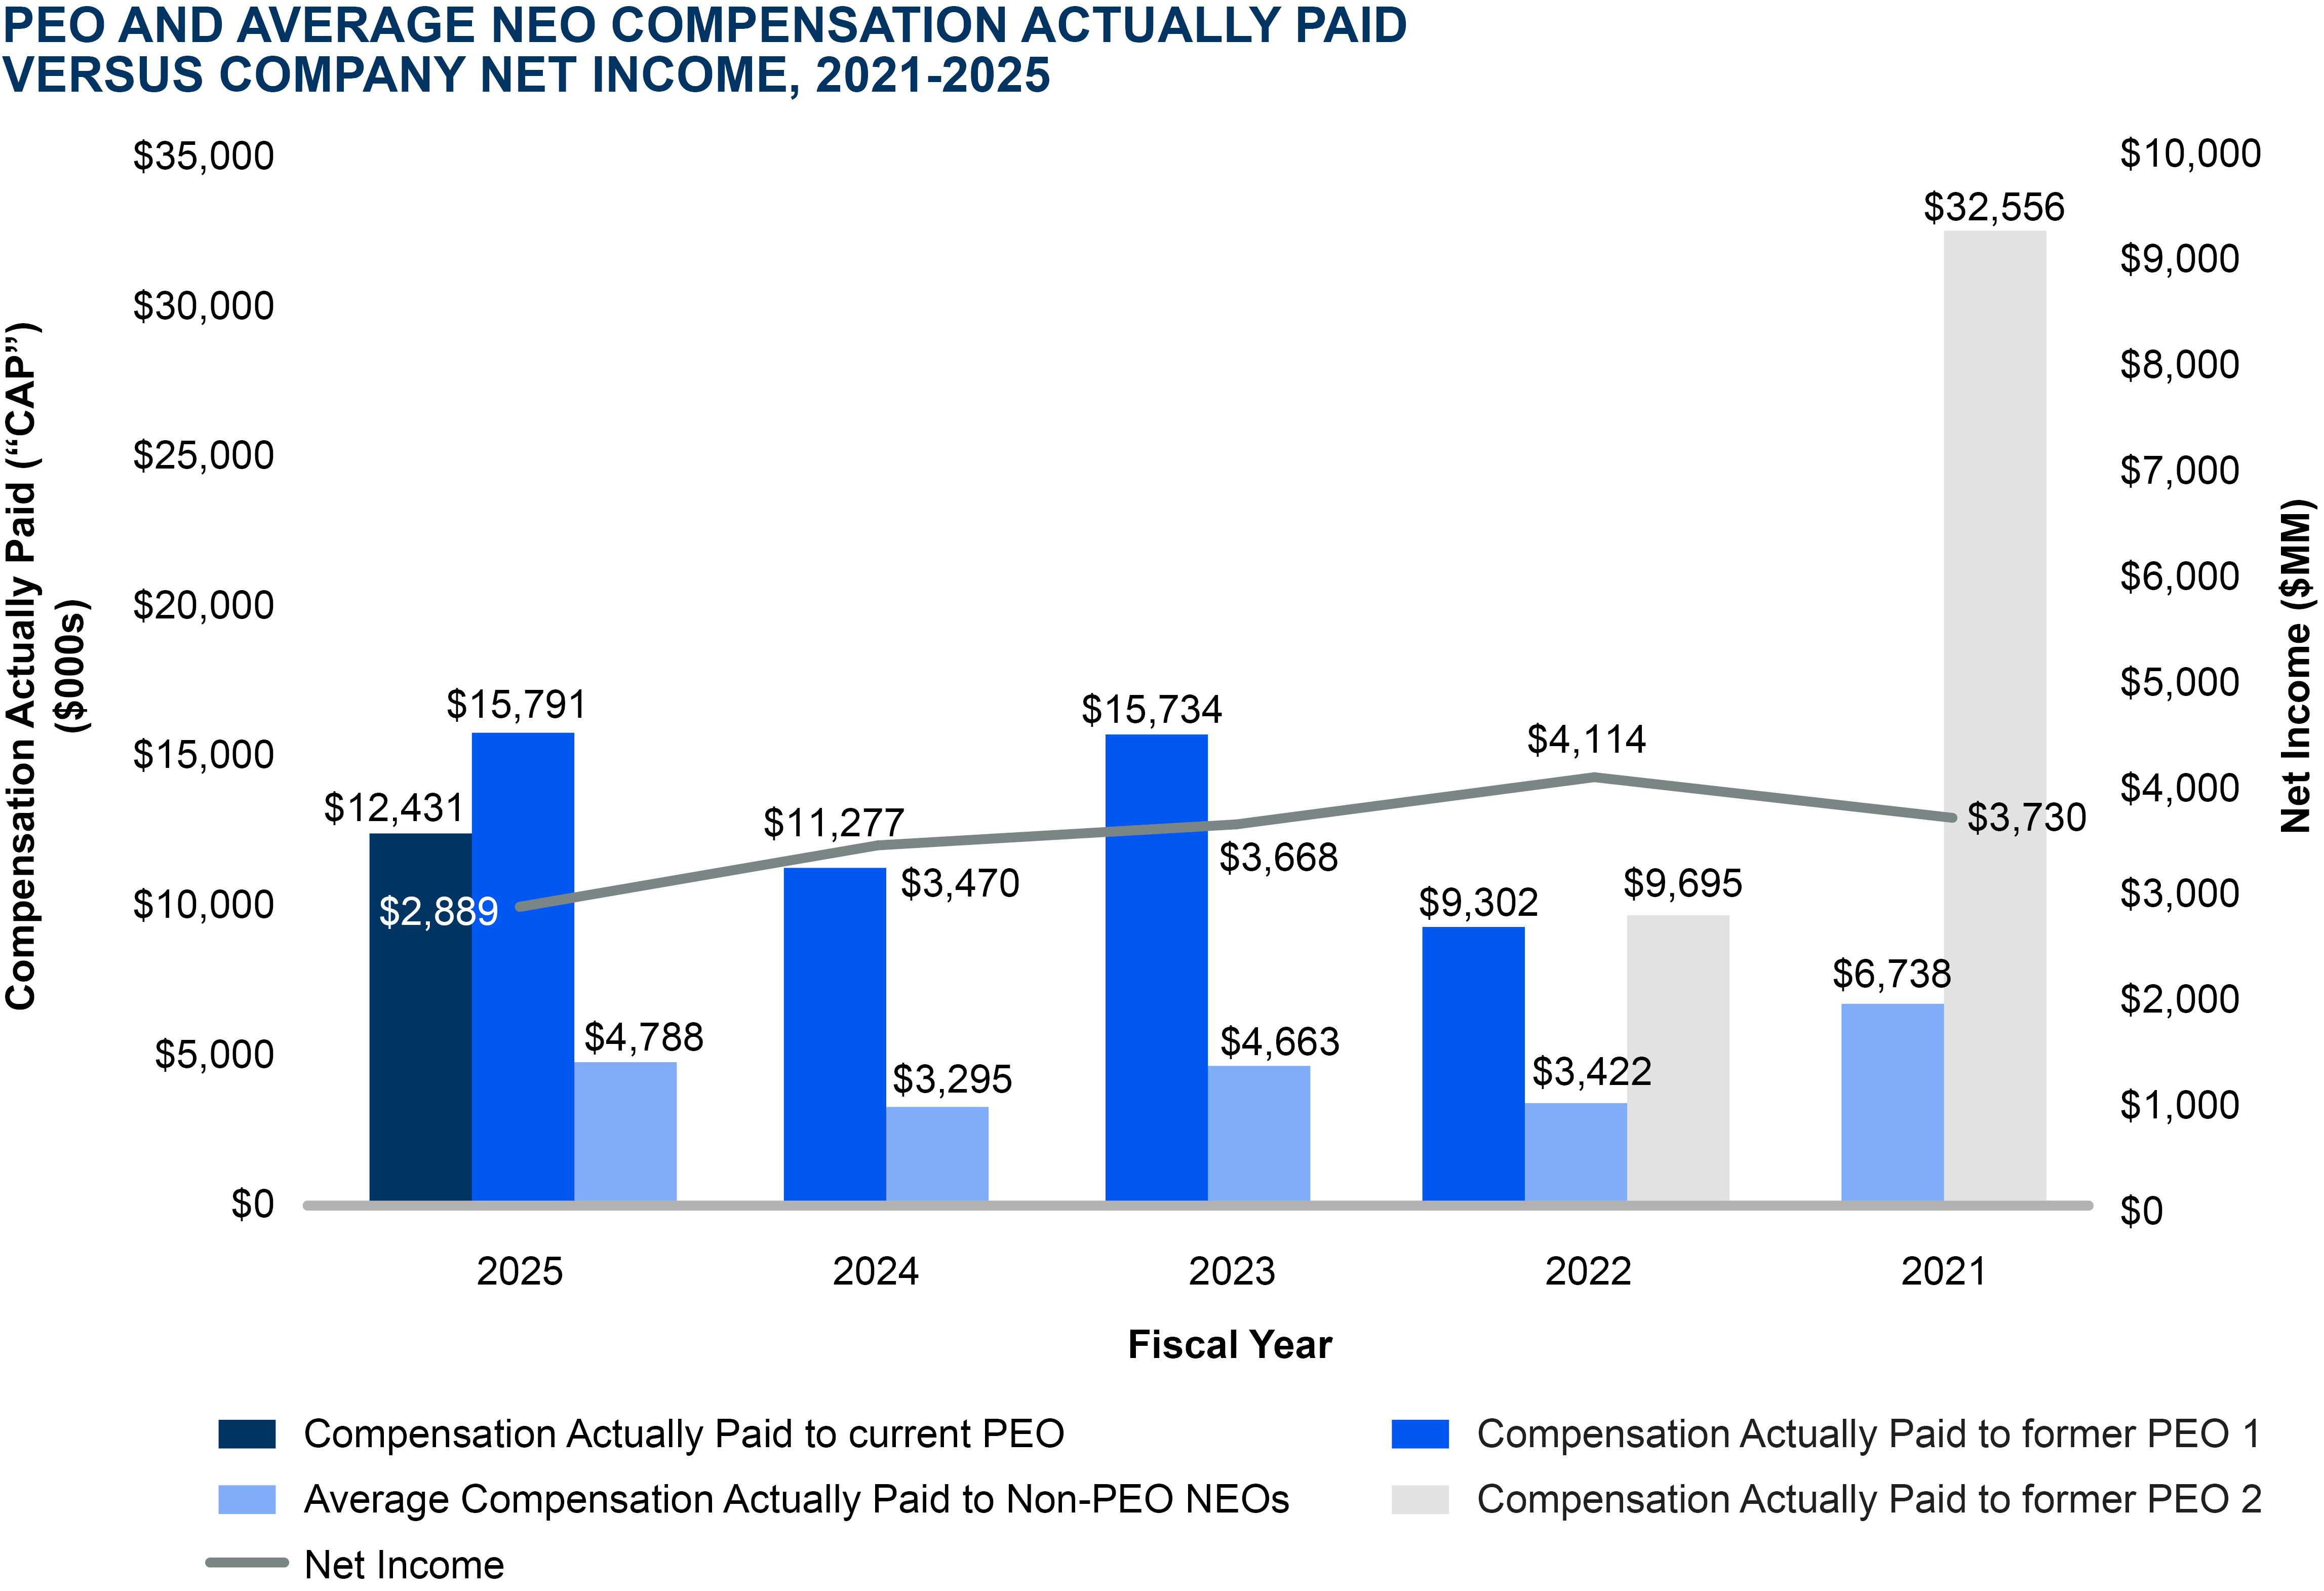
The following chart sets forth the relationship between “Compensation Actually Paid” to our PEO, the average of “Compensation Actually Paid” to our other NEOs and our net income during fiscal years 2021 through 2025.
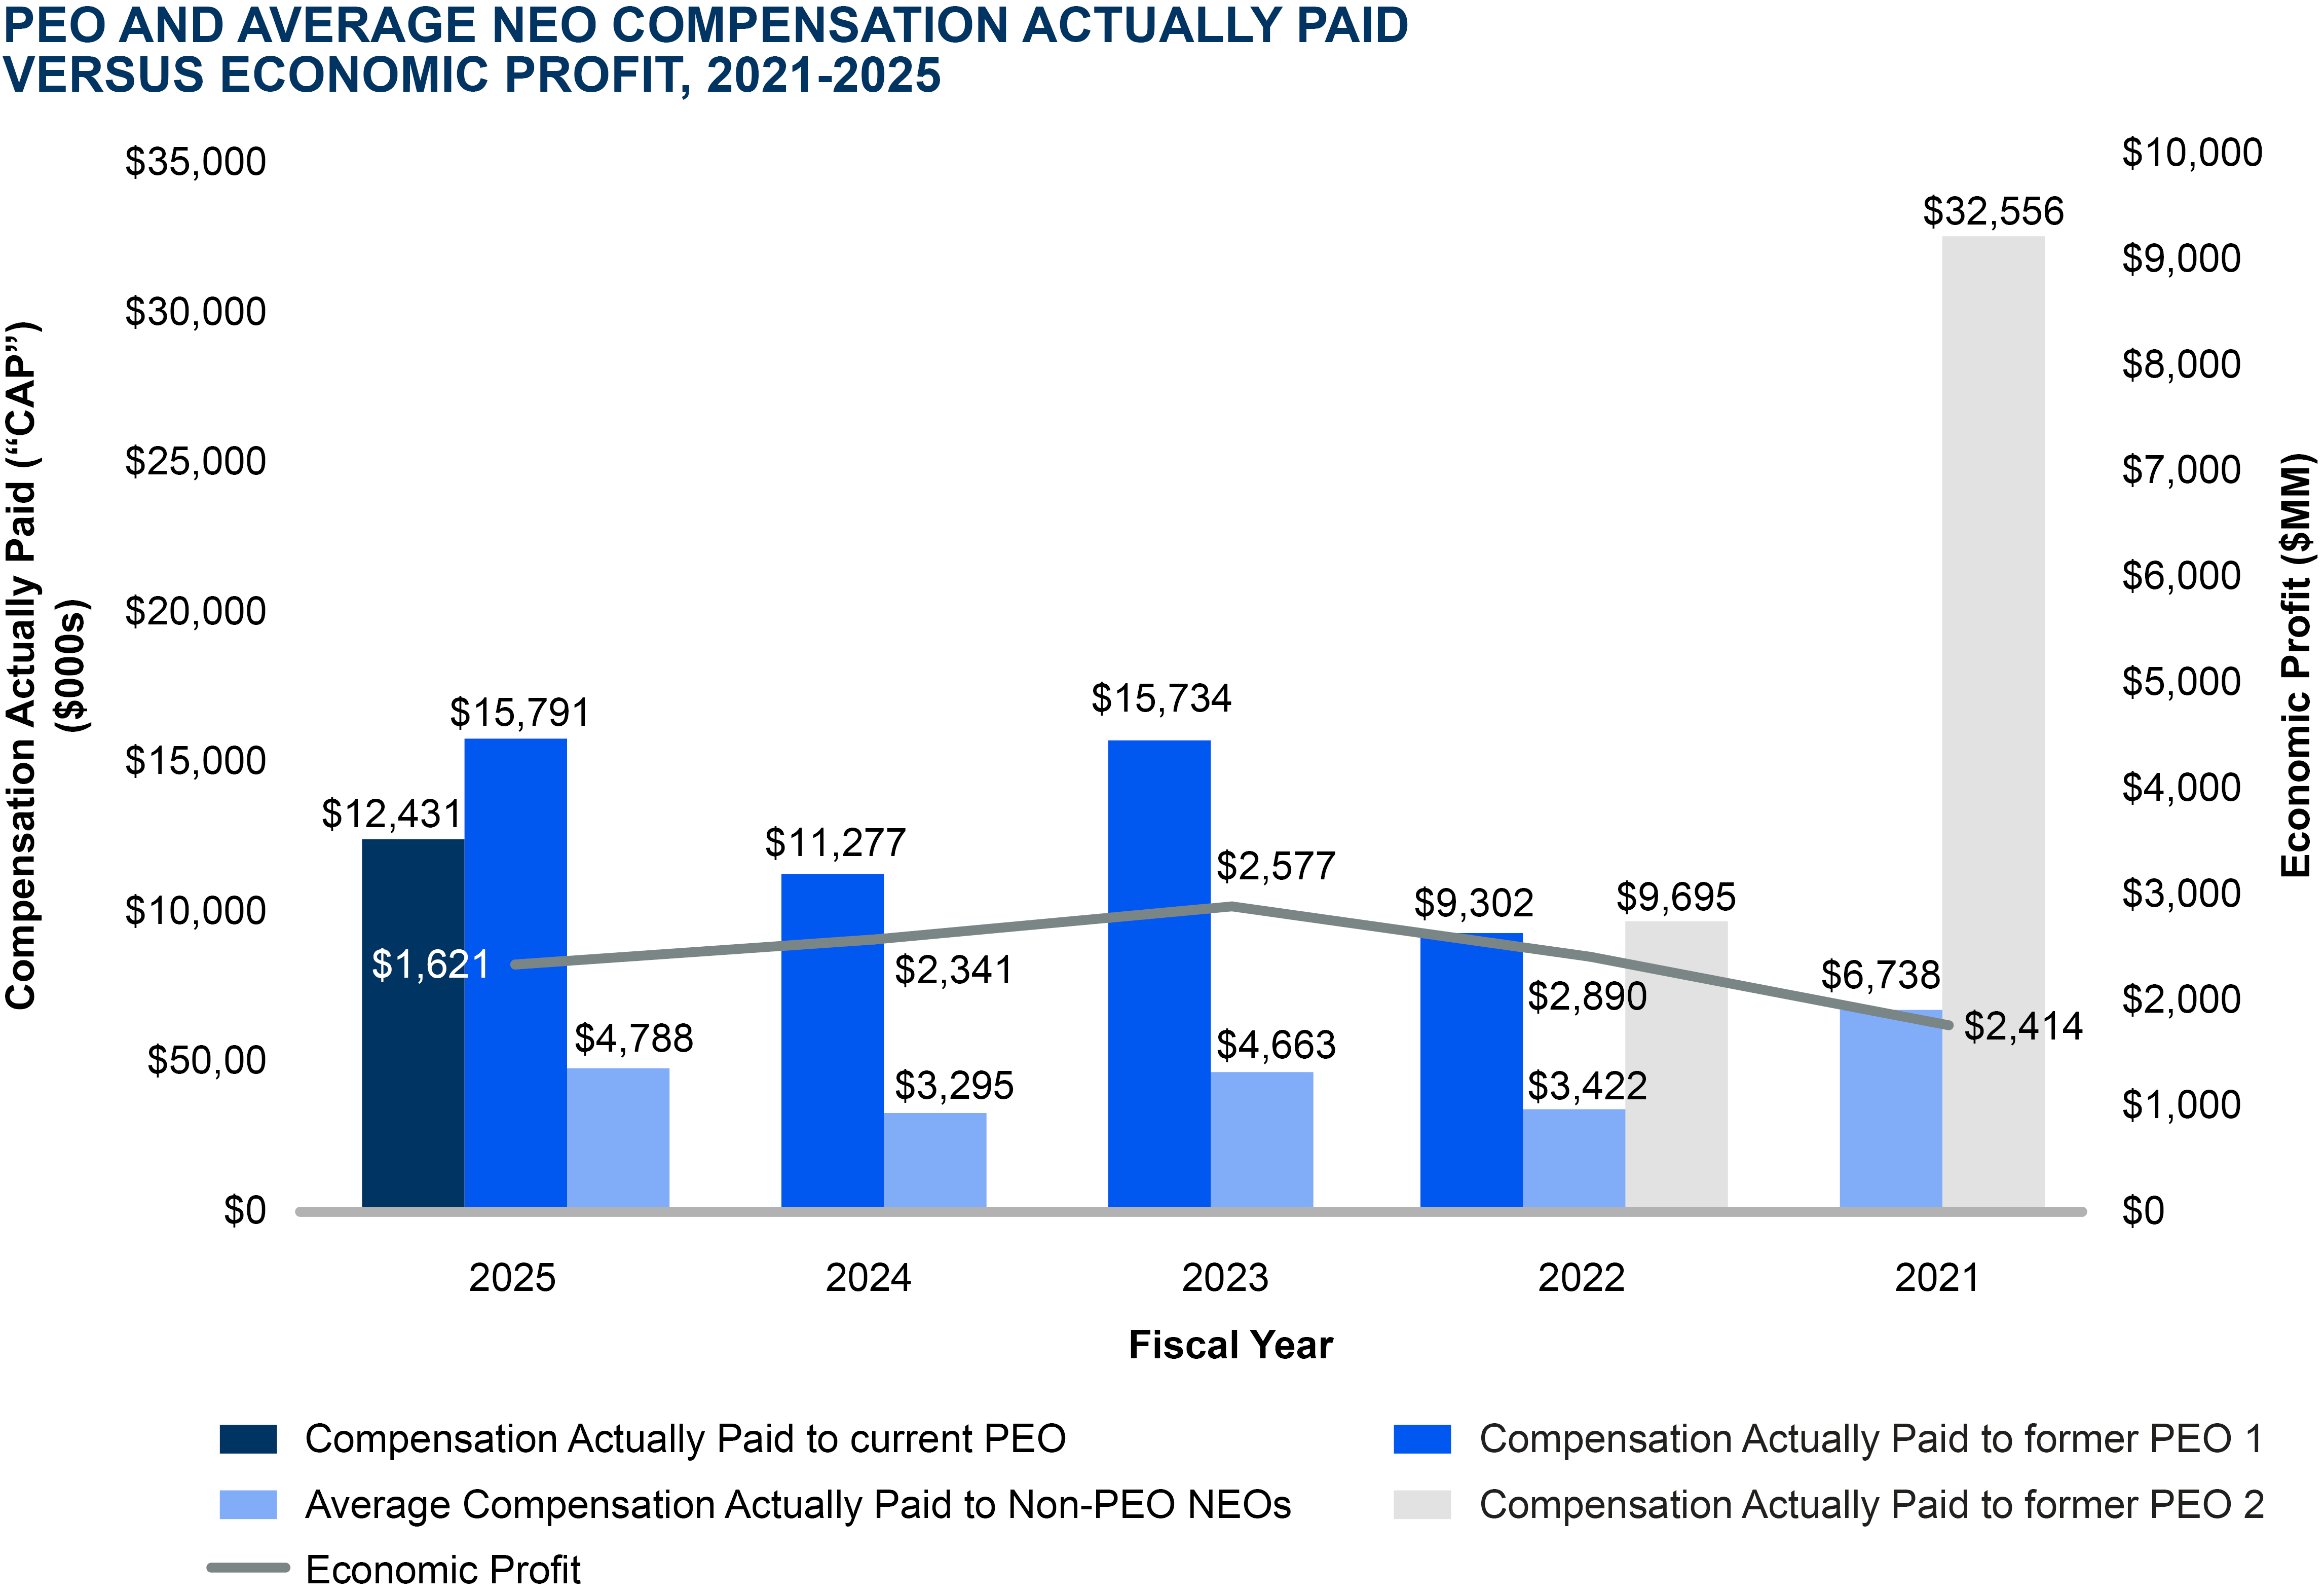
The following chart sets forth the relationship between “Compensation Actually Paid” to our PEO, the average of “Compensation Actually Paid” to our other NEOs and Economic Profit (CSX Cash Earnings or CCE) during fiscal years 2021 through 2025.
The following chart sets forth the relationship between “Compensation Actually Paid” to our PEO, the average of “Compensation Actually Paid” to our other NEOs, the Company’s cumulative TSR and the peer group’s cumulative TSR over the five-year period from 2021 through 2025. The peer group TSR is based on the S&P 500 Industrials Index.
| Most Important Performance Measures | Importance to the Company | ||||
| Average Annual Operating Income Growth Rate | uMeasures the average increase in operating income for each year of the LTIP cycle uAligns with the Company’s objective of profitable growth | ||||
| Economic Profit | uMeasures the Company’s ability to grow operating income while remaining focused on cost control and asset utilization uEncourages investments in growth projects that earn more than an expected rate of return | ||||
Relative Total Shareholder Return (rTSR) | uDesigned to appropriately align NEO payouts with share price performance relative to a transportation-related peer group | ||||
| Operating Income | uUsed to gauge the general health of the Company and to quantify operating profit margin uAligns with the Company’s objective of profitable growth | ||||
Operating Margin | uKey indicator of the Company’s efficiency uEncourages the Company to deliver results that grow the business while optimizing assets | ||||
Initiative-based Revenue Growth | uMeasures the Company’s ability to gain additional business on the CSX network through growth with new and existing customers uDirectly supports profitable growth by driving operating income | ||||
| Safety | uReinforces the critical importance on ensuring employees’ personal safety and the safety of fellow railroaders and upholding our commitment to protect customers’ freight and the communities in which we operate | ||||
Trip Plan Compliance (supplemental) | uEnsures the Company successfully executes the service plan for customers’ shipments based on our commitments uFocuses on reliable and accurate service for customers | ||||
Fuel Efficiency (supplemental) | uIndicates the Company’s fuel productivity over the distance traveled uSupports environmental stewardship by reducing carbon emissions | ||||