Pay vs Performance Disclosure - USD ($)
Dec. 31, 2025
Dec. 31, 2024
Dec. 31, 2023
Dec. 31, 2022
Dec. 31, 2021
Pay versus Performance
In this section, we are including the required disclosure for pay versus performance as defined by the SEC for our principal executive officer (“PEO”) and
Non-
PEO
NEOs and Company performance for the fiscal years listed below. Value of Initial Fixed $100 Investment Based On: (3) |
||||||||||||||||||||||||||||||||
Year (1) |
Summary Compensation Table Total PEO |
Compensation Actually Paid to PEO (2) |
Average Summary Compensation Table Total for Non- PEO NEOs |
Average Compensation Actually Paid to Non-PEO NEOs (2) |
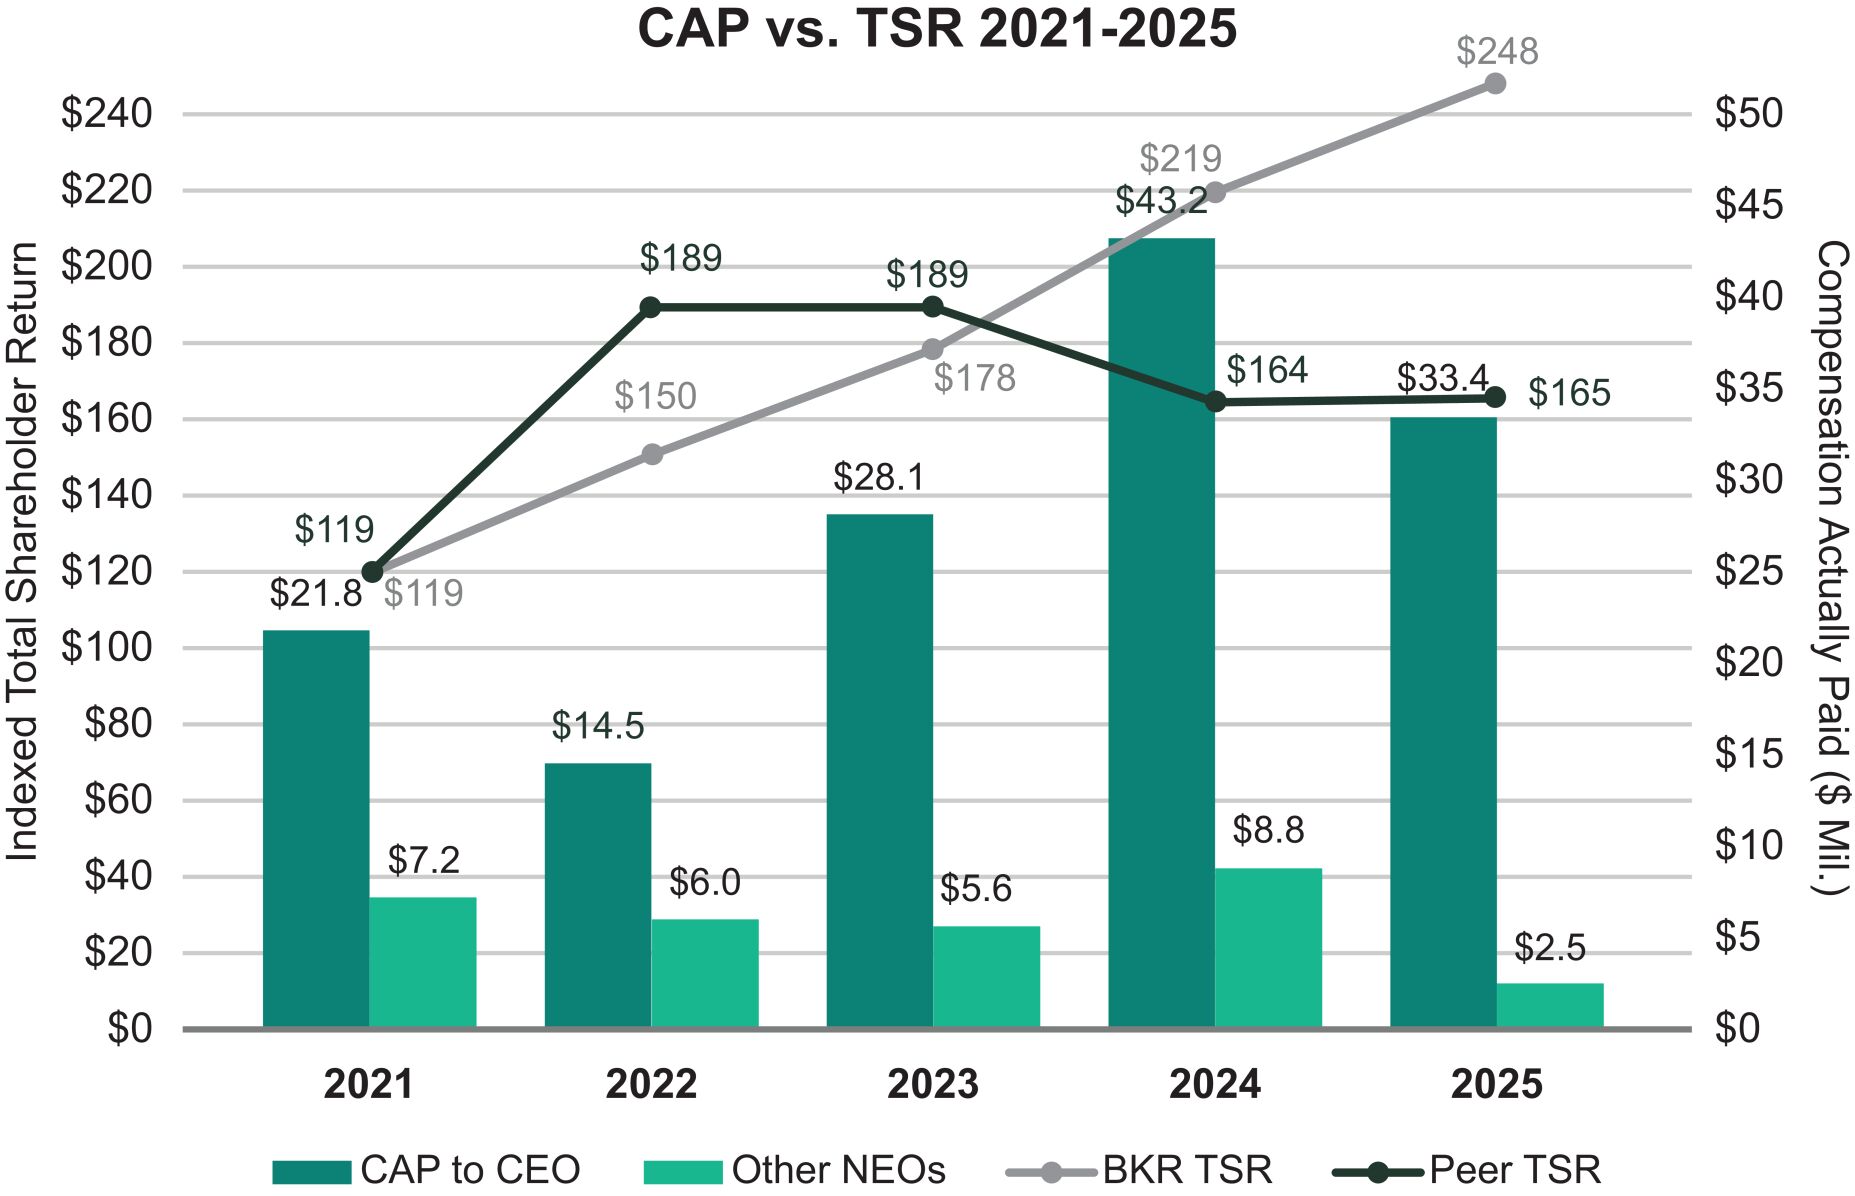
Baker Hughes TSR |
OSX Index TSR |
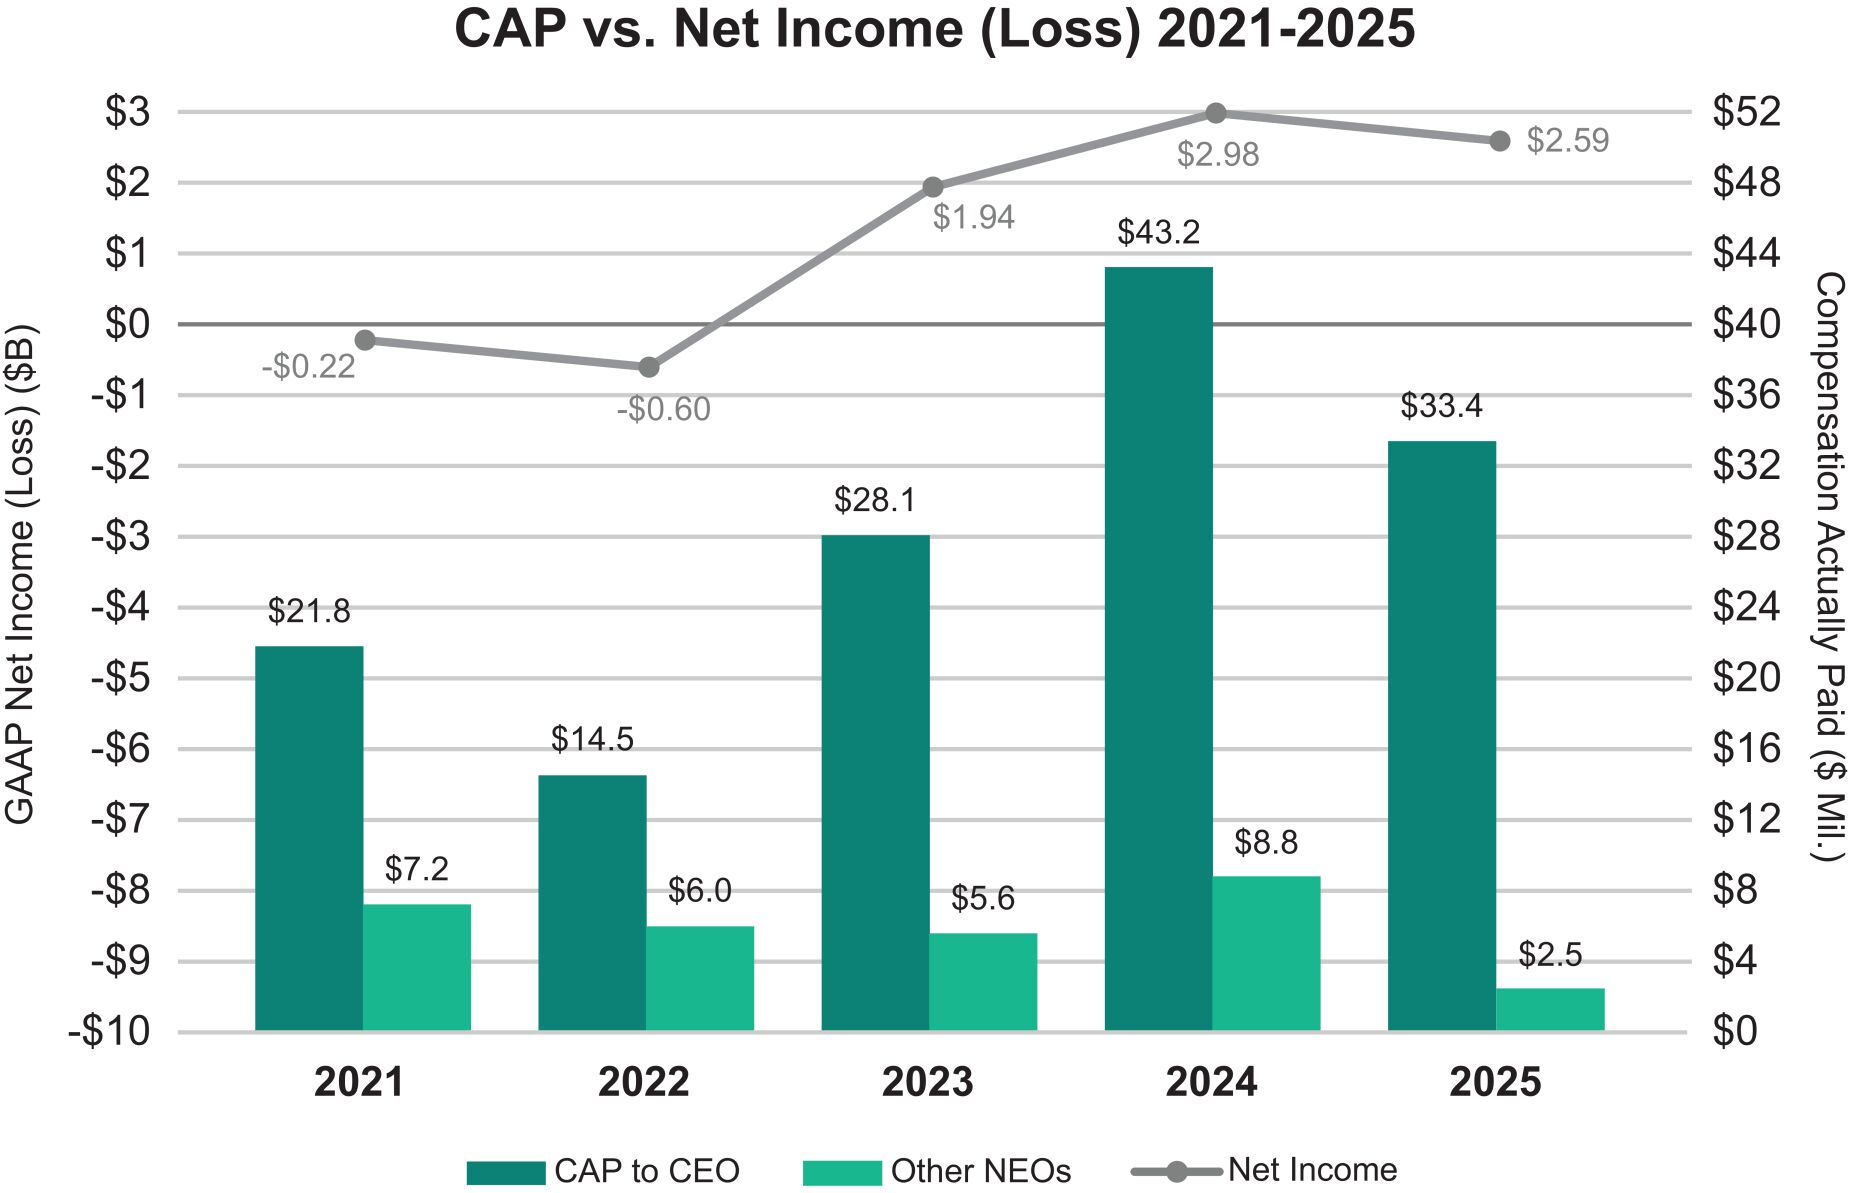
Net Income (Loss) $MM |
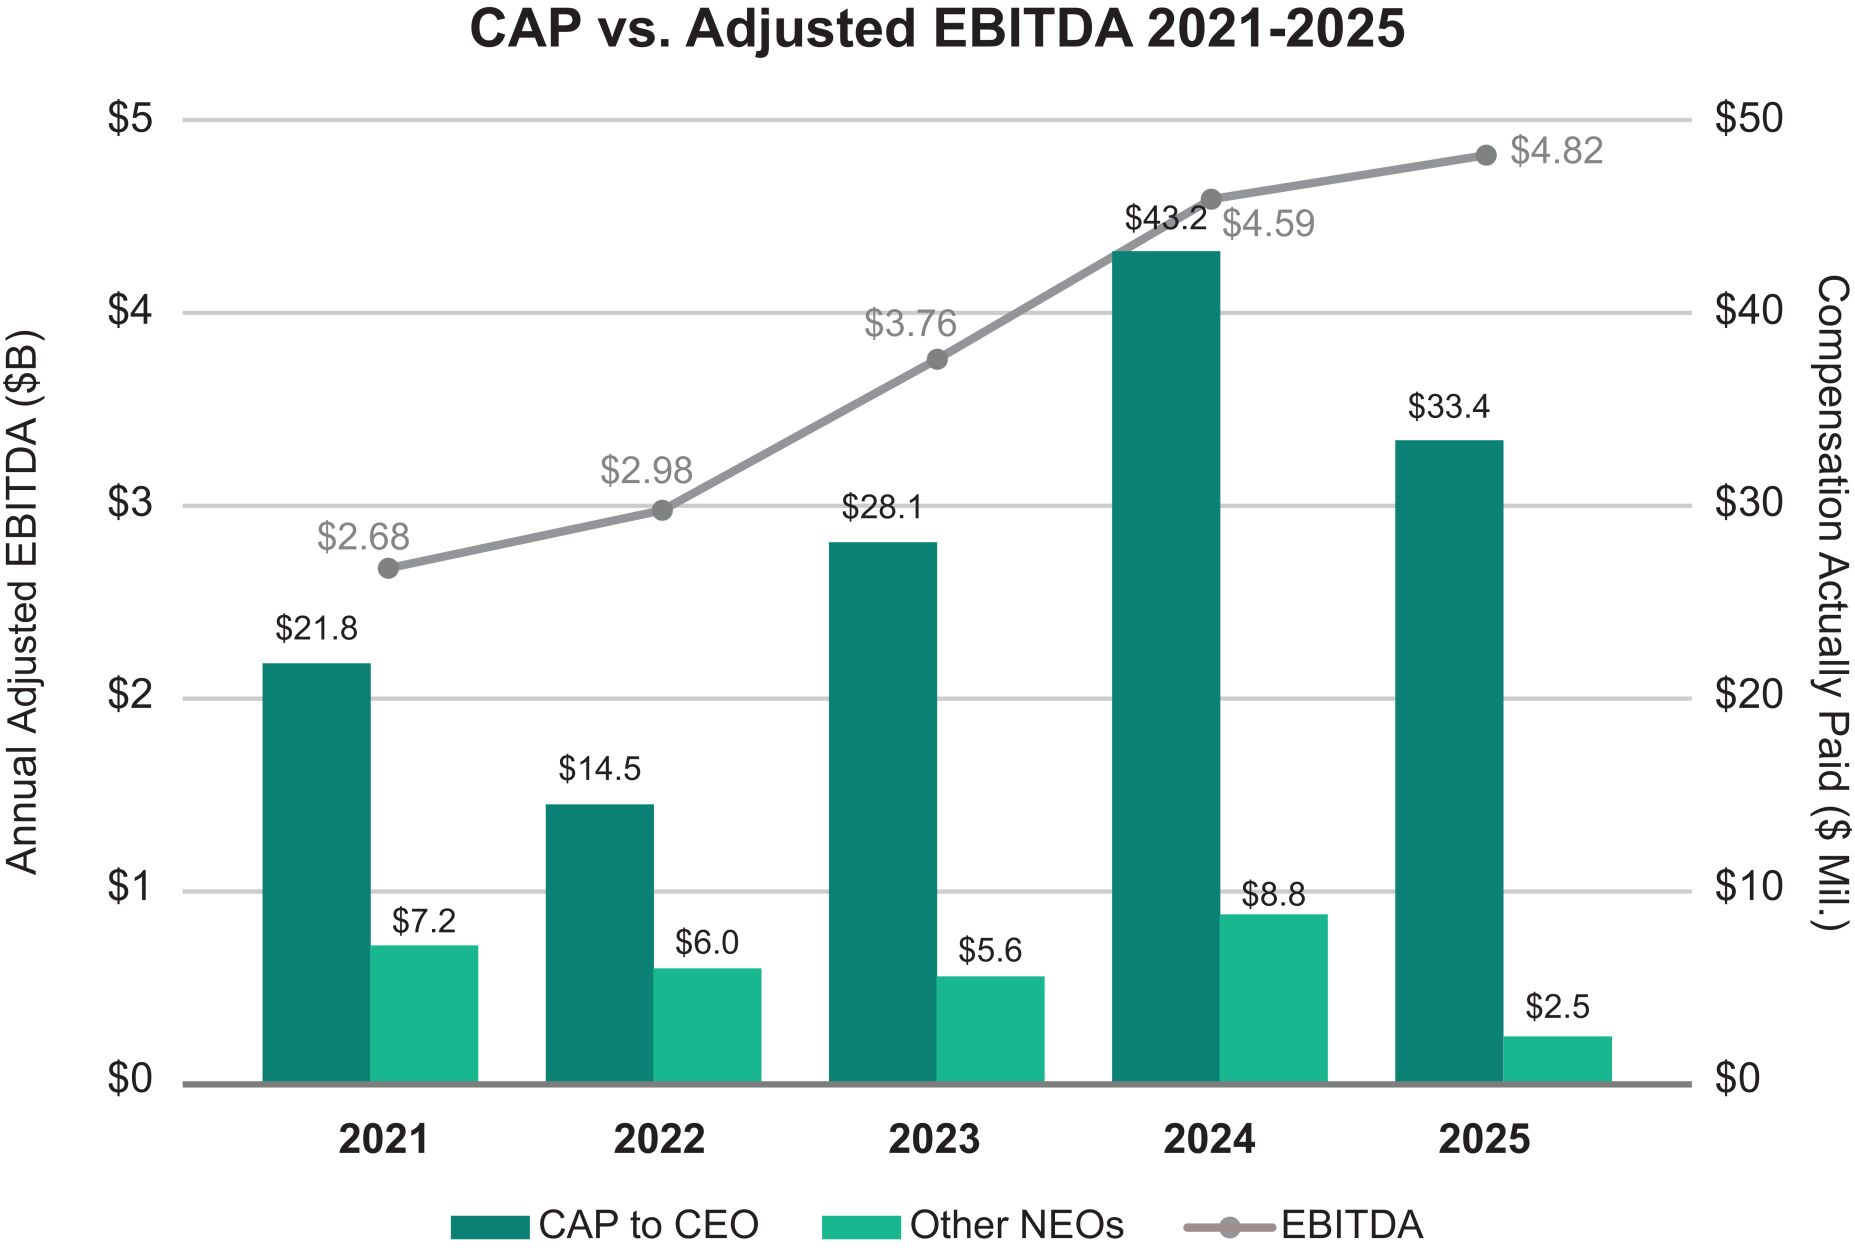
Adjusted EBITDA (4) $MM |
||||||||||||||||||||||||
2025 |
$21,363,825 |
$33,415,063 |
$4,933,143 |
$2,459,788 |
$248 |
$165 |
$ |
2,588 |
$4,820 |
|||||||||||||||||||||||
2024 |
$19,897,221 |
$43,208,733 |
$5,012,487 |
$8,757,543 |
$219 |
$164 |
$ |
2,979 |
$4,591 |
|||||||||||||||||||||||
2023 |
$22,186,164 |
$28,115,147 |
$5,292,423 |
$5,564,396 |
$178 |
$189 |
$ |
1,943 |
$3,763 |
|||||||||||||||||||||||
2022 |
$16,091,588 |
$14,511,432 |
$6,533,381 |
$5,987,467 |
$150 |
$189 |
$ |
(601 |
) |
$2,981 |
||||||||||||||||||||||
2021 |
$15,646,452 |
$21,790,884 |
$5,751,387 |
$7,226,540 |
$119 |
$119 |
$ |
(219 |
) |
$2,681 |
||||||||||||||||||||||
| (1) | For fiscal years 2025, 2024, 2023, 2022 and 2021, Mr. Simonelli was the PEO for the Company. |
| (2) | Compensation Actually Paid (“CAP”) is the Summary Compensation Table (“SCT”) total value for the period shown with adjustments for equity awards and pension (as described in more detail in the reconciliation table for our PEO and non-PEOs below). CAP reflects equity awards based on the mark-to-market |
| (3) | The Company calculates TSR with a base investment of $100 in a manner consistent with the stock performance graph disclosure requirements under Item 201(e) of Regulation S-K and is cumulative for the measurement periods beginning on December 31, 2020 and ending on December 31 of each 2025, 2024, 2023, 2022 and 2021, respectively. The peer group used for comparison for each of the fiscal years 2025, 2024, 2023, 2022 and 2021 is the Philadelphia Oil Service (“OSX”) Index. |
| (4) | We determined Adjusted EBITDA to be the most important financial performance measure used to link Company performance to Compensation Actually Paid to our PEO and Non-PEO NEOs in 2025. Adjusted EBITDA is a key measure in our Short-Term Incentive Plan and influences payouts across our compensation programs. Adjusted EBITDA is a non-GAAP measure. A reconciliation of GAAP to non-GAAP measures is included in the Proxy Statement in Annex A. |
The PEO Summary Compensation Table to CAP reconciliation is summarized in the following table:
Year |
SCT Total for PEO |
Minus SCT Change in Pension Value for PEO |
Plus Pension Value Service Cost (1) |
Minus SCT Equity for PEO |
Plus EOY* Fair Value of Equity Awards Granted During Fiscal Year that are Outstanding and Unvested at EOY |
Plus (Minus) Change from BOY* to EOY in Fair Value of Awards Granted in Any Prior Fiscal Year that are Outstanding and Unvested at EOY |
Plus Fair Value at Vesting Date of Awards Granted and Vested During the Fiscal Year |
Plus (Minus) Change in Fair Value from BOY to Vesting Date of Awards Granted in Any Prior Fiscal Year that Vested During the Fiscal Year |
Minus Fair Value at BOY of Awards Granted in Prior Year that were Forfeited During the Fiscal Year |
Value of Dividends or Other Earnings Paid on Stock or Option Awards not Otherwise Reflected in Fair Value or Total Compensation |
PEO CAP |
|||||||||||||||||||||||||||||||||
2025 |
21,363,825 |
911,327 |
— |
13,310,819 |
13,843,791 |
3,431,639 |
— |
8,997,953 |
— |
— |
33,415,063 |
|||||||||||||||||||||||||||||||||
2024 |
19,897,221 |
(171,000 |
) |
— |
12,425,422 |
21,433,752 |
5,332,118 |
— |
8,800,064 |
— |
— |
43,208,733 |
||||||||||||||||||||||||||||||||
2023 |
22,186,164 |
992,907 |
— |
12,588,972 |
15,121,517 |
2,022,918 |
— |
2,366,427 |
— |
— |
28,115,147 |
|||||||||||||||||||||||||||||||||
2022 |
16,091,588 |
— |
— |
12,056,262 |
11,277,242 |
149,308 |
— |
(950,444 |
) |
— |
— |
14,511,432 |
||||||||||||||||||||||||||||||||
2021 |
15,646,452 |
— |
— |
10,856,292 |
13,182,502 |
2,328,558 |
— |
1,489,664 |
— |
— |
21,790,884 |
|||||||||||||||||||||||||||||||||
*“EOY” = End of Year, “BOY” = Beginning of Year
Executive Compensation
The Average Other NEOs Summary Compensation Table to CAP reconciliation is summarized in the
following
table: Year |
SCT Total for Average Other NEOs |
Minus SCT Change in Pension Value for Average Other NEOs |
Plus Pension Value Service Cost (1) |
Minus SCT Equity for Average Other NEOs |
Plus EOY Fair Value of Equity Awards Granted During Fiscal Year that are Outstanding and Unvested at EOY |
Plus (Minus) Change from BOY to EOY in Fair Value of Awards Granted in Any Prior Fiscal Year that are Outstanding and Unvested at EOY |
Plus Fair Value at Vesting Date of Awards Granted and Vested During the Fiscal Year |
Plus (Minus) Change in Fair Value from BOY to Vesting Date of Awards Granted in Any Prior Fiscal Year that Vested During the Fiscal Year |
Minus Fair Value at BOY of Awards Granted in Prior Year that were Forfeited During the Fiscal Year |
Value of Dividends or Other Earnings Paid on Stock or Option Awards not Otherwise Reflected in Fair Value or Total Compensation |
Average Other NEOs CAP |
|||||||||||||||||||||||||||||||||
2025 (1) |
4,933,143 |
38,047 |
— |
2,952,804 |
1,615,144 |
274,199 |
86,076 |
892,479 |
(2,350,402 |
) |
— |
2,459,788 |
||||||||||||||||||||||||||||||||
2024 (2) |
5,012,487 |
514 |
— |
2,625,312 |
4,416,916 |
1,390,290 |
— |
563,677 |
— |
— |
8,757,543 |
|||||||||||||||||||||||||||||||||
2023 (3) |
5,292,423 |
43,117 |
— |
2,641,397 |
2,765,060 |
360,489 |
— |
248,028 |
(417,089 |
) |
— |
5,564,396 |
||||||||||||||||||||||||||||||||
2022 (4) |
6,533,381 |
— |
— |
4,542,718 |
4,004,019 |
104,392 |
— |
(111,607 |
) |
— |
— |
5,987,467 |
||||||||||||||||||||||||||||||||
2021 (5) |
5,751,387 |
— |
— |
2,678,371 |
3,247,540 |
540,265 |
— |
365,719 |
— |
— |
7,226,540 |
|||||||||||||||||||||||||||||||||
| (1) | The average CAP for 2025 comprised of compensation for Mr. Moghal, Ms. Borras, Mr. Gatti, Ms. Magno, Ms. Buese and Mr. Ramaswamy. |
| (2) | The average CAP for 2024 comprised of compensation for Ms. Buese, Ms. Borras, Mr. Ramaswamy, and Ms. Magno. |
| (3) | The average CAP for 2023 comprised of compensation for Ms. Buese, Ms. Borras, Mr. Ramaswamy, Mr. Apostolides, Mr. Christie, and Ms. Jones. |
| (4) | The average CAP for 2022 comprised of compensation for Mr. Worrell, Ms. Buese, Ms. Borras, Mr. Christie, and Mr. Saunders. |
| (5) | The average CAP for 2021 comprised of compensation for Mr. Worrell, Ms. Borras, Mr. Christie, and Mr. Saunders. |
Year |
SCT Total for PEO |
Minus SCT Change in Pension Value for PEO |
Plus Pension Value Service Cost (1) |
Minus SCT Equity for PEO |
Plus EOY* Fair Value of Equity Awards Granted During Fiscal Year that are Outstanding and Unvested at EOY |
Plus (Minus) Change from BOY* to EOY in Fair Value of Awards Granted in Any Prior Fiscal Year that are Outstanding and Unvested at EOY |
Plus Fair Value at Vesting Date of Awards Granted and Vested During the Fiscal Year |
Plus (Minus) Change in Fair Value from BOY to Vesting Date of Awards Granted in Any Prior Fiscal Year that Vested During the Fiscal Year |
Minus Fair Value at BOY of Awards Granted in Prior Year that were Forfeited During the Fiscal Year |
Value of Dividends or Other Earnings Paid on Stock or Option Awards not Otherwise Reflected in Fair Value or Total Compensation |
PEO CAP |
|||||||||||||||||||||||||||||||||
2025 |
21,363,825 |
911,327 |
— |
13,310,819 |
13,843,791 |
3,431,639 |
— |
8,997,953 |
— |
— |
33,415,063 |
|||||||||||||||||||||||||||||||||
2024 |
19,897,221 |
(171,000 |
) |
— |
12,425,422 |
21,433,752 |
5,332,118 |
— |
8,800,064 |
— |
— |
43,208,733 |
||||||||||||||||||||||||||||||||
2023 |
22,186,164 |
992,907 |
— |
12,588,972 |
15,121,517 |
2,022,918 |
— |
2,366,427 |
— |
— |
28,115,147 |
|||||||||||||||||||||||||||||||||
2022 |
16,091,588 |
— |
— |
12,056,262 |
11,277,242 |
149,308 |
— |
(950,444 |
) |
— |
— |
14,511,432 |
||||||||||||||||||||||||||||||||
2021 |
15,646,452 |
— |
— |
10,856,292 |
13,182,502 |
2,328,558 |
— |
1,489,664 |
— |
— |
21,790,884 |
|||||||||||||||||||||||||||||||||
Year |
SCT Total for Average Other NEOs |
Minus SCT Change in Pension Value for Average Other NEOs |
Plus Pension Value Service Cost (1) |
Minus SCT Equity for Average Other NEOs |
Plus EOY Fair Value of Equity Awards Granted During Fiscal Year that are Outstanding and Unvested at EOY |
Plus (Minus) Change from BOY to EOY in Fair Value of Awards Granted in Any Prior Fiscal Year that are Outstanding and Unvested at EOY |
Plus Fair Value at Vesting Date of Awards Granted and Vested During the Fiscal Year |
Plus (Minus) Change in Fair Value from BOY to Vesting Date of Awards Granted in Any Prior Fiscal Year that Vested During the Fiscal Year |
Minus Fair Value at BOY of Awards Granted in Prior Year that were Forfeited During the Fiscal Year |
Value of Dividends or Other Earnings Paid on Stock or Option Awards not Otherwise Reflected in Fair Value or Total Compensation |
Average Other NEOs CAP |
|||||||||||||||||||||||||||||||||
2025 (1) |
4,933,143 |
38,047 |
— |
2,952,804 |
1,615,144 |
274,199 |
86,076 |
892,479 |
(2,350,402 |
) |
— |
2,459,788 |
||||||||||||||||||||||||||||||||
2024 (2) |
5,012,487 |
514 |
— |
2,625,312 |
4,416,916 |
1,390,290 |
— |
563,677 |
— |
— |
8,757,543 |
|||||||||||||||||||||||||||||||||
2023 (3) |
5,292,423 |
43,117 |
— |
2,641,397 |
2,765,060 |
360,489 |
— |
248,028 |
(417,089 |
) |
— |
5,564,396 |
||||||||||||||||||||||||||||||||
2022 (4) |
6,533,381 |
— |
— |
4,542,718 |
4,004,019 |
104,392 |
— |
(111,607 |
) |
— |
— |
5,987,467 |
||||||||||||||||||||||||||||||||
2021 (5) |
5,751,387 |
— |
— |
2,678,371 |
3,247,540 |
540,265 |
— |
365,719 |
— |
— |
7,226,540 |
|||||||||||||||||||||||||||||||||
Most Important Performance Measures |
Adjusted EBITDA |
FCF |
ROIC |
Relative TSR |
non-GAAP
measure. A reconciliation of GAAP to non-GAAP
measures is included in the Proxy Statement in Annex A.