Pay vs Performance Disclosure
Feb. 14, 2022
Dec. 31, 2022
Dec. 31, 2025
USD ($)
$ / shares
Dec. 31, 2024
USD ($)
$ / shares
Dec. 31, 2023
USD ($)
$ / shares
Dec. 31, 2022
USD ($)
$ / shares
Dec. 31, 2021
USD ($)
$ / shares
2025 Pay Versus Performance
As required by Section 953(a) of the Dodd-Frank Wall Street Reform and Consumer Protection Act, and Item 402(v) of Regulation S-K, we are providing the following information about the relationship between executive Compensation Actually Paid (“CAP”) to our CEOs and to our non-CEO NEOs and certain financial performance of the Company. CAP, as determined under SEC requirements, does not reflect the actual amount of compensation earned by or paid to our executive officers during a covered year. For further information concerning the Company’s variable pay-for-performance philosophy and how the Company aligns executive compensation with the Company’s performance, refer to the “Compensation Discussion and Analysis (CD&A)” section above.
Year | CEO | Former CEO | Other NEO Pay | Value of Initial Fixed $100 Invested Based on: | Net Income (in millions) | Adjusted EPS(8) | ||||||||||||||||||||||||||
Summary Compen- sation Table Total for CEO | Compen- sation Actually Paid to CEO(6) | Summary Compen- sation Table Total for Former CEO | Compensation Actually Paid to Former CEO(7) | Average Summary Compen- sation Table Total for Other NEO's | Average Compen- sation Actually Paid to Other NEO's | Total Share- holder Return (TSR) | Dow Jones Utilities Index Peer Group TSR | |||||||||||||||||||||||||
2025(1) | $13,197,800 | $26,178,851 | $0 | $0 | $3,689,768 | $6,200,227 | $216 | $159 | $1,013 | $1.90 | ||||||||||||||||||||||
2024(2) | $12,784,970 | $34,023,789 | $0 | $0 | $3,656,310 | $7,905,729 | $185 | $137 | $845 | $1.75 | ||||||||||||||||||||||
2023(3) | $9,216,680 | $9,913,336 | $0 | $0 | $2,869,181 | $3,127,806 | $129 | $111 | $674 | $1.60 | ||||||||||||||||||||||
2022(4) | $7,113,506 | $6,720,202 | $1,352,993 | ($3,953,194) (6) | $2,221,932 | $1,305,705 | $128 | $119 | $792 | $1.47 | ||||||||||||||||||||||
2021(5) | $0 | $0 | $9,535,782 | $13,795,347 | $2,491,010 | $3,453,360 | $125 | $117 | $589 | $1.37 | ||||||||||||||||||||||
(1) | For 2025, the table includes Lloyd Yates as CEO. The other NEOs were Shawn Anderson, Melody Birmingham, William Jefferson and Michael Luhrs. |
(2) | For 2024, the table includes Lloyd Yates as CEO. The other NEOs were Shawn Anderson, Melody Birmingham, William Jefferson and Michael Luhrs. |
(3) | For 2023, the table includes Lloyd Yates as CEO. The other NEOs were Donald E. Brown, Shawn Anderson, Melody Birmingham, William Jefferson and Michael Luhrs. |
(4) | For 2022, the table includes Lloyd Yates as CEO and Joseph Hamrock as Former CEO. The other NEOs were Donald E. Brown, Shawn Anderson, Melody Birmingham, William Jefferson and Pablo A. Vegas. |
(5) | For 2021, the table includes Joseph Hamrock as CEO. The other NEOs were Donald E. Brown, Pablo A. Vegas, Violet G. Sistovaris and Charles E. Shafer. |
(6) | In accordance with the SEC rules, the amounts reported in these columns for each year were calculated by making the adjustments shown in the following tables to amounts reported for the CEOs in the Summary Compensation Table in the total column. Amounts for each year do not reflect the actual amount of compensation earned by or paid to the CEO during the applicable year. |
(7) | A pro rata portion of all outstanding, unvested equity award vesting in connection with Mr. Hamrock’s retirement in 2022. |
(8) | Adjusted EPS is a non-GAAP financial measure. Appendix A to this Proxy Statement contains a full reconciliation of GAAP EPS to Adjusted EPS. |
(1) | For 2025, the table includes Lloyd Yates as CEO. The other NEOs were Shawn Anderson, Melody Birmingham, William Jefferson and Michael Luhrs. |
(2) | For 2024, the table includes Lloyd Yates as CEO. The other NEOs were Shawn Anderson, Melody Birmingham, William Jefferson and Michael Luhrs. |
(3) | For 2023, the table includes Lloyd Yates as CEO. The other NEOs were Donald E. Brown, Shawn Anderson, Melody Birmingham, William Jefferson and Michael Luhrs. |
(4) | For 2022, the table includes Lloyd Yates as CEO and Joseph Hamrock as Former CEO. The other NEOs were Donald E. Brown, Shawn Anderson, Melody Birmingham, William Jefferson and Pablo A. Vegas. |
(5) | For 2021, the table includes Joseph Hamrock as CEO. The other NEOs were Donald E. Brown, Pablo A. Vegas, Violet G. Sistovaris and Charles E. Shafer. |
To calculate CAP, the following amounts were deducted from and added to Summary Compensation Table (“SCT”) total compensation:
CEO SCT to CAP Reconciliation:
Year | Reported SCT Total for Covered Year | Reported Value of Equity Awards in SCT for Covered Year(a) | Equity Award Adjustments for Covered Year(b) | Reported Change in the Actuarial Present Value of Pension Benefits for Covered Year | Pension Benefits Adjustments for Covered Year | Compensation Actually Paid for Covered Year | |||||||||||||||||||||||||||||
2025 | $13,197,800 | – | $9,619,864 | + | $22,600,915 | – | $0 | + | $0 | = | $26,178,851 | ||||||||||||||||||||||||
(a) | Represents the amounts reported in the Summary Compensation Table in the Stock Awards Column. |
(b) | See reconciliation of the Equity Award Adjustments below. |
(c) | See reconciliation of the Average Pension Benefits Adjustments below. |
CEO Equity Adjustment to CAP Reconciliation
Year | Covered Year- End Fair Value of Equity Awards Granted During Covered Year That Remained Outstanding and Unvested as of Last Day of Covered Year ($) | Change in Fair Value as of Last Day of Covered Year (as compared to Last Day of Prior Year) of Equity Awards Granted Prior to Covered Year and Outstanding and Unvested as of Last Day of Covered Year ($) | Vesting Date Fair Value of Equity Awards Granted During Covered Year that Vested During Covered Year ($) | Change in Fair Value from Last Day of Prior Year to Vesting Date of Equity Awards Granted Prior to Covered Year that Vested During Covered Year ($) | Fair Value as of Last Day of Prior Year of Equity Awards that Failed to Meet Vesting Conditions During the Covered Year ($) | Value of Dividends or Other Earnings Paid on Equity Awards Not Otherwise Included as of Last Day of Covered Year ($) | Total - Inclusion of Equity Values ($) | ||||||||||||||||
2025 | $14,535,760 | $7,020,374 | $0 | $1,044,781 | $0 | $0 | $22,600,915 | ||||||||||||||||
CEO and Other NEOs Pension Adjustment to CAP Reconciliation
Year | Plan | Service Cost | Prior Service Cost | Total Average Pension Benefit Adjustment (Service Cost ÷ by number of Other NEOs in applicable year) | ||||||||||
2025 | Pension Plan | $0 | $0 | $0 | ||||||||||
Pension Restoration Plan | $0 | $0 | $0 | |||||||||||
Total | $0 | $0 | $0 | |||||||||||
To calculate CAP, the following amounts were deducted from and added to Summary Compensation Table (“SCT”) total compensation:
Other NEOs SCT to CAP Reconciliation:
Year | Average Reported SCT Total for Covered Year | Average Reported Value of Equity Awards in SCT for Covered Year(a) | Average Equity Award Adjustments for Covered Year(b) | Average Reported Change in the Actuarial Present Value of Pension Benefits for Covered Year | Average Pension Benefits Adjustments for Covered Year(c) | Average of Compensation Actually Paid for Covered Year | |||||||||||||||||||||||||||||
2025 | $3,689,768 | – | $2,165,412 | + | $4,675,871 | – | $0 | + | $0 | = | $6,200,227 | ||||||||||||||||||||||||
(a) | Represents the amounts reported in the Summary Compensation Table in the Stock Awards Column. |
(b) | See reconciliation of the Equity Award Adjustments below. |
(c) | See reconciliation of the Average Pension Benefits Adjustments below. |
Other NEOs Equity Adjustment to CAP Reconciliation
Year | Average Covered Year- End Fair Value of Equity Awards Granted During Covered Year That Remained Outstanding and Unvested as of Last Day of Covered Year ($) | Average Change in Fair Value as of Last Day of Covered Year (as compared to Last Day of Prior Year) of Equity Awards Granted Prior to Covered Year and Outstanding and Unvested as of Last Day of Covered Year ($) | Average Vesting Date Fair Value of Equity Awards Granted During Covered Year that Vested During Covered Year ($) | Average Change in Fair Value from Last Day of Prior Year to Vesting Date of Equity Awards Granted Prior to Covered Year that Vested During Covered Year ($) | Average Fair Value as of Last Day of Prior Year of Equity Awards that Failed to Meet Vesting Conditions During the Covered Year ($) | Average Value of Dividends or Other Earnings Paid on Equity Awards Not Otherwise Included as of Last Day of Covered Year ($) | Total - Average Inclusion of Equity Values ($) | ||||||||||||||||
2025 | $3,046,028 | $1,477,419 | $0 | $152,424 | $0 | $0 | $4,675,871 | ||||||||||||||||
Fair values reported in this table are computed in accordance with FASB ASC Topic 718.
CEO and Other NEOs Pension Adjustment to CAP Reconciliation
Year | Plan | Service Cost | Prior Service Cost | Total Average Pension Benefit Adjustment (Service Cost ÷ by number of Other NEOs in applicable year) | ||||||||||
2025 | Pension Plan | $0 | $0 | $0 | ||||||||||
Pension Restoration Plan | $0 | $0 | $0 | |||||||||||
Total | $0 | $0 | $0 | |||||||||||
CAP* versus Total Shareholder Return
The graph below represents the relationship between CAP to our CEO, the average CAP to our Non-CEO NEOs and Total Shareholder Return (“TSR”) for NiSource and the Dow Jones U.S. Utilities Index.
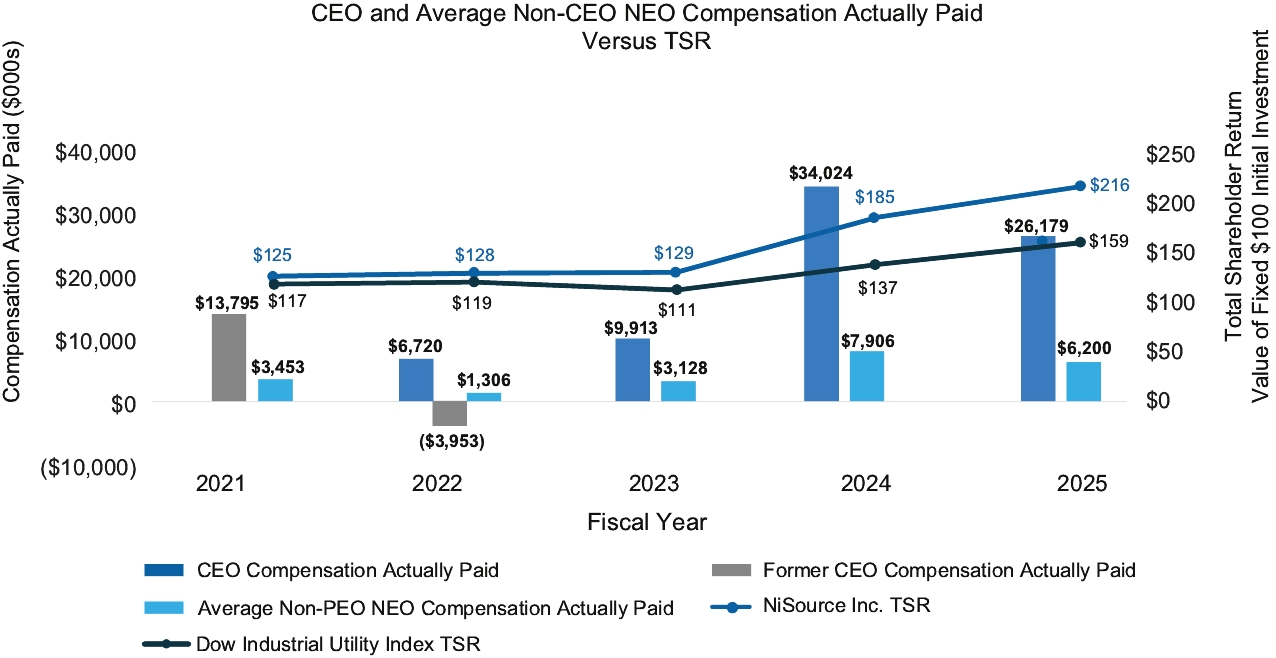
*CAP, as determined under SEC requirements, does not reflect the actual amount of compensation earned by or paid to our executive officers during a covered year.
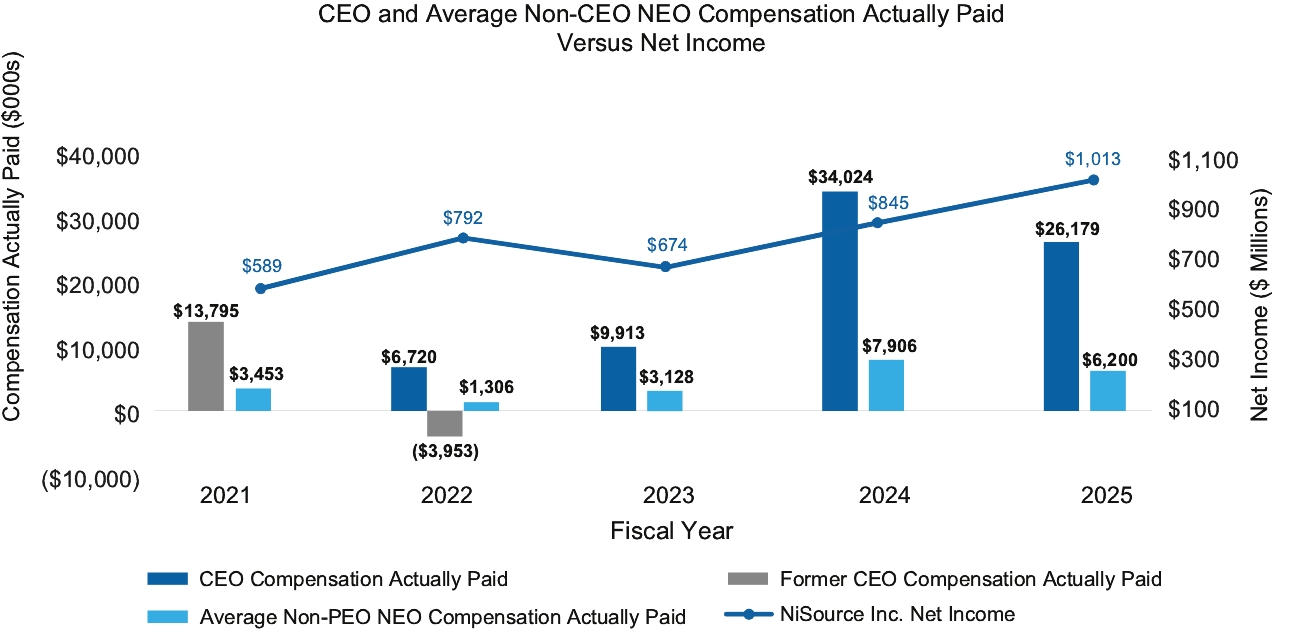
CAP versus Net Income
The graph below shows the relationship between the Company’s net income and the CEO and Non-CEO NEOs’ CAP. The Company does not use Net Income to determine compensation and is not included in incentive plans.
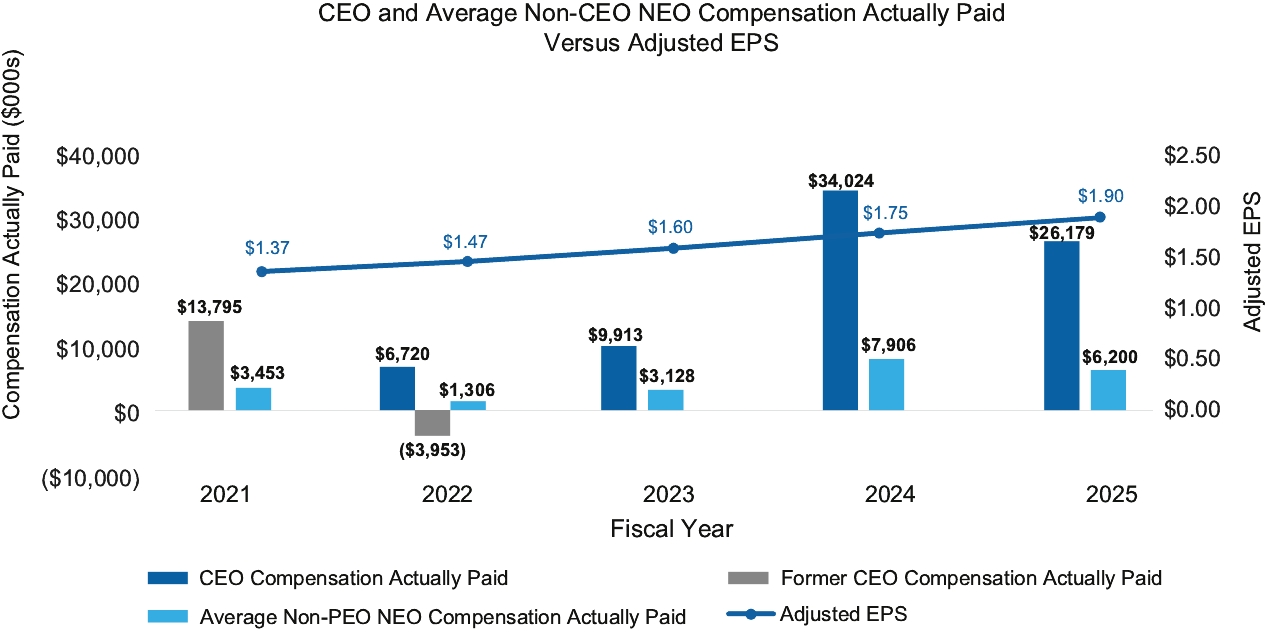
CAP versus Company Selected Measures: Adjusted EPS
The graph below shows the relationship between the Company’s adjusted EPS and the CEO and Non-CEO NEOs’ CAP. Adjusted EPS is a non-GAAP financial measure. Appendix A to this Proxy Statement contains a full reconciliation of GAAP EPS to Adjusted EPS.
CAP* versus Total Shareholder Return
The graph below represents the relationship between CAP to our CEO, the average CAP to our Non-CEO NEOs and Total Shareholder Return (“TSR”) for NiSource and the Dow Jones U.S. Utilities Index.
*CAP, as determined under SEC requirements, does not reflect the actual amount of compensation earned by or paid to our executive officers during a covered year.
COMPANY SELECTED PERFORMANCE MEASURES
The following were the three most important performance measures as determined by the Company that link compensation actually paid to our NEOs to the Company’s performance for the most recently completed fiscal year. Adjusted EPS and RTSR are the only two financial measures used as part of the Company’s compensation programs and to link compensation actually paid and Company performance. Safety is the most important non-financial measure used to link compensation actually paid to Company performance.
Company Selected Performance Measures | ||
Adjusted EPS | ||
RTSR | ||
Safety | ||
CEO and Other NEOs Pension Adjustment to CAP Reconciliation
Year | Plan | Service Cost | Prior Service Cost | Total Average Pension Benefit Adjustment (Service Cost ÷ by number of Other NEOs in applicable year) | ||||||||||
2025 | Pension Plan | $0 | $0 | $0 | ||||||||||
Pension Restoration Plan | $0 | $0 | $0 | |||||||||||
Total | $0 | $0 | $0 | |||||||||||
CEO Equity Adjustment to CAP Reconciliation
Year | Covered Year- End Fair Value of Equity Awards Granted During Covered Year That Remained Outstanding and Unvested as of Last Day of Covered Year ($) | Change in Fair Value as of Last Day of Covered Year (as compared to Last Day of Prior Year) of Equity Awards Granted Prior to Covered Year and Outstanding and Unvested as of Last Day of Covered Year ($) | Vesting Date Fair Value of Equity Awards Granted During Covered Year that Vested During Covered Year ($) | Change in Fair Value from Last Day of Prior Year to Vesting Date of Equity Awards Granted Prior to Covered Year that Vested During Covered Year ($) | Fair Value as of Last Day of Prior Year of Equity Awards that Failed to Meet Vesting Conditions During the Covered Year ($) | Value of Dividends or Other Earnings Paid on Equity Awards Not Otherwise Included as of Last Day of Covered Year ($) | Total - Inclusion of Equity Values ($) | ||||||||||||||||
2025 | $14,535,760 | $7,020,374 | $0 | $1,044,781 | $0 | $0 | $22,600,915 | ||||||||||||||||
Other NEOs Equity Adjustment to CAP Reconciliation
Year | Average Covered Year- End Fair Value of Equity Awards Granted During Covered Year That Remained Outstanding and Unvested as of Last Day of Covered Year ($) | Average Change in Fair Value as of Last Day of Covered Year (as compared to Last Day of Prior Year) of Equity Awards Granted Prior to Covered Year and Outstanding and Unvested as of Last Day of Covered Year ($) | Average Vesting Date Fair Value of Equity Awards Granted During Covered Year that Vested During Covered Year ($) | Average Change in Fair Value from Last Day of Prior Year to Vesting Date of Equity Awards Granted Prior to Covered Year that Vested During Covered Year ($) | Average Fair Value as of Last Day of Prior Year of Equity Awards that Failed to Meet Vesting Conditions During the Covered Year ($) | Average Value of Dividends or Other Earnings Paid on Equity Awards Not Otherwise Included as of Last Day of Covered Year ($) | Total - Average Inclusion of Equity Values ($) | ||||||||||||||||
2025 | $3,046,028 | $1,477,419 | $0 | $152,424 | $0 | $0 | $4,675,871 | ||||||||||||||||
Fair values reported in this table are computed in accordance with FASB ASC Topic 718.
(8) | Adjusted EPS is a non-GAAP financial measure. Appendix A to this Proxy Statement contains a full reconciliation of GAAP EPS to Adjusted EPS. |