Pay Versus Performance Table
PEO (Mr. Pine in 2024-2025 | Non-PEO NEOs | Value of Initial Fixed $100 | |||||||||||||||||||||||
Year (a) | Summary | Compensation | Average | Average | Total | Peer Group | Net Income | Revenue | |||||||||||||||||
2025 | 11,286,806 | 13,704,919 | 2,862,319 | 4,922,831 | 149 | 189 | 957 | 9,035 | |||||||||||||||||
2024 | 10,579,577 | 9,467,754 | 3,007,865 | 2,774,227 | 119 | 158 | 890 | 8,562 | |||||||||||||||||
2023 | 10,825,450 | 9,674,561 | 3,517,747 | 3,572,262 | 116 | 135 | 609 | 7,364 | |||||||||||||||||
2022 | 10,148,865 | 7,158,884 | 2,564,752 | 2,042,657 | 111 | 114 | 355 | 5,522 | |||||||||||||||||
2021 | 10,441,670 | 13,341,645 | 2,665,368 | 4,175,346 | 119 | 121 | 427 | 5,195 | |||||||||||||||||
| (1) | The dollar amounts reported in column (b) are the amounts reported for Mr. Pine and Mr. Decker (the Company’s CEO in 2021-2023) for each of the corresponding years in the “Total” column of the Summary Compensation Table (“SCT”). |
| (2) | The dollar amounts reported in column (c) represent the amount of “compensation actually paid” to Mr. Pine and Mr. Decker, as computed in accordance with Item 402(v) of Regulation S-K and do not reflect the total compensation actually realized or received by Mr. Pine and Mr. Decker. In accordance with these rules, these amounts reflect “Total Compensation” as set forth in the SCT for each year, adjusted as shown below. Equity values are calculated in accordance with FASB ASC Topic 718, and the valuation assumptions used to calculate fair values did not materially differ from those disclosed at the time of grant. Numbers disclosed in 2025 Proxy Statement were updated to correct a minor calculation error. |
Compensation Actually Paid to PEO ($M) | 2025 | 2024 | 2023 | 2022 | 2021 | ||||||||||
SCT Total | 11,287 | 10,580 | 10,825 | 10,149 | 10,442 | ||||||||||
Less, value of “Stock Awards” and “Option Awards” reported in SCT | 8,015 | 7,184 | 6,893 | 5,969 | 7,725 | ||||||||||
Plus, year-end fair value of outstanding and unvested equity awards granted in the year | 8,232 | 5,832 | 7,889 | 9,548 | 9,459 | ||||||||||
Plus (less), year over year change in fair value of outstanding and unvested equity awards granted in prior years | 1,646 | (76) | (301) | (1,983) | 2,297 | ||||||||||
Plus (less), change in fair value of equity awards granted in prior years that vested in the year | 555 | 316 | (1,845) | (4,587) | (1,131) | ||||||||||
Compensation Actually Paid to PEO | 13,705 | 9,468 | 9,675 | 7,159 | 13,342 |
| (3) | The dollar amounts reported in column (d) represent the average of the amounts reported for the Company’s NEOs as a group (excluding Mr. Pine or Mr. Decker as CEO) in the “Total” column of the SCT in each applicable year. The names of each of the NEOs included for these purposes in each applicable year are as follows: : (i) for 2025, Mr. Grogan, Mr. Yarkadas, Mr. Aulick and Ms. Toussant; (ii) for 2024, Mr. Grogan, Ms. Emmerich, Mr. Yarkadas, and Mr. Aulick; (iii) for 2023, Mr. Grogan, Mr. Pine (as COO), Mr. Yarkadas, Mr. Franz Cerwinka (former SVP and President, Applied Water (“AW”)), and Ms. Sandra Rowland (former CFO); (iii) for 2022, Ms. Rowland, Ms. Capers (former SVP and General Counsel), Mr. Yarkadas, and Mr. Pine (as SVP and President, Americas and Measurement and Control Solutions (“MCS”)); and (iv) for 2021, Ms. Rowland, Mr. Colin Sabol (former SVP and President, MCS), Mr. Pine (as SVP and President, AW), and Mr. Yarkadas. |
| (4) | The dollar amounts reported in column (e) represent the average amount of “compensation actually paid” to the NEOs as a group (excluding Mr. Pine or Mr. Decker as CEO), as computed in accordance with Item 402(v) of Regulation S-K. In accordance with these rules, these amounts reflect “Total Compensation” as set forth in the SCT for each year, adjusted as shown below. Equity values are calculated in accordance with FASB ASC Topic 718, and the valuation assumptions used to calculate fair values did not materially differ from those disclosed at the time of grant. Numbers disclosed in 2025 Proxy Statement were updated to correct a minor calculation error. |
Compensation Actually Paid to Non-PEO NEOs ($M) | 2025 | 2024 | 2023 | 2022 | 2021 | ||||||||||
Average SCT Total | 2,862 | 3,008 | 3,518 | 2,565 | 2,665 | ||||||||||
Less, average value of “Stock Awards” and “Option Awards” reported in SCT | 1,469 | 1,569 | 2,015 | 1,209 | 1,577 | ||||||||||
Plus, average year-end fair value of outstanding and unvested equity awards granted in the year | 1,508 | 1,255 | 2,344 | 1,908 | 1,931 | ||||||||||
Plus (less), average year over year change in fair value of outstanding and unvested equity awards granted in prior years | 1,832 | (32) | (45) | (435) | 1,026 | ||||||||||
Plus (less), average change in fair value of equity awards granted in prior years that vested in the year | 189 | 113 | (230) | (786) | 130 | ||||||||||
Less, average prior year-end fair value for any equity awards forfeited in the year | — | — | — | — | — | ||||||||||
Average Compensation Actually Paid to Non-PEO NEOs | 4,923 | 2,774 | 3,572 | 2,043 | 4,175 |
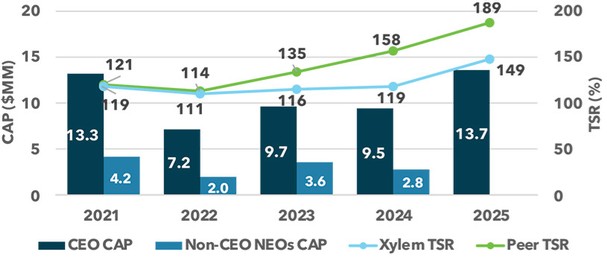
| (5) | Total Shareholder Return (TSR) is calculated by dividing (a) the sum of (i) the cumulative amount of dividends for the measurement period, assuming dividend reinvestment, and (ii) the difference between the Company’s share price at the end of each fiscal year shown and the beginning of the measurement period, by (b) the Company’s share price at the beginning of the measurement period. The beginning of the measurement period for each year in the table is December 31, 2020. |
| (6) | The peer group used for this purpose is the S&P 500 Industrials Index. |
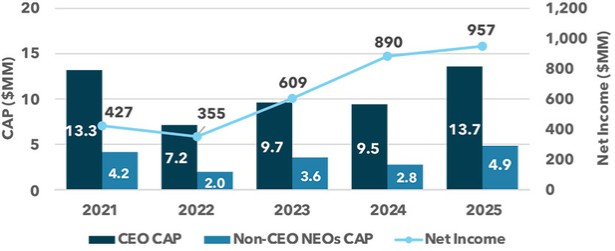
| (7) | The dollar amounts reported represent the amount of net income reflected in the Company’s audited financial statements for the applicable year. |
| (8) | Revenue was the Company-Selected Measure for the most recently completed fiscal year. The dollar amounts reported represent the amount of Revenue reflected in the Company’s audited financial statements for the applicable year. |
| (3) | The dollar amounts reported in column (d) represent the average of the amounts reported for the Company’s NEOs as a group (excluding Mr. Pine or Mr. Decker as CEO) in the “Total” column of the SCT in each applicable year. The names of each of the NEOs included for these purposes in each applicable year are as follows: : (i) for 2025, Mr. Grogan, Mr. Yarkadas, Mr. Aulick and Ms. Toussant; (ii) for 2024, Mr. Grogan, Ms. Emmerich, Mr. Yarkadas, and Mr. Aulick; (iii) for 2023, Mr. Grogan, Mr. Pine (as COO), Mr. Yarkadas, Mr. Franz Cerwinka (former SVP and President, Applied Water (“AW”)), and Ms. Sandra Rowland (former CFO); (iii) for 2022, Ms. Rowland, Ms. Capers (former SVP and General Counsel), Mr. Yarkadas, and Mr. Pine (as SVP and President, Americas and Measurement and Control Solutions (“MCS”)); and (iv) for 2021, Ms. Rowland, Mr. Colin Sabol (former SVP and President, MCS), Mr. Pine (as SVP and President, AW), and Mr. Yarkadas. |
| (6) | The peer group used for this purpose is the S&P 500 Industrials Index. |
| (2) | The dollar amounts reported in column (c) represent the amount of “compensation actually paid” to Mr. Pine and Mr. Decker, as computed in accordance with Item 402(v) of Regulation S-K and do not reflect the total compensation actually realized or received by Mr. Pine and Mr. Decker. In accordance with these rules, these amounts reflect “Total Compensation” as set forth in the SCT for each year, adjusted as shown below. Equity values are calculated in accordance with FASB ASC Topic 718, and the valuation assumptions used to calculate fair values did not materially differ from those disclosed at the time of grant. Numbers disclosed in 2025 Proxy Statement were updated to correct a minor calculation error. |
Compensation Actually Paid to PEO ($M) | 2025 | 2024 | 2023 | 2022 | 2021 | ||||||||||
SCT Total | 11,287 | 10,580 | 10,825 | 10,149 | 10,442 | ||||||||||
Less, value of “Stock Awards” and “Option Awards” reported in SCT | 8,015 | 7,184 | 6,893 | 5,969 | 7,725 | ||||||||||
Plus, year-end fair value of outstanding and unvested equity awards granted in the year | 8,232 | 5,832 | 7,889 | 9,548 | 9,459 | ||||||||||
Plus (less), year over year change in fair value of outstanding and unvested equity awards granted in prior years | 1,646 | (76) | (301) | (1,983) | 2,297 | ||||||||||
Plus (less), change in fair value of equity awards granted in prior years that vested in the year | 555 | 316 | (1,845) | (4,587) | (1,131) | ||||||||||
Compensation Actually Paid to PEO | 13,705 | 9,468 | 9,675 | 7,159 | 13,342 |
| (4) | The dollar amounts reported in column (e) represent the average amount of “compensation actually paid” to the NEOs as a group (excluding Mr. Pine or Mr. Decker as CEO), as computed in accordance with Item 402(v) of Regulation S-K. In accordance with these rules, these amounts reflect “Total Compensation” as set forth in the SCT for each year, adjusted as shown below. Equity values are calculated in accordance with FASB ASC Topic 718, and the valuation assumptions used to calculate fair values did not materially differ from those disclosed at the time of grant. Numbers disclosed in 2025 Proxy Statement were updated to correct a minor calculation error. |
Compensation Actually Paid to Non-PEO NEOs ($M) | 2025 | 2024 | 2023 | 2022 | 2021 | ||||||||||
Average SCT Total | 2,862 | 3,008 | 3,518 | 2,565 | 2,665 | ||||||||||
Less, average value of “Stock Awards” and “Option Awards” reported in SCT | 1,469 | 1,569 | 2,015 | 1,209 | 1,577 | ||||||||||
Plus, average year-end fair value of outstanding and unvested equity awards granted in the year | 1,508 | 1,255 | 2,344 | 1,908 | 1,931 | ||||||||||
Plus (less), average year over year change in fair value of outstanding and unvested equity awards granted in prior years | 1,832 | (32) | (45) | (435) | 1,026 | ||||||||||
Plus (less), average change in fair value of equity awards granted in prior years that vested in the year | 189 | 113 | (230) | (786) | 130 | ||||||||||
Less, average prior year-end fair value for any equity awards forfeited in the year | — | — | — | — | — | ||||||||||
Average Compensation Actually Paid to Non-PEO NEOs | 4,923 | 2,774 | 3,572 | 2,043 | 4,175 |
Compensation Actually Paid, Cumulative TSR and Peer Group TSR
Compensation Actually Paid and Net Income
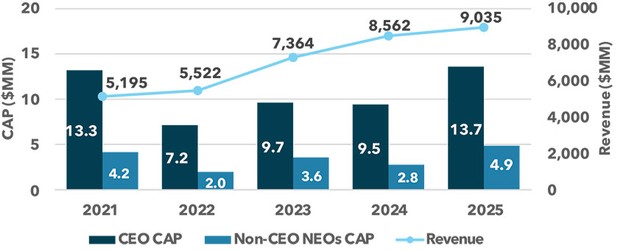
Compensation Actually Paid and Revenue
Compensation Actually Paid, Cumulative TSR and Peer Group TSR
| (8) | Revenue was the Company-Selected Measure for the most recently completed fiscal year. The dollar amounts reported represent the amount of Revenue reflected in the Company’s audited financial statements for the applicable year. |