| Year | Summary Compensation Table Total for PEO 1,2 | Compensation Actually Paid to PEO 1 | Average Summary Compensation Table Total for Non-PEO NEOs 1,4 | Average Compensation Actually Paid to Non-PEO NEOs 1,5 | Value of Initial Fixed $100 Investment Based on Total Shareholder Return 6 | Net Income (millions) 7 |
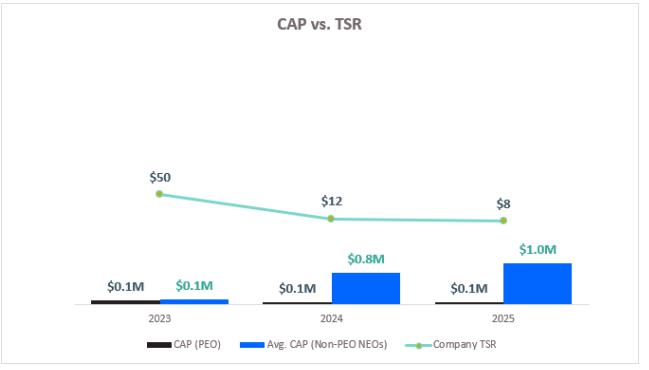
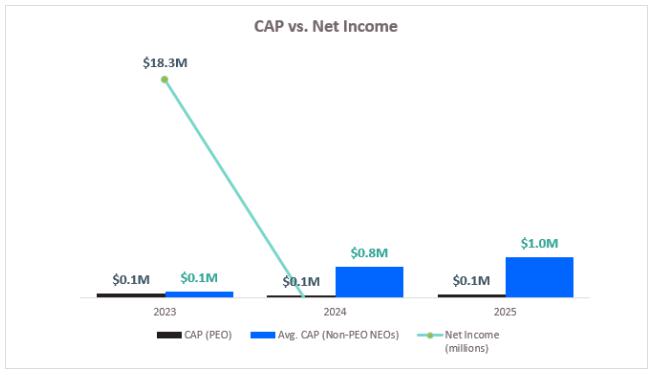
| 2025 | $71,217 | $71,217 | $1,316,861 | $989,127 | $8 | ($185.1) |
| 2024 | $63,536 | $63,536 | $2,399,937 | $760,350 | $12 | ($310.6) |
| 2023 | $100,151 | $100,151 | $1,782,960 | $138,937 | $50 | $18.3 |
| 1. | The PEO and NEOs included in these columns reflect the following individuals: |
| Year | PEO | Non-PEO NEOs |
| 2025 | Kenneth D. Tuchman | Kenneth "Kenny" R. Wagers, John P. Abou |
| 2024 | Kenneth D. Tuchman | Kenneth "Kenny" R. Wagers, Francois Bourret, Michelle "Shelly" R. Swanback, David J. Seybold, Margaret B. McLean |
| 2023 | Kenneth D. Tuchman | Michelle "Shelly" R. Swanback, Francois Bourret, Dustin J. Semach, David J. Seybold, Margaret B. McLean |
| 2. | Amounts reflect the average of Summary Compensation Table Total Pay for our PEO for each corresponding year. | |
| 3. | Compensation Actually Paid (CAP) has been calculated based on the requirements and methodology set forth in the applicable SEC rules (Item 402(v) of Regulation S-K). Since Mr. Tuchman does not currently receive equity grants, there are no equity adjustments recorded, and the dollar amounts reflect the actual amount of compensation earned during the applicable year. | |
| 4. | The amounts reported under "Average Summary Compensation Table Total" for non-PEO NEOs represent the average of the amounts reported for the Company's Non-PEO NEOs as a group in the 'Total' column of the Summary Compensation Table in each applicable year. | |
| 5. | The amounts in column "Average Compensation Actually Paid" for non-PEO NEOs represent the average amount of compensation paid to the non-PEO NEOs as a group, in accordance with Item 402(v) of Regulation S-K. The dollar amounts do not reflect the actual average amount of compensation earned by or paid to the non-PEO NEOs as a group during the applicable year. In accordance with the requirements of Item 402(v) of Regulation S-K, the adjustments in the "Reconciliation of Summary Compensation Table to Compensation Actually Paid for non-PEO NEOs" table below were made to the non-PEO NEOs’ total compensation for each year to determine the compensation actually paid. | |
| 6. | Total Stockholder Return (TSR) represents the cumulative return on a fixed investment of $100 in the Company’s common stock, for the period beginning on the last trading day of fiscal year 2022 through the end of the applicable fiscal year, assuming reinvestment of dividends. | |
| 7. | The dollar amounts reported represent the net income reflected in the Company’s audited financial statements for the applicable year. |
Leadership Transition and Pay for Performance Compensation Context
The increase in average non-PEO NEO compensation during the 2023–2025 period reflects the recruitment of new senior leadership — not discretionary increases tied to company performance outcomes.
TTEC's Chief Financial Officer, Kenny Wagers, joined the Company in March 2024, and John Abou, President for the TTEC Engage business segment, joined mid-year 2024. Both were recruited specifically to lead the Company's operational and financial transformation during a period of significant headwinds affecting the CX outsourcing industry. Their compensation packages reflect competitive market rates necessary to attract executives of their caliber from large multinational organizations, and a meaningful portion of their pay is structured at risk, tied to multi-year revenue and adjusted EBITDA performance targets.
The Company believes that investing in experienced operational leadership during this transitional period is essential to
TTEC's long-term value creation, and that the structure of executive compensation, with a significant performance-contingent component at risk reflects that conviction.
Reconciliation of Summary Compensation Table Total to Compensation Actually Paid for Non-PEO NEOs
The following table details all adjustments made to non-PEO NEO compensation to determine 2025 Compensation Actually Paid.
Fiscal Year
| Summary Compensation Table Total | (Minus): Grant Date Value of Equity Awards Granted in the Fiscal Year | Plus: Fair Value at Fiscal Year End of Outstanding and Unvested Equity Awards Granted in the Fiscal Year | Plus/(Minus): Change in Fair Value of Outstanding and Unvested Equity Awards Granted in Prior Fiscal Years | Plus: Fair Value at Vesting of Equity Awards Granted and Vested in the Fiscal Year | Plus/(Minus): Change in Fair Value as of the Vesting Date of Equity Awards Granted in Prior Fiscal Years that Vested in the Fiscal Year | (Minus): Fair Value as of the Prior Fiscal Year End of Equity Awards Granted in Prior Fiscal Years that Failed to Meet Vesting Conditions in the Fiscal Year | Plus: Value of Dividends or Other Earnings Paid on Equity Awards Not Otherwise Reflected in Total Comp- ensation | Compensation Actually Paid |
| 2025 | $1,316,861 | ($68,948) | $43,430 | ($249,731) | $29,620 | ($82,106) | $0 | $0 | $989,127 |
| 2024 | $2,399,937 | ($1,707,996) | $686,372 | ($441,083) | $0 | ($176,879) | $0 | $0 | $760,350 |
| 2023 | $1,782,960 | ($1,260,497) | $300,520 | ($546,207) | $0 | ($38,247) | ($99,593) | $0 | $138,937 |
For purposes of the above adjustments, the fair value of equity awards on the applicable date was determined in accordance with FASB’s ASC Topic 718, using valuation methodologies that are generally consistent with those used to determine the grant-date fair value for accounting purposes.
The assumptions used in calculating the fair value of the equity awards did not differ in any material respect from the assumptions used to calculate the grant date value of the awards as reported in the Summary Compensation Table.
| 1. | The PEO and NEOs included in these columns reflect the following individuals: |
| Year | PEO | Non-PEO NEOs |
| 2025 | Kenneth D. Tuchman | Kenneth "Kenny" R. Wagers, John P. Abou |
| 2024 | Kenneth D. Tuchman | Kenneth "Kenny" R. Wagers, Francois Bourret, Michelle "Shelly" R. Swanback, David J. Seybold, Margaret B. McLean |
| 2023 | Kenneth D. Tuchman | Michelle "Shelly" R. Swanback, Francois Bourret, Dustin J. Semach, David J. Seybold, Margaret B. McLean |
The following table details all adjustments made to non-PEO NEO compensation to determine 2025 Compensation Actually Paid.
Fiscal Year
| Summary Compensation Table Total | (Minus): Grant Date Value of Equity Awards Granted in the Fiscal Year | Plus: Fair Value at Fiscal Year End of Outstanding and Unvested Equity Awards Granted in the Fiscal Year | Plus/(Minus): Change in Fair Value of Outstanding and Unvested Equity Awards Granted in Prior Fiscal Years | Plus: Fair Value at Vesting of Equity Awards Granted and Vested in the Fiscal Year | Plus/(Minus): Change in Fair Value as of the Vesting Date of Equity Awards Granted in Prior Fiscal Years that Vested in the Fiscal Year | (Minus): Fair Value as of the Prior Fiscal Year End of Equity Awards Granted in Prior Fiscal Years that Failed to Meet Vesting Conditions in the Fiscal Year | Plus: Value of Dividends or Other Earnings Paid on Equity Awards Not Otherwise Reflected in Total Comp- ensation | Compensation Actually Paid |
| 2025 | $1,316,861 | ($68,948) | $43,430 | ($249,731) | $29,620 | ($82,106) | $0 | $0 | $989,127 |
| 2024 | $2,399,937 | ($1,707,996) | $686,372 | ($441,083) | $0 | ($176,879) | $0 | $0 | $760,350 |
| 2023 | $1,782,960 | ($1,260,497) | $300,520 | ($546,207) | $0 | ($38,247) | ($99,593) | $0 | $138,937 |