Pay vs Performance Disclosure - USD ($)
Dec. 31, 2025
Dec. 31, 2024
Dec. 31, 2023
Dec. 31, 2022
Dec. 31, 2021
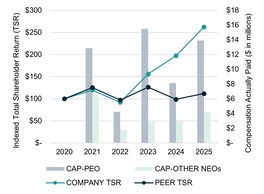
Summary Compensation Table to compensation actually paid to our Principal Executive Officer (“PEO”) and other NEOs as
well as information on our Company performance.
Year | Summary Compensation Table Total for PEO (1) | Compensation Actually Paid to PEO (5) | Average Summary Compensation Table Total for Non-PEO NEOs (2) | Average Compensation Actually Paid to Non-PEO NEOs (5) | Value of Initial Fixed $100 Investment Based on: | Company Net Income ($ in millions) | Company EBITDA (4) ($ in millions) | |
Company Total Shareholder Return (3) | Peer Group Total Shareholder Return (3) | |||||||
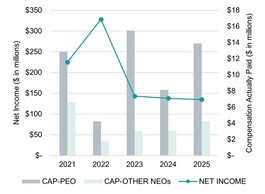
2025 | $10,140,372 | $13,903,619 | $3,140,685 | $4,265,154 | $262 | $112 | $135 | $422 |
2024 | 6,400,374 | 8,127,190 | 2,649,309 | 3,094,730 | 198 | 99 | 138 | 425 |
2023 | 6,748,551 | 15,496,536 | 2,138,092 | 3,039,172 | 156 | 126 | 143 | 405 |
2022 | 7,810,461 | 4,230,620 | 3,416,649 | 1,780,081 | 92 | 97 | 328 | 627 |
2021 | 8,023,798 | 12,877,899 | 3,789,459 | 6,581,026 | 120 | 125 | 225 | 457 |
(2)The Company’s Non-PEO NEOs for the years ended December 31, 2025, 2024, 2023, 2022 and 2021 were as follows:
•2025 - Messrs. Rodino, Roeder, Gonzalez and Duthie
•2024 - Messrs. Rodino, Kip B. Ellis, Roeder, Matthew S. Filer and Gonzalez
•2023 - Messrs. Rodino, Ellis, Filer, Jacob A. Petkovich and Duthie
•2022 and 2021 – Messrs. Cleveland, Rodino, Ellis and Petkovich
Mr. Cleveland served as Executive Chairman during the period from 2020 through 2022 and served as our PEO through December 31, 2019. Equity awards
granted to Mr. Cleveland while he served as PEO continued to vest during the period from 2020 through 2022. Mr. Ellis resigned as President - Powersports,
Technology, and Housing of the Company in December 2025. Mr. Petkovich joined the Company as CFO in November 2020 and resigned from the
Company in May 2023. Mr. Filer joined the Company as Senior Vice President of Finance in November 2022 and served as Interim CFO from May 2023
through March 4, 2024, at which time he returned to his previous role as Senior Vice President of Finance and was appointed Chief Accounting Officer in
May 2024.
TSR reflects a customized peer group of companies, which includes Brunswick Corporation, Cavco Industries, Inc., LCI Industries, Malibu Boats, Inc.,
Polaris, Inc., Thor Industries, Inc., Winnebago Industries, Inc., and Wabash National Corporation. See Stock Performance Graph on page 29 of our Form 10-
K for the fiscal year ended December 31, 2025.
paid for our Non-PEO NEOs for the year ended December 31, 2025.
PEO | Average Non-PEO NEOs | |
2025 | 2025 | |
SCT Total Compensation | $10,140,372 | $3,140,685 |
SUBTRACT Grant Fair Value of Equity Awards Made During Year (a) | (7,736,715) | (1,933,871) |
ADD Year End Fair Value of Equity Awards Made During Year (b) | 10,947,708 | 2,725,576 |
ADD Year Over Year Change in Fair Value of Outstanding and Unvested Equity Awards (c) | (452,314) | 148,709 |
ADD Change in Fair Value of Equity Awards Granted in Prior Years That Vested During Year (d) | 773,111 | 140,911 |
ADD Fair Value at Vesting of Equity Awards Made During Year That Also Vested During Year (e) | - | - |
SUBTRACT Fair Value at the End of the Prior Year of Equity Awards That Were Forfeited During Year (f) | - | - |
ADD Value of Dividends Paid on Equity Awards That Vested During Year Not Included in SCT Total Compensation (g) | 231,457 | 43,144 |
Total Adjustments Related to Equity Awards | $3,763,247 | $1,124,469 |
Total Adjustments Related to Pension Value (h) | - | - |
Total Compensation Actually Paid | $13,903,619 | $4,265,154 |
(a)Represents the grant date fair value of equity-based awards made during the fiscal year.
(b)Represents the year-end fair value of equity awards that were made during the fiscal year and were unvested as of year-end.
(c)Represents the change in fair value during the fiscal year of equity-based awards granted in prior fiscal years that were still unvested as of year-end.
(d)Represents the change in fair value during the fiscal year of equity-based awards granted in prior fiscal years that vested during the current fiscal year.
(e)Represents the fair value of equity awards that vested during the same year as grant.
(f)Represents the prior year-end fair value of equity awards forfeited during the year.
(g)Dividends accrued during vesting period on restricted equity awards are paid only on shares that vest with payment made at the time of vesting.
(h)Mr. Nemeth is the only participant in the Executive Retirement Plan. The annual interest credit on the annuity benefit is reported using the same value in the
SCT and in Compensation Actually Paid.
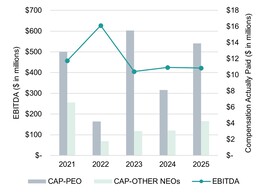
as discussed in the CD&A. Below is a reconciliation of net income to EBITDA for the periods shown in the table above:
($ in millions) | 2021 | 2022 | 2023 | 2024 | 2025 | ||
Net Income | $225 | $328 | $143 | $138 | $135 | ||
+ Interest expense | 58 | 61 | 69 | 80 | 75 | ||
+ Income taxes | 69 | 107 | 48 | 40 | 42 | ||
+ Depreciation & amortization | 105 | 131 | 145 | 167 | 170 | ||
EBITDA | $457 | $627 | $405 | $425 | $422 |