Shareholder Report
Jan. 31, 2026
USD ($)
Holding
FUND EXPENSES
What were the fund costs for the last year?
| (based on a hypothetical $10,000 investment) | ||
| Class Name | Costs of a $10,000 investment | Costs paid as a percentage of a $10,000 investment |
| R6 | $52 | 0.50% |
MANAGEMENT'S DISCUSSION OF FUND PERFORMANCE
-
For the twelve months ended January 31, 2026, Class R6 shares of the MFS High Income Fund (fund) provided a total return of 8.04%, at net asset value. This compares with a return of 6.85% for the fund’s benchmark, the Bloomberg U.S. Aggregate Bond Index. The fund's other benchmark, the Bloomberg U.S. Corporate High-Yield 2% Issuer Capped Index, generated a return of 7.70%.
-
Global equity markets reached record levels during the period, withstanding considerable volatility amid tariffs, geopolitical conflict and high levels of uncertainty. In the US, a pro-growth tax and spending bill was signed into law, while in Europe, renewed focus on defense and infrastructure spending brightened the outlook. In Japan, the election of a pro-growth prime minister sent stocks to new highs. Optimism over artificial intelligence remained quite high.
-
Considerable progress was made in trade talks between the US and many major trading partners, with a fragile truce between the US and China extended through late 2026. US tariffs remained high on goods from countries such as India and Brazil.
-
Moderating inflation pressures allowed many global central banks to ease monetary policy during the period. Amid a difficult policymaking environment and slower job growth, the Federal Reserve resumed easing policy in September and delivered quarter-point rate cuts in October and December.
-
In fixed income markets, global bond yields peaked near the start of the reporting period, then gradually declined, ending the reporting period marginally lower than at the start of the period, while experiencing waves of volatility in between. Both credit spreads and US bond market volatility (as measured by the Merrill Lynch Option Volatility Estimate (MOVE) Index), ended near session lows after rising in April and May due to tariff concerns.
-
Top contributors to performance relative to the Bloomberg U.S. Corporate High-Yield 2% Issuer Capped Index:
-
From a quality perspective, security selection within CCC, BB and B-rated bonds benefited relative performance.
-
From a sector perspective, favorable bond selection within the capital goods, consumer cyclicals, technology, and basic industry sectors strengthened relative returns.
-
-
Top detractors from performance relative to the Bloomberg U.S. Corporate High-Yield 2% Issuer Capped Index:
-
From a sector perspective, bond selection within the communications sector held back relative results.
-
During the reporting period, the fund's cash position weighed on relative performance.
-
FUND PERFORMANCE
The fund’s past performance is not a good predictor of the fund’s future performance. The graph and table below do not reflect the deduction of taxes that a shareholder would pay on fund distributions or the redemption of fund shares. The graph and table below assume reinvestment of dividends and capital gain distributions.
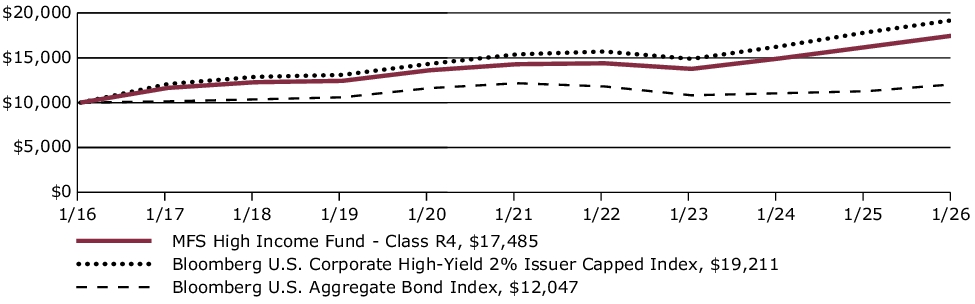
Growth of a Hypothetical $10,000 Investment
This graph shows the performance of a hypothetical $10,000 investment in Class R6 over a ten year period or since inception, if shorter, in comparison to (i) a broad measure of market performance and (ii) an additional index that MFS believes more closely reflects the market segments in which the fund invests.

Average Annual Total Returns through 1/31/26
This table shows the average annual total returns of the class of shares noted for the periods shown, both with (if any) and without sales charges. It also shows the average annual total returns of (i) a broad measure of market performance and (ii) an additional index that MFS believes more closely reflects the market segments in which the fund invests, over the same periods.
| Share Class | 1-yr | 5-yr | 10-yr |
| R6 without sales charge | 8.04% | 4.17% | 5.83% |
| Comparative Benchmark(s) | |||
| Bloomberg U.S. Aggregate Bond Index ∆ | 6.85% | (0.20)% | 1.88% |
| Bloomberg U.S. Corporate High-Yield 2% Issuer Capped Index ∆ | 7.70% | 4.54% | 6.75% |
|
∆
|
Source: FactSet Research Systems Inc.
|
Visit mfs.com/perf/r6 for more recent performance information.
FUND STATISTICS AS OF 1/31/26
| Net Assets ($): | 2,001,593,093 | Average Effective Maturity (yrs): | 3.4 | |
| Total Number of Holdings: | 367 | Average Effective Duration (yrs): | 2.7 | |
| Total Management Fee ($)#: | 8,553,745 | |||
| Portfolio Turnover Rate (%): | 51 |
# Includes the effect of any management fee waivers, if applicable.
Where the fund holds derivatives, they are not included in the total number of portfolio holdings.
PORTFOLIO COMPOSITION (BASED ON TOTAL INVESTMENTS AS OF 1/31/26)
Portfolio structure
| Fixed Income ~ | 97.0% |
| Money Market Funds | 3.0% |
| Equities | 0.0% |
Composition including fixed income credit
quality
| BBB | 0.4% |
| BB | 45.4% |
| B | 38.4% |
| CCC | 11.0% |
| CC | 0.3% |
| Not Rated | 1.5% |
| Non-Fixed Income | 0.0% |
| Money Market Funds | 3.0% |
Ratings are assigned using Moody’s, Fitch, and Standard & Poor’s and applying a hierarchy: If all 3 agencies rate a security, the middle rating is assigned; if 2 agencies rate a security, the lower rating is assigned. If none of the 3 agencies rate a security, we use DBRS Morningstar. If none of the 4 agencies rate a security, we use Kroll Bond Rating Agency. Ratings are shown in the S&P and Fitch scale (e.g., AAA). All ratings are subject to change.
~ The fund invests a portion of its assets in Exchange-Traded Funds (ETFs) or Options on ETFs to gain fixed income exposure. Percentages include the direct exposure from investing in ETFs or Options on ETFs and not the indirect exposure to the underlying holdings.
Ratings are assigned using Moody’s, Fitch, and Standard & Poor’s and applying a hierarchy: If all 3 agencies rate a security, the middle rating is assigned; if 2 agencies rate a security, the lower rating is assigned. If none of the 3 agencies rate a security, we use DBRS Morningstar. If none of the 4 agencies rate a security, we use Kroll Bond Rating Agency. Ratings are shown in the S&P and Fitch scale (e.g., AAA). All ratings are subject to change.
FUND EXPENSES
What were the fund costs for the last year?
| (based on a hypothetical $10,000 investment) | ||
| Class Name | Costs of a $10,000 investment | Costs paid as a percentage of a $10,000 investment |
| R4 | $62 | 0.60% |
MANAGEMENT'S DISCUSSION OF FUND PERFORMANCE
-
For the twelve months ended January 31, 2026, Class R4 shares of the MFS High Income Fund (fund) provided a total return of 7.93%, at net asset value. This compares with a return of 6.85% for the fund’s benchmark, the Bloomberg U.S. Aggregate Bond Index. The fund's other benchmark, the Bloomberg U.S. Corporate High-Yield 2% Issuer Capped Index, generated a return of 7.70%.
-
Global equity markets reached record levels during the period, withstanding considerable volatility amid tariffs, geopolitical conflict and high levels of uncertainty. In the US, a pro-growth tax and spending bill was signed into law, while in Europe, renewed focus on defense and infrastructure spending brightened the outlook. In Japan, the election of a pro-growth prime minister sent stocks to new highs. Optimism over artificial intelligence remained quite high.
-
Considerable progress was made in trade talks between the US and many major trading partners, with a fragile truce between the US and China extended through late 2026. US tariffs remained high on goods from countries such as India and Brazil.
-
Moderating inflation pressures allowed many global central banks to ease monetary policy during the period. Amid a difficult policymaking environment and slower job growth, the Federal Reserve resumed easing policy in September and delivered quarter-point rate cuts in October and December.
-
In fixed income markets, global bond yields peaked near the start of the reporting period, then gradually declined, ending the reporting period marginally lower than at the start of the period, while experiencing waves of volatility in between. Both credit spreads and US bond market volatility (as measured by the Merrill Lynch Option Volatility Estimate (MOVE) Index), ended near session lows after rising in April and May due to tariff concerns.
-
Top contributors to performance relative to the Bloomberg U.S. Corporate High-Yield 2% Issuer Capped Index:
-
From a quality perspective, security selection within CCC, BB and B-rated bonds benefited relative performance.
-
From a sector perspective, favorable bond selection within the capital goods, consumer cyclicals, technology, and basic industry sectors strengthened relative returns.
-
-
Top detractors from performance relative to the Bloomberg U.S. Corporate High-Yield 2% Issuer Capped Index:
-
From a sector perspective, bond selection within the communications sector held back relative results.
-
During the reporting period, the fund's cash position weighed on relative performance.
-
FUND PERFORMANCE
The fund’s past performance is not a good predictor of the fund’s future performance. The graph and table below do not reflect the deduction of taxes that a shareholder would pay on fund distributions or the redemption of fund shares. The graph and table below assume reinvestment of dividends and capital gain distributions.
Growth of a Hypothetical $10,000 Investment
This graph shows the performance of a hypothetical $10,000 investment in Class R4 over a ten year period or since inception, if shorter, in comparison to (i) a broad measure of market performance and (ii) an additional index that MFS believes more closely reflects the market segments in which the fund invests.
Average Annual Total Returns through 1/31/26
This table shows the average annual total returns of the class of shares noted for the periods shown, both with (if any) and without sales charges. It also shows the average annual total returns of (i) a broad measure of market performance and (ii) an additional index that MFS believes more closely reflects the market segments in which the fund invests, over the same periods.
| Share Class | 1-yr | 5-yr | 10-yr |
| R4 without sales charge | 7.93% | 4.12% | 5.75% |
| Comparative Benchmark(s) | |||
| Bloomberg U.S. Aggregate Bond Index ∆ | 6.85% | (0.20)% | 1.88% |
| Bloomberg U.S. Corporate High-Yield 2% Issuer Capped Index ∆ | 7.70% | 4.54% | 6.75% |
|
∆
|
Source: FactSet Research Systems Inc.
|
Visit mfs.com/perf/r4 for more recent performance information.
FUND STATISTICS AS OF 1/31/26
| Net Assets ($): | 2,001,593,093 | Average Effective Maturity (yrs): | 3.4 | |
| Total Number of Holdings: | 367 | Average Effective Duration (yrs): | 2.7 | |
| Total Management Fee ($)#: | 8,553,745 | |||
| Portfolio Turnover Rate (%): | 51 |
# Includes the effect of any management fee waivers, if applicable.
Where the fund holds derivatives, they are not included in the total number of portfolio holdings.
PORTFOLIO COMPOSITION (BASED ON TOTAL INVESTMENTS AS OF 1/31/26)
Portfolio structure
| Fixed Income ~ | 97.0% |
| Money Market Funds | 3.0% |
| Equities | 0.0% |
Composition including fixed income credit
quality
quality
| BBB | 0.4% |
| BB | 45.4% |
| B | 38.4% |
| CCC | 11.0% |
| CC | 0.3% |
| Not Rated | 1.5% |
| Non-Fixed Income | 0.0% |
| Money Market Funds | 3.0% |
Ratings are assigned using Moody’s, Fitch, and Standard & Poor’s and applying a hierarchy: If all 3 agencies rate a security, the middle rating is assigned; if 2 agencies rate a security, the lower rating is assigned. If none of the 3 agencies rate a security, we use DBRS Morningstar. If none of the 4 agencies rate a security, we use Kroll Bond Rating Agency. Ratings are shown in the S&P and Fitch scale (e.g., AAA). All ratings are subject to change.
~ The fund invests a portion of its assets in Exchange-Traded Funds (ETFs) or Options on ETFs to gain fixed income exposure. Percentages include the direct exposure from investing in ETFs or Options on ETFs and not the indirect exposure to the underlying holdings.
Ratings are assigned using Moody’s, Fitch, and Standard & Poor’s and applying a hierarchy: If all 3 agencies rate a security, the middle rating is assigned; if 2 agencies rate a security, the lower rating is assigned. If none of the 3 agencies rate a security, we use DBRS Morningstar. If none of the 4 agencies rate a security, we use Kroll Bond Rating Agency. Ratings are shown in the S&P and Fitch scale (e.g., AAA). All ratings are subject to change.
FUND EXPENSES
What were the fund costs for the last year?
| (based on a hypothetical $10,000 investment) | ||
| Class Name | Costs of a $10,000 investment | Costs paid as a percentage of a $10,000 investment |
| R3 | $88 | 0.85% |
MANAGEMENT'S DISCUSSION OF FUND PERFORMANCE
-
For the twelve months ended January 31, 2026, Class R3 shares of the MFS High Income Fund (fund) provided a total return of 7.67%, at net asset value. This compares with a return of 6.85% for the fund’s benchmark, the Bloomberg U.S. Aggregate Bond Index. The fund's other benchmark, the Bloomberg U.S. Corporate High-Yield 2% Issuer Capped Index, generated a return of 7.70%.
-
Global equity markets reached record levels during the period, withstanding considerable volatility amid tariffs, geopolitical conflict and high levels of uncertainty. In the US, a pro-growth tax and spending bill was signed into law, while in Europe, renewed focus on defense and infrastructure spending brightened the outlook. In Japan, the election of a pro-growth prime minister sent stocks to new highs. Optimism over artificial intelligence remained quite high.
-
Considerable progress was made in trade talks between the US and many major trading partners, with a fragile truce between the US and China extended through late 2026. US tariffs remained high on goods from countries such as India and Brazil.
-
Moderating inflation pressures allowed many global central banks to ease monetary policy during the period. Amid a difficult policymaking environment and slower job growth, the Federal Reserve resumed easing policy in September and delivered quarter-point rate cuts in October and December.
-
In fixed income markets, global bond yields peaked near the start of the reporting period, then gradually declined, ending the reporting period marginally lower than at the start of the period, while experiencing waves of volatility in between. Both credit spreads and US bond market volatility (as measured by the Merrill Lynch Option Volatility Estimate (MOVE) Index), ended near session lows after rising in April and May due to tariff concerns.
-
Top contributors to performance relative to the Bloomberg U.S. Corporate High-Yield 2% Issuer Capped Index:
-
From a quality perspective, security selection within CCC, BB and B-rated bonds benefited relative performance.
-
From a sector perspective, favorable bond selection within the capital goods, consumer cyclicals, technology, and basic industry sectors strengthened relative returns.
-
-
Top detractors from performance relative to the Bloomberg U.S. Corporate High-Yield 2% Issuer Capped Index:
-
From a sector perspective, bond selection within the communications sector held back relative results.
-
During the reporting period, the fund's cash position weighed on relative performance.
-
FUND PERFORMANCE
The fund’s past performance is not a good predictor of the fund’s future performance. The graph and table below do not reflect the deduction of taxes that a shareholder would pay on fund distributions or the redemption of fund shares. The graph and table below assume reinvestment of dividends and capital gain distributions.
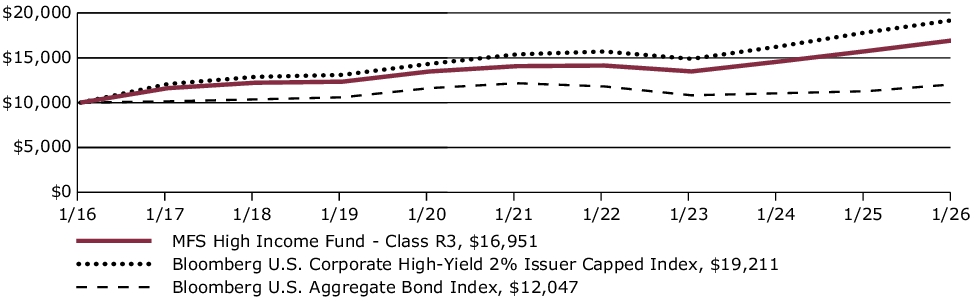
Growth of a Hypothetical $10,000 Investment
This graph shows the performance of a hypothetical $10,000 investment in Class R3 over a ten year period or since inception, if shorter, in comparison to (i) a broad measure of market performance and (ii) an additional index that MFS believes more closely reflects the market segments in which the fund invests.
Average Annual Total Returns through 1/31/26
This table shows the average annual total returns of the class of shares noted for the periods shown, both with (if any) and without sales charges. It also shows the average annual total returns of (i) a broad measure of market performance and (ii) an additional index that MFS believes more closely reflects the market segments in which the fund invests, over the same periods.
| Share Class | 1-yr | 5-yr | 10-yr |
| R3 without sales charge | 7.67% | 3.80% | 5.42% |
| Comparative Benchmark(s) | |||
| Bloomberg U.S. Aggregate Bond Index ∆ | 6.85% | (0.20)% | 1.88% |
| Bloomberg U.S. Corporate High-Yield 2% Issuer Capped Index ∆ | 7.70% | 4.54% | 6.75% |
|
∆
|
Source: FactSet Research Systems Inc.
|
Visit mfs.com/perf/r3 for more recent performance information.
FUND STATISTICS AS OF 1/31/26
| Net Assets ($): | 2,001,593,093 | Average Effective Maturity (yrs): | 3.4 | |
| Total Number of Holdings: | 367 | Average Effective Duration (yrs): | 2.7 | |
| Total Management Fee ($)#: | 8,553,745 | |||
| Portfolio Turnover Rate (%): | 51 |
# Includes the effect of any management fee waivers, if applicable.
Where the fund holds derivatives, they are not included in the total number of portfolio holdings.
PORTFOLIO COMPOSITION (BASED ON TOTAL INVESTMENTS AS OF 1/31/26)
Portfolio structure
| Fixed Income ~ | 97.0% |
| Money Market Funds | 3.0% |
| Equities | 0.0% |
Composition including fixed income credit
quality
quality
| BBB | 0.4% |
| BB | 45.4% |
| B | 38.4% |
| CCC | 11.0% |
| CC | 0.3% |
| Not Rated | 1.5% |
| Non-Fixed Income | 0.0% |
| Money Market Funds | 3.0% |
Ratings are assigned using Moody’s, Fitch, and Standard & Poor’s and applying a hierarchy: If all 3 agencies rate a security, the middle rating is assigned; if 2 agencies rate a security, the lower rating is assigned. If none of the 3 agencies rate a security, we use DBRS Morningstar. If none of the 4 agencies rate a security, we use Kroll Bond Rating Agency. Ratings are shown in the S&P and Fitch scale (e.g., AAA). All ratings are subject to change.
~ The fund invests a portion of its assets in Exchange-Traded Funds (ETFs) or Options on ETFs to gain fixed income exposure. Percentages include the direct exposure from investing in ETFs or Options on ETFs and not the indirect exposure to the underlying holdings.
Ratings are assigned using Moody’s, Fitch, and Standard & Poor’s and applying a hierarchy: If all 3 agencies rate a security, the middle rating is assigned; if 2 agencies rate a security, the lower rating is assigned. If none of the 3 agencies rate a security, we use DBRS Morningstar. If none of the 4 agencies rate a security, we use Kroll Bond Rating Agency. Ratings are shown in the S&P and Fitch scale (e.g., AAA). All ratings are subject to change.
FUND EXPENSES
What were the fund costs for the last year?
| (based on a hypothetical $10,000 investment) | ||
| Class Name | Costs of a $10,000 investment | Costs paid as a percentage of a $10,000 investment |
| R2 | $114 | 1.10% |
MANAGEMENT'S DISCUSSION OF FUND PERFORMANCE
-
For the twelve months ended January 31, 2026, Class R2 shares of the MFS High Income Fund (fund) provided a total return of 7.41%, at net asset value. This compares with a return of 6.85% for the fund’s benchmark, the Bloomberg U.S. Aggregate Bond Index. The fund's other benchmark, the Bloomberg U.S. Corporate High-Yield 2% Issuer Capped Index, generated a return of 7.70%.
-
Global equity markets reached record levels during the period, withstanding considerable volatility amid tariffs, geopolitical conflict and high levels of uncertainty. In the US, a pro-growth tax and spending bill was signed into law, while in Europe, renewed focus on defense and infrastructure spending brightened the outlook. In Japan, the election of a pro-growth prime minister sent stocks to new highs. Optimism over artificial intelligence remained quite high.
-
Considerable progress was made in trade talks between the US and many major trading partners, with a fragile truce between the US and China extended through late 2026. US tariffs remained high on goods from countries such as India and Brazil.
-
Moderating inflation pressures allowed many global central banks to ease monetary policy during the period. Amid a difficult policymaking environment and slower job growth, the Federal Reserve resumed easing policy in September and delivered quarter-point rate cuts in October and December.
-
In fixed income markets, global bond yields peaked near the start of the reporting period, then gradually declined, ending the reporting period marginally lower than at the start of the period, while experiencing waves of volatility in between. Both credit spreads and US bond market volatility (as measured by the Merrill Lynch Option Volatility Estimate (MOVE) Index), ended near session lows after rising in April and May due to tariff concerns.
-
Top contributors to performance relative to the Bloomberg U.S. Corporate High-Yield 2% Issuer Capped Index:
-
From a quality perspective, security selection within CCC, BB and B-rated bonds benefited relative performance.
-
From a sector perspective, favorable bond selection within the capital goods, consumer cyclicals, technology, and basic industry sectors strengthened relative returns.
-
-
Top detractors from performance relative to the Bloomberg U.S. Corporate High-Yield 2% Issuer Capped Index:
-
From a sector perspective, bond selection within the communications sector held back relative results.
-
During the reporting period, the fund's cash position weighed on relative performance.
-
FUND PERFORMANCE
The fund’s past performance is not a good predictor of the fund’s future performance. The graph and table below do not reflect the deduction of taxes that a shareholder would pay on fund distributions or the redemption of fund shares. The graph and table below assume reinvestment of dividends and capital gain distributions.
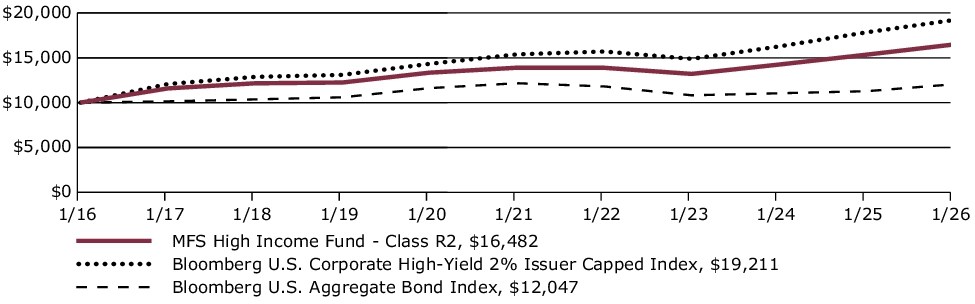
Growth of a Hypothetical $10,000 Investment
This graph shows the performance of a hypothetical $10,000 investment in Class R2 over a ten year period or since inception, if shorter, in comparison to (i) a broad measure of market performance and (ii) an additional index that MFS believes more closely reflects the market segments in which the fund invests.
Average Annual Total Returns through 1/31/26
This table shows the average annual total returns of the class of shares noted for the periods shown, both with (if any) and without sales charges. It also shows the average annual total returns of (i) a broad measure of market performance and (ii) an additional index that MFS believes more closely reflects the market segments in which the fund invests, over the same periods.
| Share Class | 1-yr | 5-yr | 10-yr |
| R2 without sales charge | 7.41% | 3.47% | 5.12% |
| Comparative Benchmark(s) | |||
| Bloomberg U.S. Aggregate Bond Index ∆ | 6.85% | (0.20)% | 1.88% |
| Bloomberg U.S. Corporate High-Yield 2% Issuer Capped Index ∆ | 7.70% | 4.54% | 6.75% |
|
∆
|
Source: FactSet Research Systems Inc.
|
Visit mfs.com/perf/r2 for more recent performance information.
FUND STATISTICS AS OF 1/31/26
| Net Assets ($): | 2,001,593,093 | Average Effective Maturity (yrs): | 3.4 | |
| Total Number of Holdings: | 367 | Average Effective Duration (yrs): | 2.7 | |
| Total Management Fee ($)#: | 8,553,745 | |||
| Portfolio Turnover Rate (%): | 51 |
# Includes the effect of any management fee waivers, if applicable.
Where the fund holds derivatives, they are not included in the total number of portfolio holdings.
PORTFOLIO COMPOSITION (BASED ON TOTAL INVESTMENTS AS OF 1/31/26)
Portfolio structure
| Fixed Income ~ | 97.0% |
| Money Market Funds | 3.0% |
| Equities | 0.0% |
Composition including fixed income credit
quality
quality
| BBB | 0.4% |
| BB | 45.4% |
| B | 38.4% |
| CCC | 11.0% |
| CC | 0.3% |
| Not Rated | 1.5% |
| Non-Fixed Income | 0.0% |
| Money Market Funds | 3.0% |
Ratings are assigned using Moody’s, Fitch, and Standard & Poor’s and applying a hierarchy: If all 3 agencies rate a security, the middle rating is assigned; if 2 agencies rate a security, the lower rating is assigned. If none of the 3 agencies rate a security, we use DBRS Morningstar. If none of the 4 agencies rate a security, we use Kroll Bond Rating Agency. Ratings are shown in the S&P and Fitch scale (e.g., AAA). All ratings are subject to change.
~ The fund invests a portion of its assets in Exchange-Traded Funds (ETFs) or Options on ETFs to gain fixed income exposure. Percentages include the direct exposure from investing in ETFs or Options on ETFs and not the indirect exposure to the underlying holdings.
Ratings are assigned using Moody’s, Fitch, and Standard & Poor’s and applying a hierarchy: If all 3 agencies rate a security, the middle rating is assigned; if 2 agencies rate a security, the lower rating is assigned. If none of the 3 agencies rate a security, we use DBRS Morningstar. If none of the 4 agencies rate a security, we use Kroll Bond Rating Agency. Ratings are shown in the S&P and Fitch scale (e.g., AAA). All ratings are subject to change.
FUND EXPENSES
What were the fund costs for the last year?
| (based on a hypothetical $10,000 investment) | ||
| Class Name | Costs of a $10,000 investment | Costs paid as a percentage of a $10,000 investment |
| R1 | $165 | 1.60% |
MANAGEMENT'S DISCUSSION OF FUND PERFORMANCE
-
For the twelve months ended January 31, 2026, Class R1 shares of the MFS High Income Fund (fund) provided a total return of 6.87%, at net asset value. This compares with a return of 6.85% for the fund’s benchmark, the Bloomberg U.S. Aggregate Bond Index. The fund's other benchmark, the Bloomberg U.S. Corporate High-Yield 2% Issuer Capped Index, generated a return of 7.70%.
-
Global equity markets reached record levels during the period, withstanding considerable volatility amid tariffs, geopolitical conflict and high levels of uncertainty. In the US, a pro-growth tax and spending bill was signed into law, while in Europe, renewed focus on defense and infrastructure spending brightened the outlook. In Japan, the election of a pro-growth prime minister sent stocks to new highs. Optimism over artificial intelligence remained quite high.
-
Considerable progress was made in trade talks between the US and many major trading partners, with a fragile truce between the US and China extended through late 2026. US tariffs remained high on goods from countries such as India and Brazil.
-
Moderating inflation pressures allowed many global central banks to ease monetary policy during the period. Amid a difficult policymaking environment and slower job growth, the Federal Reserve resumed easing policy in September and delivered quarter-point rate cuts in October and December.
-
In fixed income markets, global bond yields peaked near the start of the reporting period, then gradually declined, ending the reporting period marginally lower than at the start of the period, while experiencing waves of volatility in between. Both credit spreads and US bond market volatility (as measured by the Merrill Lynch Option Volatility Estimate (MOVE) Index), ended near session lows after rising in April and May due to tariff concerns.
-
Top contributors to performance relative to the Bloomberg U.S. Corporate High-Yield 2% Issuer Capped Index:
-
From a quality perspective, security selection within CCC, BB and B-rated bonds benefited relative performance.
-
From a sector perspective, favorable bond selection within the capital goods, consumer cyclicals, technology, and basic industry sectors strengthened relative returns.
-
-
Top detractors from performance relative to the Bloomberg U.S. Corporate High-Yield 2% Issuer Capped Index:
-
From a sector perspective, bond selection within the communications sector held back relative results.
-
During the reporting period, the fund's cash position weighed on relative performance.
-
FUND PERFORMANCE
The fund’s past performance is not a good predictor of the fund’s future performance. The graph and table below do not reflect the deduction of taxes that a shareholder would pay on fund distributions or the redemption of fund shares. The graph and table below assume reinvestment of dividends and capital gain distributions.
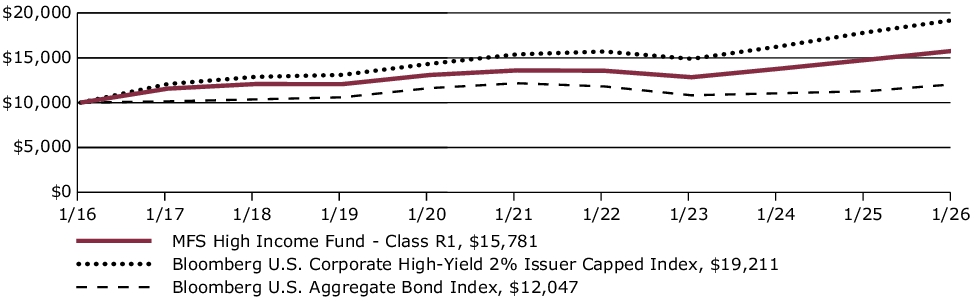
Growth of a Hypothetical $10,000 Investment
This graph shows the performance of a hypothetical $10,000 investment in Class R1 over a ten year period or since inception, if shorter, in comparison to (i) a broad measure of market performance and (ii) an additional index that MFS believes more closely reflects the market segments in which the fund invests.
Average Annual Total Returns through 1/31/26
This table shows the average annual total returns of the class of shares noted for the periods shown, both with (if any) and without sales charges. It also shows the average annual total returns of (i) a broad measure of market performance and (ii) an additional index that MFS believes more closely reflects the market segments in which the fund invests, over the same periods.
| Share Class | 1-yr | 5-yr | 10-yr |
| R1 without sales charge | 6.87% | 3.03% | 4.67% |
| Comparative Benchmark(s) | |||
| Bloomberg U.S. Aggregate Bond Index ∆ | 6.85% | (0.20)% | 1.88% |
| Bloomberg U.S. Corporate High-Yield 2% Issuer Capped Index ∆ | 7.70% | 4.54% | 6.75% |
|
∆
|
Source: FactSet Research Systems Inc.
|
Visit mfs.com/perf/r1 for more recent performance information.
FUND STATISTICS AS OF 1/31/26
| Net Assets ($): | 2,001,593,093 | Average Effective Maturity (yrs): | 3.4 | |
| Total Number of Holdings: | 367 | Average Effective Duration (yrs): | 2.7 | |
| Total Management Fee ($)#: | 8,553,745 | |||
| Portfolio Turnover Rate (%): | 51 |
# Includes the effect of any management fee waivers, if applicable.
Where the fund holds derivatives, they are not included in the total number of portfolio holdings.
PORTFOLIO COMPOSITION (BASED ON TOTAL INVESTMENTS AS OF 1/31/26)
Portfolio structure
| Fixed Income ~ | 97.0% |
| Money Market Funds | 3.0% |
| Equities | 0.0% |
Composition including fixed income credit
quality
quality
| BBB | 0.4% |
| BB | 45.4% |
| B | 38.4% |
| CCC | 11.0% |
| CC | 0.3% |
| Not Rated | 1.5% |
| Non-Fixed Income | 0.0% |
| Money Market Funds | 3.0% |
Ratings are assigned using Moody’s, Fitch, and Standard & Poor’s and applying a hierarchy: If all 3 agencies rate a security, the middle rating is assigned; if 2 agencies rate a security, the lower rating is assigned. If none of the 3 agencies rate a security, we use DBRS Morningstar. If none of the 4 agencies rate a security, we use Kroll Bond Rating Agency. Ratings are shown in the S&P and Fitch scale (e.g., AAA). All ratings are subject to change.
~ The fund invests a portion of its assets in Exchange-Traded Funds (ETFs) or Options on ETFs to gain fixed income exposure. Percentages include the direct exposure from investing in ETFs or Options on ETFs and not the indirect exposure to the underlying holdings.
Ratings are assigned using Moody’s, Fitch, and Standard & Poor’s and applying a hierarchy: If all 3 agencies rate a security, the middle rating is assigned; if 2 agencies rate a security, the lower rating is assigned. If none of the 3 agencies rate a security, we use DBRS Morningstar. If none of the 4 agencies rate a security, we use Kroll Bond Rating Agency. Ratings are shown in the S&P and Fitch scale (e.g., AAA). All ratings are subject to change.
FUND EXPENSES
What were the fund costs for the last year?
| (based on a hypothetical $10,000 investment) | ||
| Class Name | Costs of a $10,000 investment | Costs paid as a percentage of a $10,000 investment |
| I | $62 | 0.60% |
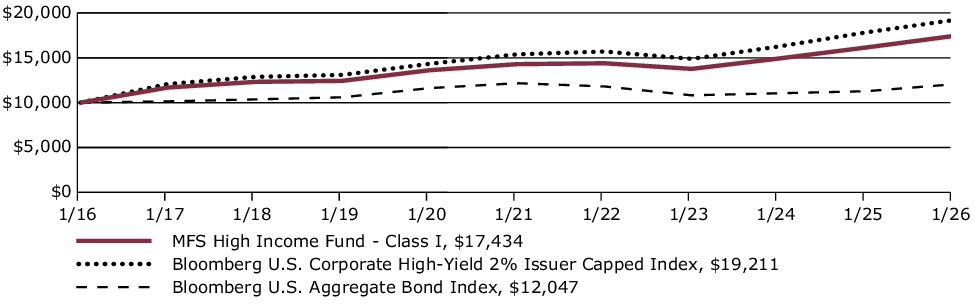
MANAGEMENT'S DISCUSSION OF FUND PERFORMANCE
-
For the twelve months ended January 31, 2026, Class I shares of the MFS High Income Fund (fund) provided a total return of 7.94%, at net asset value. This compares with a return of 6.85% for the fund’s benchmark, the Bloomberg U.S. Aggregate Bond Index. The fund's other benchmark, the Bloomberg U.S. Corporate High-Yield 2% Issuer Capped Index, generated a return of 7.70%.
-
Global equity markets reached record levels during the period, withstanding considerable volatility amid tariffs, geopolitical conflict and high levels of uncertainty. In the US, a pro-growth tax and spending bill was signed into law, while in Europe, renewed focus on defense and infrastructure spending brightened the outlook. In Japan, the election of a pro-growth prime minister sent stocks to new highs. Optimism over artificial intelligence remained quite high.
-
Considerable progress was made in trade talks between the US and many major trading partners, with a fragile truce between the US and China extended through late 2026. US tariffs remained high on goods from countries such as India and Brazil.
-
Moderating inflation pressures allowed many global central banks to ease monetary policy during the period. Amid a difficult policymaking environment and slower job growth, the Federal Reserve resumed easing policy in September and delivered quarter-point rate cuts in October and December.
-
In fixed income markets, global bond yields peaked near the start of the reporting period, then gradually declined, ending the reporting period marginally lower than at the start of the period, while experiencing waves of volatility in between. Both credit spreads and US bond market volatility (as measured by the Merrill Lynch Option Volatility Estimate (MOVE) Index), ended near session lows after rising in April and May due to tariff concerns.
-
Top contributors to performance relative to the Bloomberg U.S. Corporate High-Yield 2% Issuer Capped Index:
-
From a quality perspective, security selection within CCC, BB and B-rated bonds benefited relative performance.
-
From a sector perspective, favorable bond selection within the capital goods, consumer cyclicals, technology, and basic industry sectors strengthened relative returns.
-
-
Top detractors from performance relative to the Bloomberg U.S. Corporate High-Yield 2% Issuer Capped Index:
-
From a sector perspective, bond selection within the communications sector held back relative results.
-
During the reporting period, the fund's cash position weighed on relative performance.
-
FUND PERFORMANCE
The fund’s past performance is not a good predictor of the fund’s future performance. The graph and table below do not reflect the deduction of taxes that a shareholder would pay on fund distributions or the redemption of fund shares. The graph and table below assume reinvestment of dividends and capital gain distributions.
Growth of a Hypothetical $10,000 Investment
This graph shows the performance of a hypothetical $10,000 investment in Class I over a ten year period or since inception, if shorter, in comparison to (i) a broad measure of market performance and (ii) an additional index that MFS believes more closely reflects the market segments in which the fund invests.
Average Annual Total Returns through 1/31/26
This table shows the average annual total returns of the class of shares noted for the periods shown, both with (if any) and without sales charges. It also shows the average annual total returns of (i) a broad measure of market performance and (ii) an additional index that MFS believes more closely reflects the market segments in which the fund invests, over the same periods.
| Share Class | 1-yr | 5-yr | 10-yr |
| I without sales charge | 7.94% | 4.05% | 5.72% |
| Comparative Benchmark(s) | |||
| Bloomberg U.S. Aggregate Bond Index ∆ | 6.85% | (0.20)% | 1.88% |
| Bloomberg U.S. Corporate High-Yield 2% Issuer Capped Index ∆ | 7.70% | 4.54% | 6.75% |
|
∆
|
Source: FactSet Research Systems Inc.
|
Visit mfs.com/perf/i for more recent performance information.
FUND STATISTICS AS OF 1/31/26
| Net Assets ($): | 2,001,593,093 | Average Effective Maturity (yrs): | 3.4 | |
| Total Number of Holdings: | 367 | Average Effective Duration (yrs): | 2.7 | |
| Total Management Fee ($)#: | 8,553,745 | |||
| Portfolio Turnover Rate (%): | 51 |
# Includes the effect of any management fee waivers, if applicable.
Where the fund holds derivatives, they are not included in the total number of portfolio holdings.
PORTFOLIO COMPOSITION (BASED ON TOTAL INVESTMENTS AS OF 1/31/26)
Portfolio structure
| Fixed Income ~ | 97.0% |
| Money Market Funds | 3.0% |
| Equities | 0.0% |
Composition including fixed income credit
quality
quality
| BBB | 0.4% |
| BB | 45.4% |
| B | 38.4% |
| CCC | 11.0% |
| CC | 0.3% |
| Not Rated | 1.5% |
| Non-Fixed Income | 0.0% |
| Money Market Funds | 3.0% |
Ratings are assigned using Moody’s, Fitch, and Standard & Poor’s and applying a hierarchy: If all 3 agencies rate a security, the middle rating is assigned; if 2 agencies rate a security, the lower rating is assigned. If none of the 3 agencies rate a security, we use DBRS Morningstar. If none of the 4 agencies rate a security, we use Kroll Bond Rating Agency. Ratings are shown in the S&P and Fitch scale (e.g., AAA). All ratings are subject to change.
~ The fund invests a portion of its assets in Exchange-Traded Funds (ETFs) or Options on ETFs to gain fixed income exposure. Percentages include the direct exposure from investing in ETFs or Options on ETFs and not the indirect exposure to the underlying holdings.
Ratings are assigned using Moody’s, Fitch, and Standard & Poor’s and applying a hierarchy: If all 3 agencies rate a security, the middle rating is assigned; if 2 agencies rate a security, the lower rating is assigned. If none of the 3 agencies rate a security, we use DBRS Morningstar. If none of the 4 agencies rate a security, we use Kroll Bond Rating Agency. Ratings are shown in the S&P and Fitch scale (e.g., AAA). All ratings are subject to change.
FUND EXPENSES
What were the fund costs for the last year?
| (based on a hypothetical $10,000 investment) | ||
| Class Name | Costs of a $10,000 investment | Costs paid as a percentage of a $10,000 investment |
| C | $165 | 1.60% |
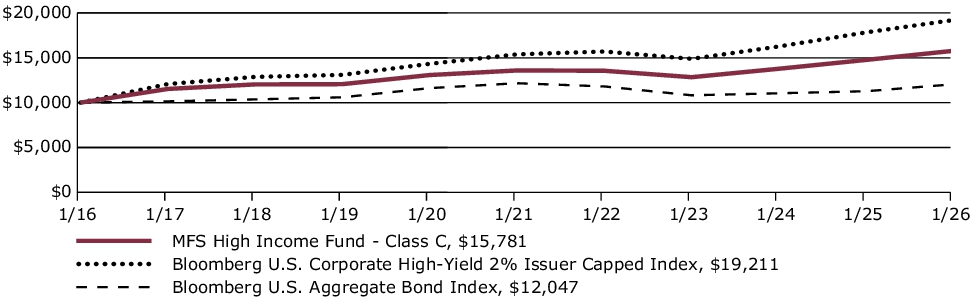
MANAGEMENT'S DISCUSSION OF FUND PERFORMANCE
-
For the twelve months ended January 31, 2026, Class C shares of the MFS High Income Fund (fund) provided a total return of 6.87%, at net asset value. This compares with a return of 6.85% for the fund’s benchmark, the Bloomberg U.S. Aggregate Bond Index. The fund's other benchmark, the Bloomberg U.S. Corporate High-Yield 2% Issuer Capped Index, generated a return of 7.70%.
-
Global equity markets reached record levels during the period, withstanding considerable volatility amid tariffs, geopolitical conflict and high levels of uncertainty. In the US, a pro-growth tax and spending bill was signed into law, while in Europe, renewed focus on defense and infrastructure spending brightened the outlook. In Japan, the election of a pro-growth prime minister sent stocks to new highs. Optimism over artificial intelligence remained quite high.
-
Considerable progress was made in trade talks between the US and many major trading partners, with a fragile truce between the US and China extended through late 2026. US tariffs remained high on goods from countries such as India and Brazil.
-
Moderating inflation pressures allowed many global central banks to ease monetary policy during the period. Amid a difficult policymaking environment and slower job growth, the Federal Reserve resumed easing policy in September and delivered quarter-point rate cuts in October and December.
-
In fixed income markets, global bond yields peaked near the start of the reporting period, then gradually declined, ending the reporting period marginally lower than at the start of the period, while experiencing waves of volatility in between. Both credit spreads and US bond market volatility (as measured by the Merrill Lynch Option Volatility Estimate (MOVE) Index), ended near session lows after rising in April and May due to tariff concerns.
-
Top contributors to performance relative to the Bloomberg U.S. Corporate High-Yield 2% Issuer Capped Index:
-
From a quality perspective, security selection within CCC, BB and B-rated bonds benefited relative performance.
-
From a sector perspective, favorable bond selection within the capital goods, consumer cyclicals, technology, and basic industry sectors strengthened relative returns.
-
-
Top detractors from performance relative to the Bloomberg U.S. Corporate High-Yield 2% Issuer Capped Index:
-
From a sector perspective, bond selection within the communications sector held back relative results.
-
During the reporting period, the fund's cash position weighed on relative performance.
-
FUND PERFORMANCE
The fund’s past performance is not a good predictor of the fund’s future performance. The graph and table below do not reflect the deduction of taxes that a shareholder would pay on fund distributions or the redemption of fund shares. The graph and table below assume reinvestment of dividends and capital gain distributions.
Growth of a Hypothetical $10,000 Investment
This graph shows the performance of a hypothetical $10,000 investment in Class C over a ten year period or since inception, if shorter, in comparison to (i) a broad measure of market performance and (ii) an additional index that MFS believes more closely reflects the market segments in which the fund invests.
Average Annual Total Returns through 1/31/26
This table shows the average annual total returns of the class of shares noted for the periods shown, both with (if any) and without sales charges. It also shows the average annual total returns of (i) a broad measure of market performance and (ii) an additional index that MFS believes more closely reflects the market segments in which the fund invests, over the same periods.
| Share Class | 1-yr | 5-yr | 10-yr |
| C without sales charge | 6.87% | 3.03% | 4.67% |
| C with CDSC (1% for 12 months)× | 5.87% | 3.03% | 4.67% |
| Comparative Benchmark(s) | |||
| Bloomberg U.S. Aggregate Bond Index ∆ | 6.85% | (0.20)% | 1.88% |
| Bloomberg U.S. Corporate High-Yield 2% Issuer Capped Index ∆ | 7.70% | 4.54% | 6.75% |
|
∆
|
Source: FactSet Research Systems Inc.
|
|
×
|
Assuming redemption at the end of the applicable period.
|
Visit mfs.com/perf/c for more recent performance information.
FUND STATISTICS AS OF 1/31/26
| Net Assets ($): | 2,001,593,093 | Average Effective Maturity (yrs): | 3.4 | |
| Total Number of Holdings: | 367 | Average Effective Duration (yrs): | 2.7 | |
| Total Management Fee ($)#: | 8,553,745 | |||
| Portfolio Turnover Rate (%): | 51 |
# Includes the effect of any management fee waivers, if applicable.
Where the fund holds derivatives, they are not included in the total number of portfolio holdings.
PORTFOLIO COMPOSITION (BASED ON TOTAL INVESTMENTS AS OF 1/31/26)
Portfolio structure
| Fixed Income ~ | 97.0% |
| Money Market Funds | 3.0% |
| Equities | 0.0% |
Composition including fixed income credit
quality
quality
| BBB | 0.4% |
| BB | 45.4% |
| B | 38.4% |
| CCC | 11.0% |
| CC | 0.3% |
| Not Rated | 1.5% |
| Non-Fixed Income | 0.0% |
| Money Market Funds | 3.0% |
Ratings are assigned using Moody’s, Fitch, and Standard & Poor’s and applying a hierarchy: If all 3 agencies rate a security, the middle rating is assigned; if 2 agencies rate a security, the lower rating is assigned. If none of the 3 agencies rate a security, we use DBRS Morningstar. If none of the 4 agencies rate a security, we use Kroll Bond Rating Agency. Ratings are shown in the S&P and Fitch scale (e.g., AAA). All ratings are subject to change.
~ The fund invests a portion of its assets in Exchange-Traded Funds (ETFs) or Options on ETFs to gain fixed income exposure. Percentages include the direct exposure from investing in ETFs or Options on ETFs and not the indirect exposure to the underlying holdings.
Ratings are assigned using Moody’s, Fitch, and Standard & Poor’s and applying a hierarchy: If all 3 agencies rate a security, the middle rating is assigned; if 2 agencies rate a security, the lower rating is assigned. If none of the 3 agencies rate a security, we use DBRS Morningstar. If none of the 4 agencies rate a security, we use Kroll Bond Rating Agency. Ratings are shown in the S&P and Fitch scale (e.g., AAA). All ratings are subject to change.
FUND EXPENSES
What were the fund costs for the last year?
| (based on a hypothetical $10,000 investment) | ||
| Class Name | Costs of a $10,000 investment | Costs paid as a percentage of a $10,000 investment |
| B | $165 | 1.60% |
MANAGEMENT'S DISCUSSION OF FUND PERFORMANCE
-
For the twelve months ended January 31, 2026, Class B shares of the MFS High Income Fund (fund) provided a total return of 6.87%, at net asset value. This compares with a return of 6.85% for the fund’s benchmark, the Bloomberg U.S. Aggregate Bond Index. The fund's other benchmark, the Bloomberg U.S. Corporate High-Yield 2% Issuer Capped Index, generated a return of 7.70%.
-
Global equity markets reached record levels during the period, withstanding considerable volatility amid tariffs, geopolitical conflict and high levels of uncertainty. In the US, a pro-growth tax and spending bill was signed into law, while in Europe, renewed focus on defense and infrastructure spending brightened the outlook. In Japan, the election of a pro-growth prime minister sent stocks to new highs. Optimism over artificial intelligence remained quite high.
-
Considerable progress was made in trade talks between the US and many major trading partners, with a fragile truce between the US and China extended through late 2026. US tariffs remained high on goods from countries such as India and Brazil.
-
Moderating inflation pressures allowed many global central banks to ease monetary policy during the period. Amid a difficult policymaking environment and slower job growth, the Federal Reserve resumed easing policy in September and delivered quarter-point rate cuts in October and December.
-
In fixed income markets, global bond yields peaked near the start of the reporting period, then gradually declined, ending the reporting period marginally lower than at the start of the period, while experiencing waves of volatility in between. Both credit spreads and US bond market volatility (as measured by the Merrill Lynch Option Volatility Estimate (MOVE) Index), ended near session lows after rising in April and May due to tariff concerns.
-
Top contributors to performance relative to the Bloomberg U.S. Corporate High-Yield 2% Issuer Capped Index:
-
From a quality perspective, security selection within CCC, BB and B-rated bonds benefited relative performance.
-
From a sector perspective, favorable bond selection within the capital goods, consumer cyclicals, technology, and basic industry sectors strengthened relative returns.
-
-
Top detractors from performance relative to the Bloomberg U.S. Corporate High-Yield 2% Issuer Capped Index:
-
From a sector perspective, bond selection within the communications sector held back relative results.
-
During the reporting period, the fund's cash position weighed on relative performance.
-
FUND PERFORMANCE
The fund’s past performance is not a good predictor of the fund’s future performance. The graph and table below do not reflect the deduction of taxes that a shareholder would pay on fund distributions or the redemption of fund shares. The graph and table below assume reinvestment of dividends and capital gain distributions.
Growth of a Hypothetical $10,000 Investment
This graph shows the performance of a hypothetical $10,000 investment in Class B over a ten year period or since inception, if shorter, in comparison to (i) a broad measure of market performance and (ii) an additional index that MFS believes more closely reflects the market segments in which the fund invests.

Average Annual Total Returns through 1/31/26
This table shows the average annual total returns of the class of shares noted for the periods shown, both with (if any) and without sales charges. It also shows the average annual total returns of (i) a broad measure of market performance and (ii) an additional index that MFS believes more closely reflects the market segments in which the fund invests, over the same periods.
| Share Class | 1-yr | 5-yr | 10-yr |
| B without sales charge | 6.87% | 3.03% | 4.67% |
| B with CDSC (declining over six years from 4% to 0%)× | 2.87% | 2.70% | 4.67% |
| Comparative Benchmark(s) | |||
| Bloomberg U.S. Aggregate Bond Index ∆ | 6.85% | (0.20)% | 1.88% |
| Bloomberg U.S. Corporate High-Yield 2% Issuer Capped Index ∆ | 7.70% | 4.54% | 6.75% |
|
∆
|
Source: FactSet Research Systems Inc.
|
|
×
|
Assuming redemption at the end of the applicable period.
|
Visit mfs.com/perf/b for more recent performance information.
FUND STATISTICS AS OF 1/31/26
| Net Assets ($): | 2,001,593,093 | Average Effective Maturity (yrs): | 3.4 | |
| Total Number of Holdings: | 367 | Average Effective Duration (yrs): | 2.7 | |
| Total Management Fee ($)#: | 8,553,745 | |||
| Portfolio Turnover Rate (%): | 51 |
# Includes the effect of any management fee waivers, if applicable.
Where the fund holds derivatives, they are not included in the total number of portfolio holdings.
PORTFOLIO COMPOSITION (BASED ON TOTAL INVESTMENTS AS OF 1/31/26)
Portfolio structure
| Fixed Income ~ | 97.0% |
| Money Market Funds | 3.0% |
| Equities | 0.0% |
Composition including fixed income credit
quality
quality
| BBB | 0.4% |
| BB | 45.4% |
| B | 38.4% |
| CCC | 11.0% |
| CC | 0.3% |
| Not Rated | 1.5% |
| Non-Fixed Income | 0.0% |
| Money Market Funds | 3.0% |
Ratings are assigned using Moody’s, Fitch, and Standard & Poor’s and applying a hierarchy: If all 3 agencies rate a security, the middle rating is assigned; if 2 agencies rate a security, the lower rating is assigned. If none of the 3 agencies rate a security, we use DBRS Morningstar. If none of the 4 agencies rate a security, we use Kroll Bond Rating Agency. Ratings are shown in the S&P and Fitch scale (e.g., AAA). All ratings are subject to change.
~ The fund invests a portion of its assets in Exchange-Traded Funds (ETFs) or Options on ETFs to gain fixed income exposure. Percentages include the direct exposure from investing in ETFs or Options on ETFs and not the indirect exposure to the underlying holdings.
Ratings are assigned using Moody’s, Fitch, and Standard & Poor’s and applying a hierarchy: If all 3 agencies rate a security, the middle rating is assigned; if 2 agencies rate a security, the lower rating is assigned. If none of the 3 agencies rate a security, we use DBRS Morningstar. If none of the 4 agencies rate a security, we use Kroll Bond Rating Agency. Ratings are shown in the S&P and Fitch scale (e.g., AAA). All ratings are subject to change.
FUND EXPENSES
What were the fund costs for the last year?
| (based on a hypothetical $10,000 investment) | ||
| Class Name | Costs of a $10,000 investment | Costs paid as a percentage of a $10,000 investment |
| A | $88 | 0.85% |
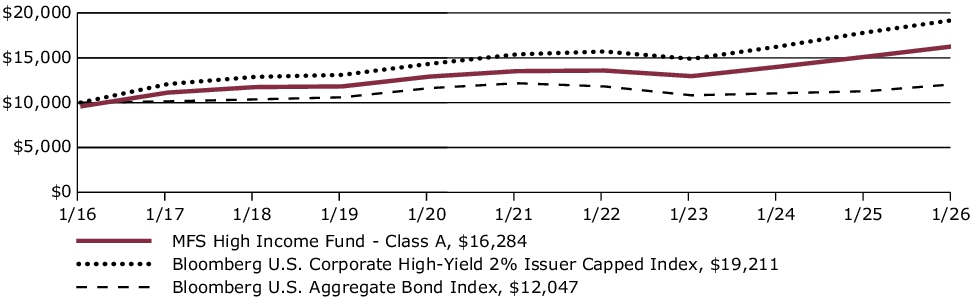
MANAGEMENT'S DISCUSSION OF FUND PERFORMANCE
-
For the twelve months ended January 31, 2026, Class A shares of the MFS High Income Fund (fund) provided a total return of 7.67%, at net asset value. This compares with a return of 6.85% for the fund’s benchmark, the Bloomberg U.S. Aggregate Bond Index. The fund's other benchmark, the Bloomberg U.S. Corporate High-Yield 2% Issuer Capped Index, generated a return of 7.70%.
-
Global equity markets reached record levels during the period, withstanding considerable volatility amid tariffs, geopolitical conflict and high levels of uncertainty. In the US, a pro-growth tax and spending bill was signed into law, while in Europe, renewed focus on defense and infrastructure spending brightened the outlook. In Japan, the election of a pro-growth prime minister sent stocks to new highs. Optimism over artificial intelligence remained quite high.
-
Considerable progress was made in trade talks between the US and many major trading partners, with a fragile truce between the US and China extended through late 2026. US tariffs remained high on goods from countries such as India and Brazil.
-
Moderating inflation pressures allowed many global central banks to ease monetary policy during the period. Amid a difficult policymaking environment and slower job growth, the Federal Reserve resumed easing policy in September and delivered quarter-point rate cuts in October and December.
-
In fixed income markets, global bond yields peaked near the start of the reporting period, then gradually declined, ending the reporting period marginally lower than at the start of the period, while experiencing waves of volatility in between. Both credit spreads and US bond market volatility (as measured by the Merrill Lynch Option Volatility Estimate (MOVE) Index), ended near session lows after rising in April and May due to tariff concerns.
-
Top contributors to performance relative to the Bloomberg U.S. Corporate High-Yield 2% Issuer Capped Index:
-
From a quality perspective, security selection within CCC, BB and B-rated bonds benefited relative performance.
-
From a sector perspective, favorable bond selection within the capital goods, consumer cyclicals, technology, and basic industry sectors strengthened relative returns.
-
-
Top detractors from performance relative to the Bloomberg U.S. Corporate High-Yield 2% Issuer Capped Index:
-
From a sector perspective, bond selection within the communications sector held back relative results.
-
During the reporting period, the fund's cash position weighed on relative performance.
-
FUND PERFORMANCE
The fund’s past performance is not a good predictor of the fund’s future performance. The graph and table below do not reflect the deduction of taxes that a shareholder would pay on fund distributions or the redemption of fund shares. The graph and table below assume reinvestment of dividends and capital gain distributions.
Growth of a Hypothetical $10,000 Investment
This graph shows the performance of a hypothetical $10,000 investment in Class A over a ten year period or since inception, if shorter, in comparison to (i) a broad measure of market performance and (ii) an additional index that MFS believes more closely reflects the market segments in which the fund invests. This graph includes the deduction of the maximum applicable sales charge.
Average Annual Total Returns through 1/31/26
This table shows the average annual total returns of the class of shares noted for the periods shown, both with (if any) and without sales charges. It also shows the average annual total returns of (i) a broad measure of market performance and (ii) an additional index that MFS believes more closely reflects the market segments in which the fund invests, over the same periods.
| Share Class | 1-yr | 5-yr | 10-yr |
| A without sales charge | 7.67% | 3.80% | 5.45% |
| A with initial sales charge (4.25%) | 3.10% | 2.90% | 5.00% |
| Comparative Benchmark(s) | |||
| Bloomberg U.S. Aggregate Bond Index ∆ | 6.85% | (0.20)% | 1.88% |
| Bloomberg U.S. Corporate High-Yield 2% Issuer Capped Index ∆ | 7.70% | 4.54% | 6.75% |
|
∆
|
Source: FactSet Research Systems Inc.
|
Visit mfs.com/perf/a for more recent performance information.
FUND STATISTICS AS OF 1/31/26
| Net Assets ($): | 2,001,593,093 | Average Effective Maturity (yrs): | 3.4 | |
| Total Number of Holdings: | 367 | Average Effective Duration (yrs): | 2.7 | |
| Total Management Fee ($)#: | 8,553,745 | |||
| Portfolio Turnover Rate (%): | 51 |
# Includes the effect of any management fee waivers, if applicable.
Where the fund holds derivatives, they are not included in the total number of portfolio holdings.
PORTFOLIO COMPOSITION (BASED ON TOTAL INVESTMENTS AS OF 1/31/26)
Portfolio structure
| Fixed Income ~ | 97.0% |
| Money Market Funds | 3.0% |
| Equities | 0.0% |
Composition including fixed income credit
quality
quality
| BBB | 0.4% |
| BB | 45.4% |
| B | 38.4% |
| CCC | 11.0% |
| CC | 0.3% |
| Not Rated | 1.5% |
| Non-Fixed Income | 0.0% |
| Money Market Funds | 3.0% |
Ratings are assigned using Moody’s, Fitch, and Standard & Poor’s and applying a hierarchy: If all 3 agencies rate a security, the middle rating is assigned; if 2 agencies rate a security, the lower rating is assigned. If none of the 3 agencies rate a security, we use DBRS Morningstar. If none of the 4 agencies rate a security, we use Kroll Bond Rating Agency. Ratings are shown in the S&P and Fitch scale (e.g., AAA). All ratings are subject to change.
~ The fund invests a portion of its assets in Exchange-Traded Funds (ETFs) or Options on ETFs to gain fixed income exposure. Percentages include the direct exposure from investing in ETFs or Options on ETFs and not the indirect exposure to the underlying holdings.
Ratings are assigned using Moody’s, Fitch, and Standard & Poor’s and applying a hierarchy: If all 3 agencies rate a security, the middle rating is assigned; if 2 agencies rate a security, the lower rating is assigned. If none of the 3 agencies rate a security, we use DBRS Morningstar. If none of the 4 agencies rate a security, we use Kroll Bond Rating Agency. Ratings are shown in the S&P and Fitch scale (e.g., AAA). All ratings are subject to change.
This report describes certain changes to the Fund that occurred during the reporting period.
FUND EXPENSES
What were the fund costs for the last year?
| (based on a hypothetical $10,000 investment) | ||
| Class Name | Costs of a $10,000 investment ~ | Costs paid as a percentage of a $10,000 investment ~ |
| A | $107 | 1.03% |
˜ Expenses are direct expenses and do not include underlying fund fees and expenses.
MANAGEMENT'S DISCUSSION OF FUND PERFORMANCE
-
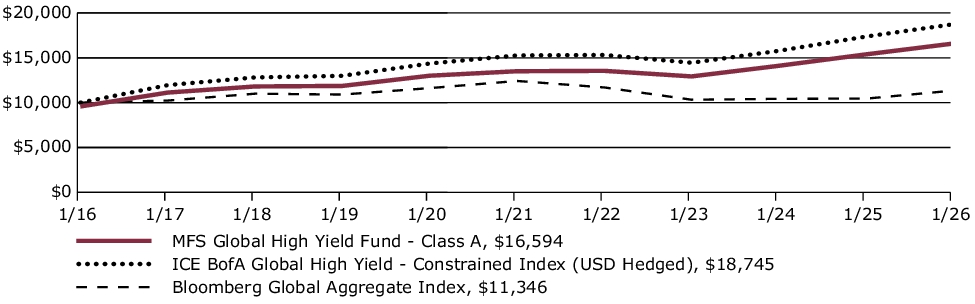
For the twelve months ended January 31, 2026, Class A shares of the MFS Global High Yield Fund (fund) provided a total return of 7.85%, at net asset value. This compares with a return of 8.56% for the fund’s benchmark, the Bloomberg Global Aggregate Index. The fund's other benchmark, the ICE BofA Global High Yield - Constrained Index (USD Hedged), generated a return of 7.91%.
-
In addition to investing directly in portfolio securities, the fund also invests indirectly in portfolio securities through investment in the MFS High Yield Pooled Portfolio, a mutual fund also advised by MFS. The discussion below reflects both the fund’s direct and indirect investments.
-
Global equity markets reached record levels during the period, withstanding considerable volatility amid tariffs, geopolitical conflict and high levels of uncertainty. In the US, a pro-growth tax and spending bill was signed into law, while in Europe, renewed focus on defense and infrastructure spending brightened the outlook. In Japan, the election of a pro-growth prime minister sent stocks to new highs. Optimism over artificial intelligence remained quite high.
-
Considerable progress was made in trade talks between the US and many major trading partners, with a fragile truce between the US and China extended through late 2026. US tariffs remained high on goods from countries such as India and Brazil.
-
Moderating inflation pressures allowed many global central banks to ease monetary policy during the period. Amid a difficult policymaking environment and slower job growth, the Federal Reserve resumed easing policy in September and delivered quarter-point rate cuts in October and December.
-
In fixed income markets, global bond yields peaked near the start of the reporting period, then gradually declined, ending the reporting period marginally lower than at the start of the period, while experiencing waves of volatility in between. Both credit spreads and US bond market volatility (as measured by the Merrill Lynch Option Volatility Estimate (MOVE) Index), ended near session lows after rising in April and May due to tariff concerns.
-
Top contributors to performance relative to the ICE BofA Global High Yield - Constrained Index (USD Hedged):
-
Bond selection within the North America, Europe/UK and EM regions, particularly within CCC, BB and B-rated bonds, benefited relative performance. From a sector perspective, favorable bond selection within the basic industry, consumer cyclicals, capital goods, and technology sectors strengthened relative returns.
-
The fund's yield curve positioning also contributed to relative performance.
-
-
Top detractors from performance relative to the ICE BofA Global High Yield - Constrained Index (USD Hedged):
-
The fund's overweight allocation to the capital goods sector held back relative performance.
-
The fund's holding of cash also detracted from relative returns.
-
FUND PERFORMANCE
The fund’s past performance is not a good predictor of the fund’s future performance. The graph and table below do not reflect the deduction of taxes that a shareholder would pay on fund distributions or the redemption of fund shares. The graph and table below assume reinvestment of dividends and capital gain distributions.
Growth of a Hypothetical $10,000 Investment
This graph shows the performance of a hypothetical $10,000 investment in Class A over a ten year period or since inception, if shorter, in comparison to (i) a broad measure of market performance and (ii) an additional index that MFS believes more closely reflects the market segments in which the fund invests. This graph includes the deduction of the maximum applicable sales charge.
Average Annual Total Returns through 1/31/26
This table shows the average annual total returns of the class of shares noted for the periods shown, both with (if any) and without sales charges. It also shows the average annual total returns of (i) a broad measure of market performance and (ii) an additional index that MFS believes more closely reflects the market segments in which the fund invests, over the same periods.
| Share Class | 1-yr | 5-yr | 10-yr |
| A without sales charge | 7.85% | 4.21% | 5.65% |
| A with initial sales charge (4.25%) | 3.27% | 3.31% | 5.20% |
| Comparative Benchmark(s) | |||
| Bloomberg Global Aggregate Index ∆ | 8.56% | (1.79)% | 1.27% |
| ICE BofA Global High Yield - Constrained Index (USD Hedged) ∆ | 7.91% | 4.19% | 6.49% |
|
∆
|
Source: FactSet Research Systems Inc.
|
Visit mfs.com/perf/a for more recent performance information.
FUND STATISTICS AS OF 1/31/26
| Net Assets ($): | 206,952,691 | Average Effective Maturity (yrs): | 3.5 | |
| Total Number of Holdings: | 137 | Average Effective Duration (yrs): | 2.8 | |
| Total Management Fee ($)#: | 1,200,687 | |||
| Portfolio Turnover Rate (%): | 38 |
# Includes the effect of any management fee waivers, if applicable.
Where the fund holds derivatives, they are not included in the total number of portfolio holdings.
PORTFOLIO COMPOSITION (BASED ON TOTAL INVESTMENTS AS OF 1/31/26)
Portfolio structure
| Fixed Income ~ | 95.8% |
| Money Market Funds | 4.1% |
| Equities | 0.1% |
Issuer country weightings
| United States | 59.0% |
| Canada | 4.1% |
| United Kingdom | 4.0% |
| France | 3.3% |
| Italy | 2.3% |
| Brazil | 2.0% |
| Mexico | 1.9% |
| Luxembourg | 1.8% |
| India | 1.5% |
| Other Countries | 20.1% |
Composition including fixed income credit
quality
quality
| BBB | 0.4% |
| BB | 45.8% |
| B | 38.8% |
| CCC | 9.2% |
| CC | 0.5% |
| C | 0.0% |
| D | 0.1% |
| Not Rated | 1.0% |
| Non-Fixed Income | 0.1% |
| Money Market Funds | 4.1% |
Ratings are assigned using Moody’s, Fitch, and Standard & Poor’s and applying a hierarchy: If all 3 agencies rate a security, the middle rating is assigned; if 2 agencies rate a security, the lower rating is assigned. If none of the 3 agencies rate a security, we use DBRS Morningstar. If none of the 4 agencies rate a security, we use Kroll Bond Rating Agency. Ratings are shown in the S&P and Fitch scale (e.g., AAA). All ratings are subject to change.
The fund invests a portion of its assets in the MFS High Yield Pooled Portfolio. Percentages include the indirect exposure to the underlying holdings of the MFS High Yield Pooled Portfolio and not the direct exposure from investing in the MFS High Yield Pooled Portfolio itself.
~ The fund invests a portion of its assets in Exchange-Traded Funds (ETFs) or Options on ETFs to gain fixed income exposure. Percentages include the direct exposure from investing in ETFs or Options on ETFs and not the indirect exposure to the underlying holdings.
Ratings are assigned using Moody’s, Fitch, and Standard & Poor’s and applying a hierarchy: If all 3 agencies rate a security, the middle rating is assigned; if 2 agencies rate a security, the lower rating is assigned. If none of the 3 agencies rate a security, we use DBRS Morningstar. If none of the 4 agencies rate a security, we use Kroll Bond Rating Agency. Ratings are shown in the S&P and Fitch scale (e.g., AAA). All ratings are subject to change.
MATERIAL FUND CHANGES
This is a summary of certain changes to the fund since February 1, 2025. For more complete information, you may review the fund's prospectus as amended, which is available at funds.mfs.com or upon request at 1‑800‑225‑2606.
Effective August 1, 2025, for Class A shares, the investment adviser has agreed in writing to pay a portion of the fund’s total annual operating expenses, excluding interest, taxes, extraordinary expenses, brokerage and transaction costs, certain tax reclaim recovery expenses (including contingency fees and closing agreement expenses), and investment-related expenses (such as fees and expenses associated with investments in investment companies and other similar investment vehicles), such that total operating expenses do not exceed 1.00% annually of the class’s average daily net assets. This written agreement will continue until modified by the fund’s Board of Trustees, but such agreement will continue at least until May 31, 2027.
Effective August 1, 2025, for Class A shares, the investment adviser has agreed in writing to pay a portion of the fund’s total annual operating expenses, excluding interest, taxes, extraordinary expenses, brokerage and transaction costs, certain tax reclaim recovery expenses (including contingency fees and closing agreement expenses), and investment-related expenses (such as fees and expenses associated with investments in investment companies and other similar investment vehicles), such that total operating expenses do not exceed 1.00% annually of the class’s average daily net assets. This written agreement will continue until modified by the fund’s Board of Trustees, but such agreement will continue at least until May 31, 2027.
This is a summary of certain changes to the fund since February 1, 2025. For more complete information, you may review the fund's prospectus as amended, which is available at funds.mfs.com or upon request at 1‑800‑225‑2606.
This report describes certain changes to the Fund that occurred during the reporting period.
FUND EXPENSES
What were the fund costs for the last year?
| (based on a hypothetical $10,000 investment) | ||
| Class Name | Costs of a $10,000 investment ~ | Costs paid as a percentage of a $10,000 investment ~ |
| B | $184 | 1.78% |
˜ Expenses are direct expenses and do not include underlying fund fees and expenses.
MANAGEMENT'S DISCUSSION OF FUND PERFORMANCE
-
For the twelve months ended January 31, 2026, Class B shares of the MFS Global High Yield Fund (fund) provided a total return of 6.86%, at net asset value. This compares with a return of 8.56% for the fund’s benchmark, the Bloomberg Global Aggregate Index. The fund's other benchmark, the ICE BofA Global High Yield - Constrained Index (USD Hedged), generated a return of 7.91%.
-
In addition to investing directly in portfolio securities, the fund also invests indirectly in portfolio securities through investment in the MFS High Yield Pooled Portfolio, a mutual fund also advised by MFS. The discussion below reflects both the fund’s direct and indirect investments.
-
Global equity markets reached record levels during the period, withstanding considerable volatility amid tariffs, geopolitical conflict and high levels of uncertainty. In the US, a pro-growth tax and spending bill was signed into law, while in Europe, renewed focus on defense and infrastructure spending brightened the outlook. In Japan, the election of a pro-growth prime minister sent stocks to new highs. Optimism over artificial intelligence remained quite high.
-
Considerable progress was made in trade talks between the US and many major trading partners, with a fragile truce between the US and China extended through late 2026. US tariffs remained high on goods from countries such as India and Brazil.
-
Moderating inflation pressures allowed many global central banks to ease monetary policy during the period. Amid a difficult policymaking environment and slower job growth, the Federal Reserve resumed easing policy in September and delivered quarter-point rate cuts in October and December.
-
In fixed income markets, global bond yields peaked near the start of the reporting period, then gradually declined, ending the reporting period marginally lower than at the start of the period, while experiencing waves of volatility in between. Both credit spreads and US bond market volatility (as measured by the Merrill Lynch Option Volatility Estimate (MOVE) Index), ended near session lows after rising in April and May due to tariff concerns.
-
Top contributors to performance relative to the ICE BofA Global High Yield - Constrained Index (USD Hedged):
-
Bond selection within the North America, Europe/UK and EM regions, particularly within CCC, BB and B-rated bonds, benefited relative performance. From a sector perspective, favorable bond selection within the basic industry, consumer cyclicals, capital goods, and technology sectors strengthened relative returns.
-
The fund's yield curve positioning also contributed to relative performance.
-
-
Top detractors from performance relative to the ICE BofA Global High Yield - Constrained Index (USD Hedged):
-
The fund's overweight allocation to the capital goods sector held back relative performance.
-
The fund's holding of cash also detracted from relative returns.
-
FUND PERFORMANCE
The fund’s past performance is not a good predictor of the fund’s future performance. The graph and table below do not reflect the deduction of taxes that a shareholder would pay on fund distributions or the redemption of fund shares. The graph and table below assume reinvestment of dividends and capital gain distributions.
Growth of a Hypothetical $10,000 Investment
This graph shows the performance of a hypothetical $10,000 investment in Class B over a ten year period or since inception, if shorter, in comparison to (i) a broad measure of market performance and (ii) an additional index that MFS believes more closely reflects the market segments in which the fund invests.
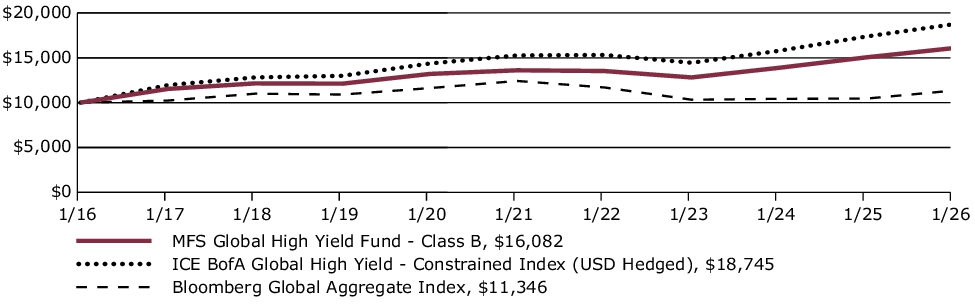
Average Annual Total Returns through 1/31/26
This table shows the average annual total returns of the class of shares noted for the periods shown, both with (if any) and without sales charges. It also shows the average annual total returns of (i) a broad measure of market performance and (ii) an additional index that MFS believes more closely reflects the market segments in which the fund invests, over the same periods.
| Share Class | 1-yr | 5-yr | 10-yr |
| B without sales charge | 6.86% | 3.40% | 4.87% |
| B with CDSC (declining over six years from 4% to 0%)× | 2.86% | 3.08% | 4.87% |
| Comparative Benchmark(s) | |||
| Bloomberg Global Aggregate Index ∆ | 8.56% | (1.79)% | 1.27% |
| ICE BofA Global High Yield - Constrained Index (USD Hedged) ∆ | 7.91% | 4.19% | 6.49% |
|
∆
|
Source: FactSet Research Systems Inc.
|
|
×
|
Assuming redemption at the end of the applicable period.
|
Visit mfs.com/perf/b for more recent performance information.
FUND STATISTICS AS OF 1/31/26
| Net Assets ($): | 206,952,691 | Average Effective Maturity (yrs): | 3.5 | |
| Total Number of Holdings: | 137 | Average Effective Duration (yrs): | 2.8 | |
| Total Management Fee ($)#: | 1,200,687 | |||
| Portfolio Turnover Rate (%): | 38 |
# Includes the effect of any management fee waivers, if applicable.
Where the fund holds derivatives, they are not included in the total number of portfolio holdings.
PORTFOLIO COMPOSITION (BASED ON TOTAL INVESTMENTS AS OF 1/31/26)
Portfolio structure
| Fixed Income ~ | 95.8% |
| Money Market Funds | 4.1% |
| Equities | 0.1% |
Issuer country weightings
| United States | 59.0% |
| Canada | 4.1% |
| United Kingdom | 4.0% |
| France | 3.3% |
| Italy | 2.3% |
| Brazil | 2.0% |
| Mexico | 1.9% |
| Luxembourg | 1.8% |
| India | 1.5% |
| Other Countries | 20.1% |
Composition including fixed income credit
quality
quality
| BBB | 0.4% |
| BB | 45.8% |
| B | 38.8% |
| CCC | 9.2% |
| CC | 0.5% |
| C | 0.0% |
| D | 0.1% |
| Not Rated | 1.0% |
| Non-Fixed Income | 0.1% |
| Money Market Funds | 4.1% |
Ratings are assigned using Moody’s, Fitch, and Standard & Poor’s and applying a hierarchy: If all 3 agencies rate a security, the middle rating is assigned; if 2 agencies rate a security, the lower rating is assigned. If none of the 3 agencies rate a security, we use DBRS Morningstar. If none of the 4 agencies rate a security, we use Kroll Bond Rating Agency. Ratings are shown in the S&P and Fitch scale (e.g., AAA). All ratings are subject to change.
The fund invests a portion of its assets in the MFS High Yield Pooled Portfolio. Percentages include the indirect exposure to the underlying holdings of the MFS High Yield Pooled Portfolio and not the direct exposure from investing in the MFS High Yield Pooled Portfolio itself.
~ The fund invests a portion of its assets in Exchange-Traded Funds (ETFs) or Options on ETFs to gain fixed income exposure. Percentages include the direct exposure from investing in ETFs or Options on ETFs and not the indirect exposure to the underlying holdings.
Ratings are assigned using Moody’s, Fitch, and Standard & Poor’s and applying a hierarchy: If all 3 agencies rate a security, the middle rating is assigned; if 2 agencies rate a security, the lower rating is assigned. If none of the 3 agencies rate a security, we use DBRS Morningstar. If none of the 4 agencies rate a security, we use Kroll Bond Rating Agency. Ratings are shown in the S&P and Fitch scale (e.g., AAA). All ratings are subject to change.
MATERIAL FUND CHANGES
This is a summary of certain changes to the fund since February 1, 2025. For more complete information, you may review the fund's prospectus as amended, which is available at funds.mfs.com or upon request at 1‑800‑225‑2606.
Effective August 1, 2025, for Class B shares, the investment adviser has agreed in writing to pay a portion of the fund’s total annual operating expenses, excluding interest, taxes, extraordinary expenses, brokerage and transaction costs, certain tax reclaim recovery expenses (including contingency fees and closing agreement expenses), and investment-related expenses (such as fees and expenses associated with investments in investment companies and other similar investment vehicles), such that total operating expenses do not exceed 1.75% annually of the class’s average daily net assets. This written agreement will continue until modified by the fund’s Board of Trustees, but such agreement will continue at least until May 31, 2027.
Effective August 1, 2025, for Class B shares, the investment adviser has agreed in writing to pay a portion of the fund’s total annual operating expenses, excluding interest, taxes, extraordinary expenses, brokerage and transaction costs, certain tax reclaim recovery expenses (including contingency fees and closing agreement expenses), and investment-related expenses (such as fees and expenses associated with investments in investment companies and other similar investment vehicles), such that total operating expenses do not exceed 1.75% annually of the class’s average daily net assets. This written agreement will continue until modified by the fund’s Board of Trustees, but such agreement will continue at least until May 31, 2027.
This is a summary of certain changes to the fund since February 1, 2025. For more complete information, you may review the fund's prospectus as amended, which is available at funds.mfs.com or upon request at 1‑800‑225‑2606.
This report describes certain changes to the Fund that occurred during the reporting period.
FUND EXPENSES
What were the fund costs for the last year?
| (based on a hypothetical $10,000 investment) | ||
| Class Name | Costs of a $10,000 investment ~ | Costs paid as a percentage of a $10,000 investment ~ |
| C | $184 | 1.78% |
˜ Expenses are direct expenses and do not include underlying fund fees and expenses.
MANAGEMENT'S DISCUSSION OF FUND PERFORMANCE
-
For the twelve months ended January 31, 2026, Class C shares of the MFS Global High Yield Fund (fund) provided a total return of 6.86%, at net asset value. This compares with a return of 8.56% for the fund’s benchmark, the Bloomberg Global Aggregate Index. The fund's other benchmark, the ICE BofA Global High Yield - Constrained Index (USD Hedged), generated a return of 7.91%.
-
In addition to investing directly in portfolio securities, the fund also invests indirectly in portfolio securities through investment in the MFS High Yield Pooled Portfolio, a mutual fund also advised by MFS. The discussion below reflects both the fund’s direct and indirect investments.
-
Global equity markets reached record levels during the period, withstanding considerable volatility amid tariffs, geopolitical conflict and high levels of uncertainty. In the US, a pro-growth tax and spending bill was signed into law, while in Europe, renewed focus on defense and infrastructure spending brightened the outlook. In Japan, the election of a pro-growth prime minister sent stocks to new highs. Optimism over artificial intelligence remained quite high.
-
Considerable progress was made in trade talks between the US and many major trading partners, with a fragile truce between the US and China extended through late 2026. US tariffs remained high on goods from countries such as India and Brazil.
-
Moderating inflation pressures allowed many global central banks to ease monetary policy during the period. Amid a difficult policymaking environment and slower job growth, the Federal Reserve resumed easing policy in September and delivered quarter-point rate cuts in October and December.
-
In fixed income markets, global bond yields peaked near the start of the reporting period, then gradually declined, ending the reporting period marginally lower than at the start of the period, while experiencing waves of volatility in between. Both credit spreads and US bond market volatility (as measured by the Merrill Lynch Option Volatility Estimate (MOVE) Index), ended near session lows after rising in April and May due to tariff concerns.
-
Top contributors to performance relative to the ICE BofA Global High Yield - Constrained Index (USD Hedged):
-
Bond selection within the North America, Europe/UK and EM regions, particularly within CCC, BB and B-rated bonds, benefited relative performance. From a sector perspective, favorable bond selection within the basic industry, consumer cyclicals, capital goods, and technology sectors strengthened relative returns.
-
The fund's yield curve positioning also contributed to relative performance.
-
-
Top detractors from performance relative to the ICE BofA Global High Yield - Constrained Index (USD Hedged):
-
The fund's overweight allocation to the capital goods sector held back relative performance.
-
The fund's holding of cash also detracted from relative returns.
-
FUND PERFORMANCE
The fund’s past performance is not a good predictor of the fund’s future performance. The graph and table below do not reflect the deduction of taxes that a shareholder would pay on fund distributions or the redemption of fund shares. The graph and table below assume reinvestment of dividends and capital gain distributions.
Growth of a Hypothetical $10,000 Investment
This graph shows the performance of a hypothetical $10,000 investment in Class C over a ten year period or since inception, if shorter, in comparison to (i) a broad measure of market performance and (ii) an additional index that MFS believes more closely reflects the market segments in which the fund invests.

Average Annual Total Returns through 1/31/26
This table shows the average annual total returns of the class of shares noted for the periods shown, both with (if any) and without sales charges. It also shows the average annual total returns of (i) a broad measure of market performance and (ii) an additional index that MFS believes more closely reflects the market segments in which the fund invests, over the same periods.
| Share Class | 1-yr | 5-yr | 10-yr |
| C without sales charge | 6.86% | 3.39% | 4.87% |
| C with CDSC (1% for 12 months)× | 5.86% | 3.39% | 4.87% |
| Comparative Benchmark(s) | |||
| Bloomberg Global Aggregate Index ∆ | 8.56% | (1.79)% | 1.27% |
| ICE BofA Global High Yield - Constrained Index (USD Hedged) ∆ | 7.91% | 4.19% | 6.49% |
|
∆
|
Source: FactSet Research Systems Inc.
|
|
×
|
Assuming redemption at the end of the applicable period.
|
Visit mfs.com/perf/c for more recent performance information.
FUND STATISTICS AS OF 1/31/26
| Net Assets ($): | 206,952,691 | Average Effective Maturity (yrs): | 3.5 | |
| Total Number of Holdings: | 137 | Average Effective Duration (yrs): | 2.8 | |
| Total Management Fee ($)#: | 1,200,687 | |||
| Portfolio Turnover Rate (%): | 38 |
# Includes the effect of any management fee waivers, if applicable.
Where the fund holds derivatives, they are not included in the total number of portfolio holdings.
PORTFOLIO COMPOSITION (BASED ON TOTAL INVESTMENTS AS OF 1/31/26)
Portfolio structure
| Fixed Income ~ | 95.8% |
| Money Market Funds | 4.1% |
| Equities | 0.1% |
Issuer country weightings
| United States | 59.0% |
| Canada | 4.1% |
| United Kingdom | 4.0% |
| France | 3.3% |
| Italy | 2.3% |
| Brazil | 2.0% |
| Mexico | 1.9% |
| Luxembourg | 1.8% |
| India | 1.5% |
| Other Countries | 20.1% |
Composition including fixed income credit
quality
quality
| BBB | 0.4% |
| BB | 45.8% |
| B | 38.8% |
| CCC | 9.2% |
| CC | 0.5% |
| C | 0.0% |
| D | 0.1% |
| Not Rated | 1.0% |
| Non-Fixed Income | 0.1% |
| Money Market Funds | 4.1% |
Ratings are assigned using Moody’s, Fitch, and Standard & Poor’s and applying a hierarchy: If all 3 agencies rate a security, the middle rating is assigned; if 2 agencies rate a security, the lower rating is assigned. If none of the 3 agencies rate a security, we use DBRS Morningstar. If none of the 4 agencies rate a security, we use Kroll Bond Rating Agency. Ratings are shown in the S&P and Fitch scale (e.g., AAA). All ratings are subject to change.
The fund invests a portion of its assets in the MFS High Yield Pooled Portfolio. Percentages include the indirect exposure to the underlying holdings of the MFS High Yield Pooled Portfolio and not the direct exposure from investing in the MFS High Yield Pooled Portfolio itself.
~ The fund invests a portion of its assets in Exchange-Traded Funds (ETFs) or Options on ETFs to gain fixed income exposure. Percentages include the direct exposure from investing in ETFs or Options on ETFs and not the indirect exposure to the underlying holdings.
Ratings are assigned using Moody’s, Fitch, and Standard & Poor’s and applying a hierarchy: If all 3 agencies rate a security, the middle rating is assigned; if 2 agencies rate a security, the lower rating is assigned. If none of the 3 agencies rate a security, we use DBRS Morningstar. If none of the 4 agencies rate a security, we use Kroll Bond Rating Agency. Ratings are shown in the S&P and Fitch scale (e.g., AAA). All ratings are subject to change.
MATERIAL FUND CHANGES
This is a summary of certain changes to the fund since February 1, 2025. For more complete information, you may review the fund's prospectus as amended, which is available at funds.mfs.com or upon request at 1‑800‑225‑2606.
Effective August 1, 2025, for Class C shares, the investment adviser has agreed in writing to pay a portion of the fund’s total annual operating expenses, excluding interest, taxes, extraordinary expenses, brokerage and transaction costs, certain tax reclaim recovery expenses (including contingency fees and closing agreement expenses), and investment-related expenses (such as fees and expenses associated with investments in investment companies and other similar investment vehicles), such that total operating expenses do not exceed 1.75% annually of the class’s average daily net assets. This written agreement will continue until modified by the fund’s Board of Trustees, but such agreement will continue at least until May 31, 2027.
Effective August 1, 2025, for Class C shares, the investment adviser has agreed in writing to pay a portion of the fund’s total annual operating expenses, excluding interest, taxes, extraordinary expenses, brokerage and transaction costs, certain tax reclaim recovery expenses (including contingency fees and closing agreement expenses), and investment-related expenses (such as fees and expenses associated with investments in investment companies and other similar investment vehicles), such that total operating expenses do not exceed 1.75% annually of the class’s average daily net assets. This written agreement will continue until modified by the fund’s Board of Trustees, but such agreement will continue at least until May 31, 2027.
This is a summary of certain changes to the fund since February 1, 2025. For more complete information, you may review the fund's prospectus as amended, which is available at funds.mfs.com or upon request at 1‑800‑225‑2606.
This report describes certain changes to the Fund that occurred during the reporting period.
FUND EXPENSES
What were the fund costs for the last year?
| (based on a hypothetical $10,000 investment) | ||
| Class Name | Costs of a $10,000 investment ~ | Costs paid as a percentage of a $10,000 investment ~ |
| I | $81 | 0.78% |
˜ Expenses are direct expenses and do not include underlying fund fees and expenses.
MANAGEMENT'S DISCUSSION OF FUND PERFORMANCE
-
For the twelve months ended January 31, 2026, Class I shares of the MFS Global High Yield Fund (fund) provided a total return of 7.93%, at net asset value. This compares with a return of 8.56% for the fund’s benchmark, the Bloomberg Global Aggregate Index. The fund's other benchmark, the ICE BofA Global High Yield - Constrained Index (USD Hedged), generated a return of 7.91%.
-
In addition to investing directly in portfolio securities, the fund also invests indirectly in portfolio securities through investment in the MFS High Yield Pooled Portfolio, a mutual fund also advised by MFS. The discussion below reflects both the fund’s direct and indirect investments.
-
Global equity markets reached record levels during the period, withstanding considerable volatility amid tariffs, geopolitical conflict and high levels of uncertainty. In the US, a pro-growth tax and spending bill was signed into law, while in Europe, renewed focus on defense and infrastructure spending brightened the outlook. In Japan, the election of a pro-growth prime minister sent stocks to new highs. Optimism over artificial intelligence remained quite high.
-
Considerable progress was made in trade talks between the US and many major trading partners, with a fragile truce between the US and China extended through late 2026. US tariffs remained high on goods from countries such as India and Brazil.
-
Moderating inflation pressures allowed many global central banks to ease monetary policy during the period. Amid a difficult policymaking environment and slower job growth, the Federal Reserve resumed easing policy in September and delivered quarter-point rate cuts in October and December.
-
In fixed income markets, global bond yields peaked near the start of the reporting period, then gradually declined, ending the reporting period marginally lower than at the start of the period, while experiencing waves of volatility in between. Both credit spreads and US bond market volatility (as measured by the Merrill Lynch Option Volatility Estimate (MOVE) Index), ended near session lows after rising in April and May due to tariff concerns.
-
Top contributors to performance relative to the ICE BofA Global High Yield - Constrained Index (USD Hedged):
-
Bond selection within the North America, Europe/UK and EM regions, particularly within CCC, BB and B-rated bonds, benefited relative performance. From a sector perspective, favorable bond selection within the basic industry, consumer cyclicals, capital goods, and technology sectors strengthened relative returns.
-
The fund's yield curve positioning also contributed to relative performance.
-
-
Top detractors from performance relative to the ICE BofA Global High Yield - Constrained Index (USD Hedged):
-
The fund's overweight allocation to the capital goods sector held back relative performance.
-
The fund's holding of cash also detracted from relative returns.
-
FUND PERFORMANCE
The fund’s past performance is not a good predictor of the fund’s future performance. The graph and table below do not reflect the deduction of taxes that a shareholder would pay on fund distributions or the redemption of fund shares. The graph and table below assume reinvestment of dividends and capital gain distributions.
Growth of a Hypothetical $10,000 Investment
This graph shows the performance of a hypothetical $10,000 investment in Class I over a ten year period or since inception, if shorter, in comparison to (i) a broad measure of market performance and (ii) an additional index that MFS believes more closely reflects the market segments in which the fund invests.
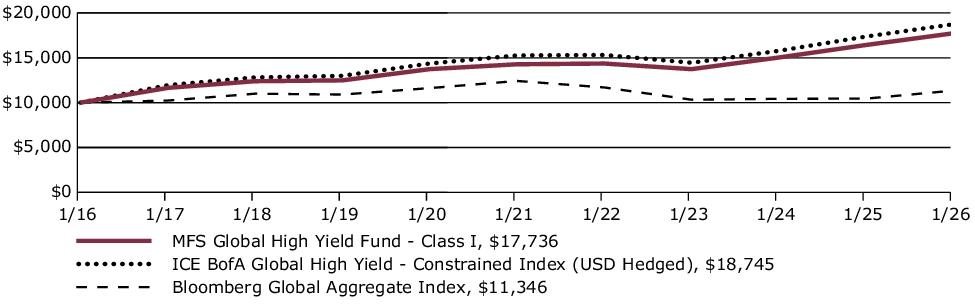
Average Annual Total Returns through 1/31/26
This table shows the average annual total returns of the class of shares noted for the periods shown, both with (if any) and without sales charges. It also shows the average annual total returns of (i) a broad measure of market performance and (ii) an additional index that MFS believes more closely reflects the market segments in which the fund invests, over the same periods.
| Share Class | 1-yr | 5-yr | 10-yr |
| I without sales charge | 7.93% | 4.43% | 5.90% |
| Comparative Benchmark(s) | |||
| Bloomberg Global Aggregate Index ∆ | 8.56% | (1.79)% | 1.27% |
| ICE BofA Global High Yield - Constrained Index (USD Hedged) ∆ | 7.91% | 4.19% | 6.49% |
|
∆
|
Source: FactSet Research Systems Inc.
|
Visit mfs.com/perf/i for more recent performance information.
FUND STATISTICS AS OF 1/31/26
| Net Assets ($): | 206,952,691 | Average Effective Maturity (yrs): | 3.5 | |
| Total Number of Holdings: | 137 | Average Effective Duration (yrs): | 2.8 | |
| Total Management Fee ($)#: | 1,200,687 | |||
| Portfolio Turnover Rate (%): | 38 |
# Includes the effect of any management fee waivers, if applicable.
Where the fund holds derivatives, they are not included in the total number of portfolio holdings.
PORTFOLIO COMPOSITION (BASED ON TOTAL INVESTMENTS AS OF 1/31/26)
Portfolio structure
| Fixed Income ~ | 95.8% |
| Money Market Funds | 4.1% |
| Equities | 0.1% |
Issuer country weightings
| United States | 59.0% |
| Canada | 4.1% |
| United Kingdom | 4.0% |
| France | 3.3% |
| Italy | 2.3% |
| Brazil | 2.0% |
| Mexico | 1.9% |
| Luxembourg | 1.8% |
| India | 1.5% |
| Other Countries | 20.1% |
Composition including fixed income credit
quality
quality
| BBB | 0.4% |
| BB | 45.8% |
| B | 38.8% |
| CCC | 9.2% |
| CC | 0.5% |
| C | 0.0% |
| D | 0.1% |
| Not Rated | 1.0% |
| Non-Fixed Income | 0.1% |
| Money Market Funds | 4.1% |
Ratings are assigned using Moody’s, Fitch, and Standard & Poor’s and applying a hierarchy: If all 3 agencies rate a security, the middle rating is assigned; if 2 agencies rate a security, the lower rating is assigned. If none of the 3 agencies rate a security, we use DBRS Morningstar. If none of the 4 agencies rate a security, we use Kroll Bond Rating Agency. Ratings are shown in the S&P and Fitch scale (e.g., AAA). All ratings are subject to change.
The fund invests a portion of its assets in the MFS High Yield Pooled Portfolio. Percentages include the indirect exposure to the underlying holdings of the MFS High Yield Pooled Portfolio and not the direct exposure from investing in the MFS High Yield Pooled Portfolio itself.
~ The fund invests a portion of its assets in Exchange-Traded Funds (ETFs) or Options on ETFs to gain fixed income exposure. Percentages include the direct exposure from investing in ETFs or Options on ETFs and not the indirect exposure to the underlying holdings.
Ratings are assigned using Moody’s, Fitch, and Standard & Poor’s and applying a hierarchy: If all 3 agencies rate a security, the middle rating is assigned; if 2 agencies rate a security, the lower rating is assigned. If none of the 3 agencies rate a security, we use DBRS Morningstar. If none of the 4 agencies rate a security, we use Kroll Bond Rating Agency. Ratings are shown in the S&P and Fitch scale (e.g., AAA). All ratings are subject to change.
MATERIAL FUND CHANGES
This is a summary of certain changes to the fund since February 1, 2025. For more complete information, you may review the fund's prospectus as amended, which is available at funds.mfs.com or upon request at 1‑800‑225‑2606.
Effective August 1, 2025, for Class I shares, the investment adviser has agreed in writing to pay a portion of the fund’s total annual operating expenses, excluding interest, taxes, extraordinary expenses, brokerage and transaction costs, certain tax reclaim recovery expenses (including contingency fees and closing agreement expenses), and investment-related expenses (such as fees and expenses associated with investments in investment companies and other similar investment vehicles), such that total operating expenses do not exceed 0.75% annually of the class’s average daily net assets. This written agreement will continue until modified by the fund’s Board of Trustees, but such agreement will continue at least until May 31, 2027.
Effective August 1, 2025, for Class I shares, the investment adviser has agreed in writing to pay a portion of the fund’s total annual operating expenses, excluding interest, taxes, extraordinary expenses, brokerage and transaction costs, certain tax reclaim recovery expenses (including contingency fees and closing agreement expenses), and investment-related expenses (such as fees and expenses associated with investments in investment companies and other similar investment vehicles), such that total operating expenses do not exceed 0.75% annually of the class’s average daily net assets. This written agreement will continue until modified by the fund’s Board of Trustees, but such agreement will continue at least until May 31, 2027.
This is a summary of certain changes to the fund since February 1, 2025. For more complete information, you may review the fund's prospectus as amended, which is available at funds.mfs.com or upon request at 1‑800‑225‑2606.
This report describes certain changes to the Fund that occurred during the reporting period.
FUND EXPENSES
What were the fund costs for the last year?
| (based on a hypothetical $10,000 investment) | ||
| Class Name | Costs of a $10,000 investment ~ | Costs paid as a percentage of a $10,000 investment ~ |
| R1 | $184 | 1.78% |
˜ Expenses are direct expenses and do not include underlying fund fees and expenses.
MANAGEMENT'S DISCUSSION OF FUND PERFORMANCE
-
For the twelve months ended January 31, 2026, Class R1 shares of the MFS Global High Yield Fund (fund) provided a total return of 7.05%, at net asset value. This compares with a return of 8.56% for the fund’s benchmark, the Bloomberg Global Aggregate Index. The fund's other benchmark, the ICE BofA Global High Yield - Constrained Index (USD Hedged), generated a return of 7.91%.
-
In addition to investing directly in portfolio securities, the fund also invests indirectly in portfolio securities through investment in the MFS High Yield Pooled Portfolio, a mutual fund also advised by MFS. The discussion below reflects both the fund’s direct and indirect investments.
-
Global equity markets reached record levels during the period, withstanding considerable volatility amid tariffs, geopolitical conflict and high levels of uncertainty. In the US, a pro-growth tax and spending bill was signed into law, while in Europe, renewed focus on defense and infrastructure spending brightened the outlook. In Japan, the election of a pro-growth prime minister sent stocks to new highs. Optimism over artificial intelligence remained quite high.
-
Considerable progress was made in trade talks between the US and many major trading partners, with a fragile truce between the US and China extended through late 2026. US tariffs remained high on goods from countries such as India and Brazil.
-
Moderating inflation pressures allowed many global central banks to ease monetary policy during the period. Amid a difficult policymaking environment and slower job growth, the Federal Reserve resumed easing policy in September and delivered quarter-point rate cuts in October and December.
-
In fixed income markets, global bond yields peaked near the start of the reporting period, then gradually declined, ending the reporting period marginally lower than at the start of the period, while experiencing waves of volatility in between. Both credit spreads and US bond market volatility (as measured by the Merrill Lynch Option Volatility Estimate (MOVE) Index), ended near session lows after rising in April and May due to tariff concerns.
-
Top contributors to performance relative to the ICE BofA Global High Yield - Constrained Index (USD Hedged):
-
Bond selection within the North America, Europe/UK and EM regions, particularly within CCC, BB and B-rated bonds, benefited relative performance. From a sector perspective, favorable bond selection within the basic industry, consumer cyclicals, capital goods, and technology sectors strengthened relative returns.
-
The fund's yield curve positioning also contributed to relative performance.
-
-
Top detractors from performance relative to the ICE BofA Global High Yield - Constrained Index (USD Hedged):
-
The fund's overweight allocation to the capital goods sector held back relative performance.
-
The fund's holding of cash also detracted from relative returns.
-
FUND PERFORMANCE
The fund’s past performance is not a good predictor of the fund’s future performance. The graph and table below do not reflect the deduction of taxes that a shareholder would pay on fund distributions or the redemption of fund shares. The graph and table below assume reinvestment of dividends and capital gain distributions.
Growth of a Hypothetical $10,000 Investment
This graph shows the performance of a hypothetical $10,000 investment in Class R1 over a ten year period or since inception, if shorter, in comparison to (i) a broad measure of market performance and (ii) an additional index that MFS believes more closely reflects the market segments in which the fund invests.
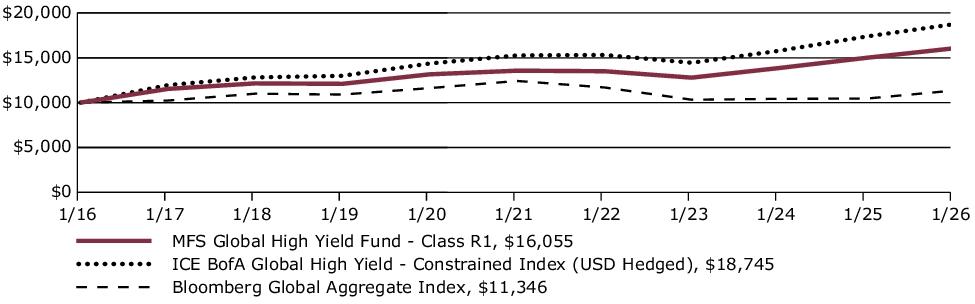
Average Annual Total Returns through 1/31/26
This table shows the average annual total returns of the class of shares noted for the periods shown, both with (if any) and without sales charges. It also shows the average annual total returns of (i) a broad measure of market performance and (ii) an additional index that MFS believes more closely reflects the market segments in which the fund invests, over the same periods.
| Share Class | 1-yr | 5-yr | 10-yr |
| R1 without sales charge | 7.05% | 3.43% | 4.85% |
| Comparative Benchmark(s) | |||
| Bloomberg Global Aggregate Index ∆ | 8.56% | (1.79)% | 1.27% |
| ICE BofA Global High Yield - Constrained Index (USD Hedged) ∆ | 7.91% | 4.19% | 6.49% |
|
∆
|
Source: FactSet Research Systems Inc.
|
Visit mfs.com/perf/r1 for more recent performance information.
FUND STATISTICS AS OF 1/31/26
| Net Assets ($): | 206,952,691 | Average Effective Maturity (yrs): | 3.5 | |
| Total Number of Holdings: | 137 | Average Effective Duration (yrs): | 2.8 | |
| Total Management Fee ($)#: | 1,200,687 | |||
| Portfolio Turnover Rate (%): | 38 |
# Includes the effect of any management fee waivers, if applicable.
Where the fund holds derivatives, they are not included in the total number of portfolio holdings.
PORTFOLIO COMPOSITION (BASED ON TOTAL INVESTMENTS AS OF 1/31/26)
Portfolio structure
| Fixed Income ~ | 95.8% |
| Money Market Funds | 4.1% |
| Equities | 0.1% |
Issuer country weightings
| United States | 59.0% |
| Canada | 4.1% |
| United Kingdom | 4.0% |
| France | 3.3% |
| Italy | 2.3% |
| Brazil | 2.0% |
| Mexico | 1.9% |
| Luxembourg | 1.8% |
| India | 1.5% |
| Other Countries | 20.1% |
Composition including fixed income credit
quality
quality
| BBB | 0.4% |
| BB | 45.8% |
| B | 38.8% |
| CCC | 9.2% |
| CC | 0.5% |
| C | 0.0% |
| D | 0.1% |
| Not Rated | 1.0% |
| Non-Fixed Income | 0.1% |
| Money Market Funds | 4.1% |
Ratings are assigned using Moody’s, Fitch, and Standard & Poor’s and applying a hierarchy: If all 3 agencies rate a security, the middle rating is assigned; if 2 agencies rate a security, the lower rating is assigned. If none of the 3 agencies rate a security, we use DBRS Morningstar. If none of the 4 agencies rate a security, we use Kroll Bond Rating Agency. Ratings are shown in the S&P and Fitch scale (e.g., AAA). All ratings are subject to change.
The fund invests a portion of its assets in the MFS High Yield Pooled Portfolio. Percentages include the indirect exposure to the underlying holdings of the MFS High Yield Pooled Portfolio and not the direct exposure from investing in the MFS High Yield Pooled Portfolio itself.
~ The fund invests a portion of its assets in Exchange-Traded Funds (ETFs) or Options on ETFs to gain fixed income exposure. Percentages include the direct exposure from investing in ETFs or Options on ETFs and not the indirect exposure to the underlying holdings.
Ratings are assigned using Moody’s, Fitch, and Standard & Poor’s and applying a hierarchy: If all 3 agencies rate a security, the middle rating is assigned; if 2 agencies rate a security, the lower rating is assigned. If none of the 3 agencies rate a security, we use DBRS Morningstar. If none of the 4 agencies rate a security, we use Kroll Bond Rating Agency. Ratings are shown in the S&P and Fitch scale (e.g., AAA). All ratings are subject to change.
MATERIAL FUND CHANGES
This is a summary of certain changes to the fund since February 1, 2025. For more complete information, you may review the fund's prospectus as amended, which is available at funds.mfs.com or upon request at 1‑800‑225‑2606.
Effective August 1, 2025, for Class R1 shares, the investment adviser has agreed in writing to pay a portion of the fund’s total annual operating expenses, excluding interest, taxes, extraordinary expenses, brokerage and transaction costs, certain tax reclaim recovery expenses (including contingency fees and closing agreement expenses), and investment-related expenses (such as fees and expenses associated with investments in investment companies and other similar investment vehicles), such that total operating expenses do not exceed 1.75% annually of the class’s average daily net assets. This written agreement will continue until modified by the fund’s Board of Trustees, but such agreement will continue at least until May 31, 2027.
Effective August 1, 2025, for Class R1 shares, the investment adviser has agreed in writing to pay a portion of the fund’s total annual operating expenses, excluding interest, taxes, extraordinary expenses, brokerage and transaction costs, certain tax reclaim recovery expenses (including contingency fees and closing agreement expenses), and investment-related expenses (such as fees and expenses associated with investments in investment companies and other similar investment vehicles), such that total operating expenses do not exceed 1.75% annually of the class’s average daily net assets. This written agreement will continue until modified by the fund’s Board of Trustees, but such agreement will continue at least until May 31, 2027.
This is a summary of certain changes to the fund since February 1, 2025. For more complete information, you may review the fund's prospectus as amended, which is available at funds.mfs.com or upon request at 1‑800‑225‑2606.
This report describes certain changes to the Fund that occurred during the reporting period.
FUND EXPENSES
What were the fund costs for the last year?
| (based on a hypothetical $10,000 investment) | ||
| Class Name | Costs of a $10,000 investment ~ | Costs paid as a percentage of a $10,000 investment ~ |
| R2 | $133 | 1.28% |
˜ Expenses are direct expenses and do not include underlying fund fees and expenses.
MANAGEMENT'S DISCUSSION OF FUND PERFORMANCE
-
For the twelve months ended January 31, 2026, Class R2 shares of the MFS Global High Yield Fund (fund) provided a total return of 7.58%, at net asset value. This compares with a return of 8.56% for the fund’s benchmark, the Bloomberg Global Aggregate Index. The fund's other benchmark, the ICE BofA Global High Yield - Constrained Index (USD Hedged), generated a return of 7.91%.
-
In addition to investing directly in portfolio securities, the fund also invests indirectly in portfolio securities through investment in the MFS High Yield Pooled Portfolio, a mutual fund also advised by MFS. The discussion below reflects both the fund’s direct and indirect investments.
-
Global equity markets reached record levels during the period, withstanding considerable volatility amid tariffs, geopolitical conflict and high levels of uncertainty. In the US, a pro-growth tax and spending bill was signed into law, while in Europe, renewed focus on defense and infrastructure spending brightened the outlook. In Japan, the election of a pro-growth prime minister sent stocks to new highs. Optimism over artificial intelligence remained quite high.
-
Considerable progress was made in trade talks between the US and many major trading partners, with a fragile truce between the US and China extended through late 2026. US tariffs remained high on goods from countries such as India and Brazil.
-
Moderating inflation pressures allowed many global central banks to ease monetary policy during the period. Amid a difficult policymaking environment and slower job growth, the Federal Reserve resumed easing policy in September and delivered quarter-point rate cuts in October and December.
-
In fixed income markets, global bond yields peaked near the start of the reporting period, then gradually declined, ending the reporting period marginally lower than at the start of the period, while experiencing waves of volatility in between. Both credit spreads and US bond market volatility (as measured by the Merrill Lynch Option Volatility Estimate (MOVE) Index), ended near session lows after rising in April and May due to tariff concerns.
-
Top contributors to performance relative to the ICE BofA Global High Yield - Constrained Index (USD Hedged):
-
Bond selection within the North America, Europe/UK and EM regions, particularly within CCC, BB and B-rated bonds, benefited relative performance. From a sector perspective, favorable bond selection within the basic industry, consumer cyclicals, capital goods, and technology sectors strengthened relative returns.
-
The fund's yield curve positioning also contributed to relative performance.
-
-
Top detractors from performance relative to the ICE BofA Global High Yield - Constrained Index (USD Hedged):
-
The fund's overweight allocation to the capital goods sector held back relative performance.
-
The fund's holding of cash also detracted from relative returns.
-
FUND PERFORMANCE
The fund’s past performance is not a good predictor of the fund’s future performance. The graph and table below do not reflect the deduction of taxes that a shareholder would pay on fund distributions or the redemption of fund shares. The graph and table below assume reinvestment of dividends and capital gain distributions.
Growth of a Hypothetical $10,000 Investment
This graph shows the performance of a hypothetical $10,000 investment in Class R2 over a ten year period or since inception, if shorter, in comparison to (i) a broad measure of market performance and (ii) an additional index that MFS believes more closely reflects the market segments in which the fund invests.
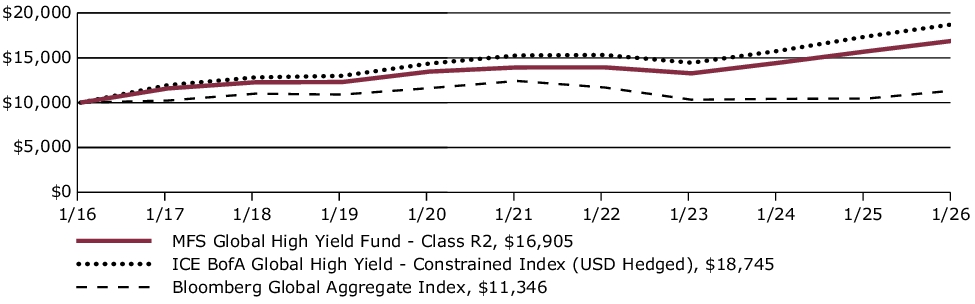
Average Annual Total Returns through 1/31/26
This table shows the average annual total returns of the class of shares noted for the periods shown, both with (if any) and without sales charges. It also shows the average annual total returns of (i) a broad measure of market performance and (ii) an additional index that MFS believes more closely reflects the market segments in which the fund invests, over the same periods.
| Share Class | 1-yr | 5-yr | 10-yr |
| R2 without sales charge | 7.58% | 3.95% | 5.39% |
| Comparative Benchmark(s) | |||
| Bloomberg Global Aggregate Index ∆ | 8.56% | (1.79)% | 1.27% |
| ICE BofA Global High Yield - Constrained Index (USD Hedged) ∆ | 7.91% | 4.19% | 6.49% |
|
∆
|
Source: FactSet Research Systems Inc.
|
Visit mfs.com/perf/r2 for more recent performance information.
FUND STATISTICS AS OF 1/31/26
| Net Assets ($): | 206,952,691 | Average Effective Maturity (yrs): | 3.5 | |
| Total Number of Holdings: | 137 | Average Effective Duration (yrs): | 2.8 | |
| Total Management Fee ($)#: | 1,200,687 | |||
| Portfolio Turnover Rate (%): | 38 |
# Includes the effect of any management fee waivers, if applicable.
Where the fund holds derivatives, they are not included in the total number of portfolio holdings.
PORTFOLIO COMPOSITION (BASED ON TOTAL INVESTMENTS AS OF 1/31/26)
Portfolio structure
| Fixed Income ~ | 95.8% |
| Money Market Funds | 4.1% |
| Equities | 0.1% |
Issuer country weightings
| United States | 59.0% |
| Canada | 4.1% |
| United Kingdom | 4.0% |
| France | 3.3% |
| Italy | 2.3% |
| Brazil | 2.0% |
| Mexico | 1.9% |
| Luxembourg | 1.8% |
| India | 1.5% |
| Other Countries | 20.1% |
Composition including fixed income credit
quality
quality
| BBB | 0.4% |
| BB | 45.8% |
| B | 38.8% |
| CCC | 9.2% |
| CC | 0.5% |
| C | 0.0% |
| D | 0.1% |
| Not Rated | 1.0% |
| Non-Fixed Income | 0.1% |
| Money Market Funds | 4.1% |
Ratings are assigned using Moody’s, Fitch, and Standard & Poor’s and applying a hierarchy: If all 3 agencies rate a security, the middle rating is assigned; if 2 agencies rate a security, the lower rating is assigned. If none of the 3 agencies rate a security, we use DBRS Morningstar. If none of the 4 agencies rate a security, we use Kroll Bond Rating Agency. Ratings are shown in the S&P and Fitch scale (e.g., AAA). All ratings are subject to change.
The fund invests a portion of its assets in the MFS High Yield Pooled Portfolio. Percentages include the indirect exposure to the underlying holdings of the MFS High Yield Pooled Portfolio and not the direct exposure from investing in the MFS High Yield Pooled Portfolio itself.
~ The fund invests a portion of its assets in Exchange-Traded Funds (ETFs) or Options on ETFs to gain fixed income exposure. Percentages include the direct exposure from investing in ETFs or Options on ETFs and not the indirect exposure to the underlying holdings.
Ratings are assigned using Moody’s, Fitch, and Standard & Poor’s and applying a hierarchy: If all 3 agencies rate a security, the middle rating is assigned; if 2 agencies rate a security, the lower rating is assigned. If none of the 3 agencies rate a security, we use DBRS Morningstar. If none of the 4 agencies rate a security, we use Kroll Bond Rating Agency. Ratings are shown in the S&P and Fitch scale (e.g., AAA). All ratings are subject to change.
MATERIAL FUND CHANGES
This is a summary of certain changes to the fund since February 1, 2025. For more complete information, you may review the fund's prospectus as amended, which is available at funds.mfs.com or upon request at 1‑800‑225‑2606.
Effective August 1, 2025, for Class R2 shares, the investment adviser has agreed in writing to pay a portion of the fund’s total annual operating expenses, excluding interest, taxes, extraordinary expenses, brokerage and transaction costs, certain tax reclaim recovery expenses (including contingency fees and closing agreement expenses), and investment-related expenses (such as fees and expenses associated with investments in investment companies and other similar investment vehicles), such that total operating expenses do not exceed 1.25% annually of the class’s average daily net assets. This written agreement will continue until modified by the fund’s Board of Trustees, but such agreement will continue at least until May 31, 2027.
Effective August 1, 2025, for Class R2 shares, the investment adviser has agreed in writing to pay a portion of the fund’s total annual operating expenses, excluding interest, taxes, extraordinary expenses, brokerage and transaction costs, certain tax reclaim recovery expenses (including contingency fees and closing agreement expenses), and investment-related expenses (such as fees and expenses associated with investments in investment companies and other similar investment vehicles), such that total operating expenses do not exceed 1.25% annually of the class’s average daily net assets. This written agreement will continue until modified by the fund’s Board of Trustees, but such agreement will continue at least until May 31, 2027.
This is a summary of certain changes to the fund since February 1, 2025. For more complete information, you may review the fund's prospectus as amended, which is available at funds.mfs.com or upon request at 1‑800‑225‑2606.
This report describes certain changes to the Fund that occurred during the reporting period.
FUND EXPENSES
What were the fund costs for the last year?
| (based on a hypothetical $10,000 investment) | ||
| Class Name | Costs of a $10,000 investment ~ | Costs paid as a percentage of a $10,000 investment ~ |
| R3 | $107 | 1.03% |
˜ Expenses are direct expenses and do not include underlying fund fees and expenses.
MANAGEMENT'S DISCUSSION OF FUND PERFORMANCE
-
For the twelve months ended January 31, 2026, Class R3 shares of the MFS Global High Yield Fund (fund) provided a total return of 7.84%, at net asset value. This compares with a return of 8.56% for the fund’s benchmark, the Bloomberg Global Aggregate Index. The fund's other benchmark, the ICE BofA Global High Yield - Constrained Index (USD Hedged), generated a return of 7.91%.
-
In addition to investing directly in portfolio securities, the fund also invests indirectly in portfolio securities through investment in the MFS High Yield Pooled Portfolio, a mutual fund also advised by MFS. The discussion below reflects both the fund’s direct and indirect investments.
-
Global equity markets reached record levels during the period, withstanding considerable volatility amid tariffs, geopolitical conflict and high levels of uncertainty. In the US, a pro-growth tax and spending bill was signed into law, while in Europe, renewed focus on defense and infrastructure spending brightened the outlook. In Japan, the election of a pro-growth prime minister sent stocks to new highs. Optimism over artificial intelligence remained quite high.
-
Considerable progress was made in trade talks between the US and many major trading partners, with a fragile truce between the US and China extended through late 2026. US tariffs remained high on goods from countries such as India and Brazil.
-
Moderating inflation pressures allowed many global central banks to ease monetary policy during the period. Amid a difficult policymaking environment and slower job growth, the Federal Reserve resumed easing policy in September and delivered quarter-point rate cuts in October and December.
-
In fixed income markets, global bond yields peaked near the start of the reporting period, then gradually declined, ending the reporting period marginally lower than at the start of the period, while experiencing waves of volatility in between. Both credit spreads and US bond market volatility (as measured by the Merrill Lynch Option Volatility Estimate (MOVE) Index), ended near session lows after rising in April and May due to tariff concerns.
-
Top contributors to performance relative to the ICE BofA Global High Yield - Constrained Index (USD Hedged):
-
Bond selection within the North America, Europe/UK and EM regions, particularly within CCC, BB and B-rated bonds, benefited relative performance. From a sector perspective, favorable bond selection within the basic industry, consumer cyclicals, capital goods, and technology sectors strengthened relative returns.
-
The fund's yield curve positioning also contributed to relative performance.
-
-
Top detractors from performance relative to the ICE BofA Global High Yield - Constrained Index (USD Hedged):
-
The fund's overweight allocation to the capital goods sector held back relative performance.
-
The fund's holding of cash also detracted from relative returns.
-
FUND PERFORMANCE
The fund’s past performance is not a good predictor of the fund’s future performance. The graph and table below do not reflect the deduction of taxes that a shareholder would pay on fund distributions or the redemption of fund shares. The graph and table below assume reinvestment of dividends and capital gain distributions.
Growth of a Hypothetical $10,000 Investment
This graph shows the performance of a hypothetical $10,000 investment in Class R3 over a ten year period or since inception, if shorter, in comparison to (i) a broad measure of market performance and (ii) an additional index that MFS believes more closely reflects the market segments in which the fund invests.

Average Annual Total Returns through 1/31/26
This table shows the average annual total returns of the class of shares noted for the periods shown, both with (if any) and without sales charges. It also shows the average annual total returns of (i) a broad measure of market performance and (ii) an additional index that MFS believes more closely reflects the market segments in which the fund invests, over the same periods.
| Share Class | 1-yr | 5-yr | 10-yr |
| R3 without sales charge | 7.84% | 4.18% | 5.71% |
| Comparative Benchmark(s) | |||
| Bloomberg Global Aggregate Index ∆ | 8.56% | (1.79)% | 1.27% |
| ICE BofA Global High Yield - Constrained Index (USD Hedged) ∆ | 7.91% | 4.19% | 6.49% |
|
∆
|
Source: FactSet Research Systems Inc.
|
Visit mfs.com/perf/r3 for more recent performance information.
FUND STATISTICS AS OF 1/31/26
| Net Assets ($): | 206,952,691 | Average Effective Maturity (yrs): | 3.5 | |
| Total Number of Holdings: | 137 | Average Effective Duration (yrs): | 2.8 | |
| Total Management Fee ($)#: | 1,200,687 | |||
| Portfolio Turnover Rate (%): | 38 |
# Includes the effect of any management fee waivers, if applicable.
Where the fund holds derivatives, they are not included in the total number of portfolio holdings.
PORTFOLIO COMPOSITION (BASED ON TOTAL INVESTMENTS AS OF 1/31/26)
Portfolio structure
| Fixed Income ~ | 95.8% |
| Money Market Funds | 4.1% |
| Equities | 0.1% |
Issuer country weightings
| United States | 59.0% |
| Canada | 4.1% |
| United Kingdom | 4.0% |
| France | 3.3% |
| Italy | 2.3% |
| Brazil | 2.0% |
| Mexico | 1.9% |
| Luxembourg | 1.8% |
| India | 1.5% |
| Other Countries | 20.1% |
Composition including fixed income credit
quality
quality
| BBB | 0.4% |
| BB | 45.8% |
| B | 38.8% |
| CCC | 9.2% |
| CC | 0.5% |
| C | 0.0% |
| D | 0.1% |
| Not Rated | 1.0% |
| Non-Fixed Income | 0.1% |
| Money Market Funds | 4.1% |
Ratings are assigned using Moody’s, Fitch, and Standard & Poor’s and applying a hierarchy: If all 3 agencies rate a security, the middle rating is assigned; if 2 agencies rate a security, the lower rating is assigned. If none of the 3 agencies rate a security, we use DBRS Morningstar. If none of the 4 agencies rate a security, we use Kroll Bond Rating Agency. Ratings are shown in the S&P and Fitch scale (e.g., AAA). All ratings are subject to change.
The fund invests a portion of its assets in the MFS High Yield Pooled Portfolio. Percentages include the indirect exposure to the underlying holdings of the MFS High Yield Pooled Portfolio and not the direct exposure from investing in the MFS High Yield Pooled Portfolio itself.
~ The fund invests a portion of its assets in Exchange-Traded Funds (ETFs) or Options on ETFs to gain fixed income exposure. Percentages include the direct exposure from investing in ETFs or Options on ETFs and not the indirect exposure to the underlying holdings.
Ratings are assigned using Moody’s, Fitch, and Standard & Poor’s and applying a hierarchy: If all 3 agencies rate a security, the middle rating is assigned; if 2 agencies rate a security, the lower rating is assigned. If none of the 3 agencies rate a security, we use DBRS Morningstar. If none of the 4 agencies rate a security, we use Kroll Bond Rating Agency. Ratings are shown in the S&P and Fitch scale (e.g., AAA). All ratings are subject to change.
MATERIAL FUND CHANGES
This is a summary of certain changes to the fund since February 1, 2025. For more complete information, you may review the fund's prospectus as amended, which is available at funds.mfs.com or upon request at 1‑800‑225‑2606.
Effective August 1, 2025, for Class R3 shares, the investment adviser has agreed in writing to pay a portion of the fund’s total annual operating expenses, excluding interest, taxes, extraordinary expenses, brokerage and transaction costs, certain tax reclaim recovery expenses (including contingency fees and closing agreement expenses), and investment-related expenses (such as fees and expenses associated with investments in investment companies and other similar investment vehicles), such that total operating expenses do not exceed 1.00% annually of the class’s average daily net assets. This written agreement will continue until modified by the fund’s Board of Trustees, but such agreement will continue at least until May 31, 2027.
Effective August 1, 2025, for Class R3 shares, the investment adviser has agreed in writing to pay a portion of the fund’s total annual operating expenses, excluding interest, taxes, extraordinary expenses, brokerage and transaction costs, certain tax reclaim recovery expenses (including contingency fees and closing agreement expenses), and investment-related expenses (such as fees and expenses associated with investments in investment companies and other similar investment vehicles), such that total operating expenses do not exceed 1.00% annually of the class’s average daily net assets. This written agreement will continue until modified by the fund’s Board of Trustees, but such agreement will continue at least until May 31, 2027.
This is a summary of certain changes to the fund since February 1, 2025. For more complete information, you may review the fund's prospectus as amended, which is available at funds.mfs.com or upon request at 1‑800‑225‑2606.
This report describes certain changes to the Fund that occurred during the reporting period.
FUND EXPENSES
What were the fund costs for the last year?
| (based on a hypothetical $10,000 investment) | ||
| Class Name | Costs of a $10,000 investment ~ | Costs paid as a percentage of a $10,000 investment ~ |
| R4 | $81 | 0.78% |
˜ Expenses are direct expenses and do not include underlying fund fees and expenses.
MANAGEMENT'S DISCUSSION OF FUND PERFORMANCE
-
For the twelve months ended January 31, 2026, Class R4 shares of the MFS Global High Yield Fund (fund) provided a total return of 8.11%, at net asset value. This compares with a return of 8.56% for the fund’s benchmark, the Bloomberg Global Aggregate Index. The fund's other benchmark, the ICE BofA Global High Yield - Constrained Index (USD Hedged), generated a return of 7.91%.
-
In addition to investing directly in portfolio securities, the fund also invests indirectly in portfolio securities through investment in the MFS High Yield Pooled Portfolio, a mutual fund also advised by MFS. The discussion below reflects both the fund’s direct and indirect investments.
-
Global equity markets reached record levels during the period, withstanding considerable volatility amid tariffs, geopolitical conflict and high levels of uncertainty. In the US, a pro-growth tax and spending bill was signed into law, while in Europe, renewed focus on defense and infrastructure spending brightened the outlook. In Japan, the election of a pro-growth prime minister sent stocks to new highs. Optimism over artificial intelligence remained quite high.
-
Considerable progress was made in trade talks between the US and many major trading partners, with a fragile truce between the US and China extended through late 2026. US tariffs remained high on goods from countries such as India and Brazil.
-
Moderating inflation pressures allowed many global central banks to ease monetary policy during the period. Amid a difficult policymaking environment and slower job growth, the Federal Reserve resumed easing policy in September and delivered quarter-point rate cuts in October and December.
-
In fixed income markets, global bond yields peaked near the start of the reporting period, then gradually declined, ending the reporting period marginally lower than at the start of the period, while experiencing waves of volatility in between. Both credit spreads and US bond market volatility (as measured by the Merrill Lynch Option Volatility Estimate (MOVE) Index), ended near session lows after rising in April and May due to tariff concerns.
-
Top contributors to performance relative to the ICE BofA Global High Yield - Constrained Index (USD Hedged):
-
Bond selection within the North America, Europe/UK and EM regions, particularly within CCC, BB and B-rated bonds, benefited relative performance. From a sector perspective, favorable bond selection within the basic industry, consumer cyclicals, capital goods, and technology sectors strengthened relative returns.
-
The fund's yield curve positioning also contributed to relative performance.
-
-
Top detractors from performance relative to the ICE BofA Global High Yield - Constrained Index (USD Hedged):
-
The fund's overweight allocation to the capital goods sector held back relative performance.
-
The fund's holding of cash also detracted from relative returns.
-
FUND PERFORMANCE
The fund’s past performance is not a good predictor of the fund’s future performance. The graph and table below do not reflect the deduction of taxes that a shareholder would pay on fund distributions or the redemption of fund shares. The graph and table below assume reinvestment of dividends and capital gain distributions.
Growth of a Hypothetical $10,000 Investment
This graph shows the performance of a hypothetical $10,000 investment in Class R4 over a ten year period or since inception, if shorter, in comparison to (i) a broad measure of market performance and (ii) an additional index that MFS believes more closely reflects the market segments in which the fund invests.

Average Annual Total Returns through 1/31/26
This table shows the average annual total returns of the class of shares noted for the periods shown, both with (if any) and without sales charges. It also shows the average annual total returns of (i) a broad measure of market performance and (ii) an additional index that MFS believes more closely reflects the market segments in which the fund invests, over the same periods.
| Share Class | 1-yr | 5-yr | 10-yr |
| R4 without sales charge | 8.11% | 4.48% | 5.91% |
| Comparative Benchmark(s) | |||
| Bloomberg Global Aggregate Index ∆ | 8.56% | (1.79)% | 1.27% |
| ICE BofA Global High Yield - Constrained Index (USD Hedged) ∆ | 7.91% | 4.19% | 6.49% |
|
∆
|
Source: FactSet Research Systems Inc.
|
Visit mfs.com/perf/r4 for more recent performance information.
FUND STATISTICS AS OF 1/31/26
| Net Assets ($): | 206,952,691 | Average Effective Maturity (yrs): | 3.5 | |
| Total Number of Holdings: | 137 | Average Effective Duration (yrs): | 2.8 | |
| Total Management Fee ($)#: | 1,200,687 | |||
| Portfolio Turnover Rate (%): | 38 |
# Includes the effect of any management fee waivers, if applicable.
Where the fund holds derivatives, they are not included in the total number of portfolio holdings.
PORTFOLIO COMPOSITION (BASED ON TOTAL INVESTMENTS AS OF 1/31/26)
Portfolio structure
| Fixed Income ~ | 95.8% |
| Money Market Funds | 4.1% |
| Equities | 0.1% |
Issuer country weightings
| United States | 59.0% |
| Canada | 4.1% |
| United Kingdom | 4.0% |
| France | 3.3% |
| Italy | 2.3% |
| Brazil | 2.0% |
| Mexico | 1.9% |
| Luxembourg | 1.8% |
| India | 1.5% |
| Other Countries | 20.1% |
Composition including fixed income credit
quality
quality
| BBB | 0.4% |
| BB | 45.8% |
| B | 38.8% |
| CCC | 9.2% |
| CC | 0.5% |
| C | 0.0% |
| D | 0.1% |
| Not Rated | 1.0% |
| Non-Fixed Income | 0.1% |
| Money Market Funds | 4.1% |
Ratings are assigned using Moody’s, Fitch, and Standard & Poor’s and applying a hierarchy: If all 3 agencies rate a security, the middle rating is assigned; if 2 agencies rate a security, the lower rating is assigned. If none of the 3 agencies rate a security, we use DBRS Morningstar. If none of the 4 agencies rate a security, we use Kroll Bond Rating Agency. Ratings are shown in the S&P and Fitch scale (e.g., AAA). All ratings are subject to change.
The fund invests a portion of its assets in the MFS High Yield Pooled Portfolio. Percentages include the indirect exposure to the underlying holdings of the MFS High Yield Pooled Portfolio and not the direct exposure from investing in the MFS High Yield Pooled Portfolio itself.
~ The fund invests a portion of its assets in Exchange-Traded Funds (ETFs) or Options on ETFs to gain fixed income exposure. Percentages include the direct exposure from investing in ETFs or Options on ETFs and not the indirect exposure to the underlying holdings.
Ratings are assigned using Moody’s, Fitch, and Standard & Poor’s and applying a hierarchy: If all 3 agencies rate a security, the middle rating is assigned; if 2 agencies rate a security, the lower rating is assigned. If none of the 3 agencies rate a security, we use DBRS Morningstar. If none of the 4 agencies rate a security, we use Kroll Bond Rating Agency. Ratings are shown in the S&P and Fitch scale (e.g., AAA). All ratings are subject to change.
MATERIAL FUND CHANGES
This is a summary of certain changes to the fund since February 1, 2025. For more complete information, you may review the fund's prospectus as amended, which is available at funds.mfs.com or upon request at 1‑800‑225‑2606.
Effective August 1, 2025, for Class R4 shares, the investment adviser has agreed in writing to pay a portion of the fund’s total annual operating expenses, excluding interest, taxes, extraordinary expenses, brokerage and transaction costs, certain tax reclaim recovery expenses (including contingency fees and closing agreement expenses), and investment-related expenses (such as fees and expenses associated with investments in investment companies and other similar investment vehicles), such that total operating expenses do not exceed 0.75% annually of the class’s average daily net assets. This written agreement will continue until modified by the fund’s Board of Trustees, but such agreement will continue at least until May 31, 2027.
Effective August 1, 2025, for Class R4 shares, the investment adviser has agreed in writing to pay a portion of the fund’s total annual operating expenses, excluding interest, taxes, extraordinary expenses, brokerage and transaction costs, certain tax reclaim recovery expenses (including contingency fees and closing agreement expenses), and investment-related expenses (such as fees and expenses associated with investments in investment companies and other similar investment vehicles), such that total operating expenses do not exceed 0.75% annually of the class’s average daily net assets. This written agreement will continue until modified by the fund’s Board of Trustees, but such agreement will continue at least until May 31, 2027.
This is a summary of certain changes to the fund since February 1, 2025. For more complete information, you may review the fund's prospectus as amended, which is available at funds.mfs.com or upon request at 1‑800‑225‑2606.
This report describes certain changes to the Fund that occurred during the reporting period.
FUND EXPENSES
What were the fund costs for the last year?
| (based on a hypothetical $10,000 investment) | ||
| Class Name | Costs of a $10,000 investment ~ | Costs paid as a percentage of a $10,000 investment ~ |
| R6 | $71 | 0.68% |
˜ Expenses are direct expenses and do not include underlying fund fees and expenses.
MANAGEMENT'S DISCUSSION OF FUND PERFORMANCE
-
For the twelve months ended January 31, 2026, Class R6 shares of the MFS Global High Yield Fund (fund) provided a total return of 8.23%, at net asset value. This compares with a return of 8.56% for the fund’s benchmark, the Bloomberg Global Aggregate Index. The fund's other benchmark, the ICE BofA Global High Yield - Constrained Index (USD Hedged), generated a return of 7.91%.
-
In addition to investing directly in portfolio securities, the fund also invests indirectly in portfolio securities through investment in the MFS High Yield Pooled Portfolio, a mutual fund also advised by MFS. The discussion below reflects both the fund’s direct and indirect investments.
-
Global equity markets reached record levels during the period, withstanding considerable volatility amid tariffs, geopolitical conflict and high levels of uncertainty. In the US, a pro-growth tax and spending bill was signed into law, while in Europe, renewed focus on defense and infrastructure spending brightened the outlook. In Japan, the election of a pro-growth prime minister sent stocks to new highs. Optimism over artificial intelligence remained quite high.
-
Considerable progress was made in trade talks between the US and many major trading partners, with a fragile truce between the US and China extended through late 2026. US tariffs remained high on goods from countries such as India and Brazil.
-
Moderating inflation pressures allowed many global central banks to ease monetary policy during the period. Amid a difficult policymaking environment and slower job growth, the Federal Reserve resumed easing policy in September and delivered quarter-point rate cuts in October and December.
-
In fixed income markets, global bond yields peaked near the start of the reporting period, then gradually declined, ending the reporting period marginally lower than at the start of the period, while experiencing waves of volatility in between. Both credit spreads and US bond market volatility (as measured by the Merrill Lynch Option Volatility Estimate (MOVE) Index), ended near session lows after rising in April and May due to tariff concerns.
-
Top contributors to performance relative to the ICE BofA Global High Yield - Constrained Index (USD Hedged):
-
Bond selection within the North America, Europe/UK and EM regions, particularly within CCC, BB and B-rated bonds, benefited relative performance. From a sector perspective, favorable bond selection within the basic industry, consumer cyclicals, capital goods, and technology sectors strengthened relative returns.
-
The fund's yield curve positioning also contributed to relative performance.
-
-
Top detractors from performance relative to the ICE BofA Global High Yield - Constrained Index (USD Hedged):
-
The fund's overweight allocation to the capital goods sector held back relative performance.
-
The fund's holding of cash also detracted from relative returns.
-
FUND PERFORMANCE
The fund’s past performance is not a good predictor of the fund’s future performance. The graph and table below do not reflect the deduction of taxes that a shareholder would pay on fund distributions or the redemption of fund shares. The graph and table below assume reinvestment of dividends and capital gain distributions.
Growth of a Hypothetical $10,000 Investment
This graph shows the performance of a hypothetical $10,000 investment in Class R6 over a ten year period or since inception, if shorter, in comparison to (i) a broad measure of market performance and (ii) an additional index that MFS believes more closely reflects the market segments in which the fund invests.
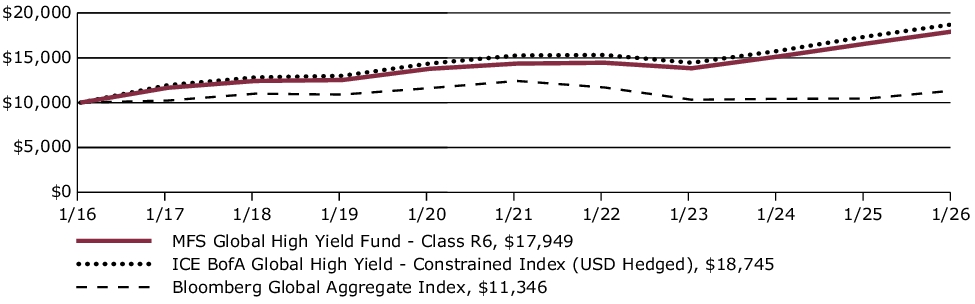
Average Annual Total Returns through 1/31/26
This table shows the average annual total returns of the class of shares noted for the periods shown, both with (if any) and without sales charges. It also shows the average annual total returns of (i) a broad measure of market performance and (ii) an additional index that MFS believes more closely reflects the market segments in which the fund invests, over the same periods.
| Share Class | 1-yr | 5-yr | 10-yr |
| R6 without sales charge | 8.23% | 4.57% | 6.02% |
| Comparative Benchmark(s) | |||
| Bloomberg Global Aggregate Index ∆ | 8.56% | (1.79)% | 1.27% |
| ICE BofA Global High Yield - Constrained Index (USD Hedged) ∆ | 7.91% | 4.19% | 6.49% |
|
∆
|
Source: FactSet Research Systems Inc.
|
Visit mfs.com/perf/r6 for more recent performance information.
FUND STATISTICS AS OF 1/31/26
| Net Assets ($): | 206,952,691 | Average Effective Maturity (yrs): | 3.5 | |
| Total Number of Holdings: | 137 | Average Effective Duration (yrs): | 2.8 | |
| Total Management Fee ($)#: | 1,200,687 | |||
| Portfolio Turnover Rate (%): | 38 |
# Includes the effect of any management fee waivers, if applicable.
Where the fund holds derivatives, they are not included in the total number of portfolio holdings.
PORTFOLIO COMPOSITION (BASED ON TOTAL INVESTMENTS AS OF 1/31/26)
Portfolio structure
| Fixed Income ~ | 95.8% |
| Money Market Funds | 4.1% |
| Equities | 0.1% |
Issuer country weightings
| United States | 59.0% |
| Canada | 4.1% |
| United Kingdom | 4.0% |
| France | 3.3% |
| Italy | 2.3% |
| Brazil | 2.0% |
| Mexico | 1.9% |
| Luxembourg | 1.8% |
| India | 1.5% |
| Other Countries | 20.1% |
Composition including fixed income credit
quality
quality
| BBB | 0.4% |
| BB | 45.8% |
| B | 38.8% |
| CCC | 9.2% |
| CC | 0.5% |
| C | 0.0% |
| D | 0.1% |
| Not Rated | 1.0% |
| Non-Fixed Income | 0.1% |
| Money Market Funds | 4.1% |
Ratings are assigned using Moody’s, Fitch, and Standard & Poor’s and applying a hierarchy: If all 3 agencies rate a security, the middle rating is assigned; if 2 agencies rate a security, the lower rating is assigned. If none of the 3 agencies rate a security, we use DBRS Morningstar. If none of the 4 agencies rate a security, we use Kroll Bond Rating Agency. Ratings are shown in the S&P and Fitch scale (e.g., AAA). All ratings are subject to change.
The fund invests a portion of its assets in the MFS High Yield Pooled Portfolio. Percentages include the indirect exposure to the underlying holdings of the MFS High Yield Pooled Portfolio and not the direct exposure from investing in the MFS High Yield Pooled Portfolio itself.
~ The fund invests a portion of its assets in Exchange-Traded Funds (ETFs) or Options on ETFs to gain fixed income exposure. Percentages include the direct exposure from investing in ETFs or Options on ETFs and not the indirect exposure to the underlying holdings.
Ratings are assigned using Moody’s, Fitch, and Standard & Poor’s and applying a hierarchy: If all 3 agencies rate a security, the middle rating is assigned; if 2 agencies rate a security, the lower rating is assigned. If none of the 3 agencies rate a security, we use DBRS Morningstar. If none of the 4 agencies rate a security, we use Kroll Bond Rating Agency. Ratings are shown in the S&P and Fitch scale (e.g., AAA). All ratings are subject to change.
MATERIAL FUND CHANGES
This is a summary of certain changes to the fund since February 1, 2025. For more complete information, you may review the fund's prospectus as amended, which is available at funds.mfs.com or upon request at 1‑800‑225‑2606.
Effective August 1, 2025, for Class R6 shares, the investment adviser has agreed in writing to pay a portion of the fund’s total annual operating expenses, excluding interest, taxes, extraordinary expenses, brokerage and transaction costs, certain tax reclaim recovery expenses (including contingency fees and closing agreement expenses), and investment-related expenses (such as fees and expenses associated with investments in investment companies and other similar investment vehicles), such that total operating expenses do not exceed 0.67% annually of the class’s average daily net assets. This written agreement will continue until modified by the fund’s Board of Trustees, but such agreement will continue at least until May 31, 2027.
Effective August 1, 2025, for Class R6 shares, the investment adviser has agreed in writing to pay a portion of the fund’s total annual operating expenses, excluding interest, taxes, extraordinary expenses, brokerage and transaction costs, certain tax reclaim recovery expenses (including contingency fees and closing agreement expenses), and investment-related expenses (such as fees and expenses associated with investments in investment companies and other similar investment vehicles), such that total operating expenses do not exceed 0.67% annually of the class’s average daily net assets. This written agreement will continue until modified by the fund’s Board of Trustees, but such agreement will continue at least until May 31, 2027.
This is a summary of certain changes to the fund since February 1, 2025. For more complete information, you may review the fund's prospectus as amended, which is available at funds.mfs.com or upon request at 1‑800‑225‑2606.
FUND EXPENSES
What were the fund costs for the last year?
| (based on a hypothetical $10,000 investment) | ||
| Class Name | Costs of a $10,000 investment | Costs paid as a percentage of a $10,000 investment |
| R6 | $58 | 0.57% |
MANAGEMENT'S DISCUSSION OF FUND PERFORMANCE
-
For the twelve months ended January 31, 2026, Class R6 shares of the MFS Municipal High Income Fund (fund) provided a total return of 3.86%, at net asset value. This compares with a return of 4.70% for the fund’s benchmark, the Bloomberg Municipal Bond Index.
-
Global equity markets reached record levels during the period, withstanding considerable volatility amid tariffs, geopolitical conflict and high levels of uncertainty. In the US, a pro-growth tax and spending bill was signed into law, while in Europe, renewed focus on defense and infrastructure spending brightened the outlook. In Japan, the election of a pro-growth prime minister sent stocks to new highs. Optimism over artificial intelligence remained quite high.
-
Considerable progress was made in trade talks between the US and many major trading partners, with a fragile truce between the US and China extended through late 2026. US tariffs remained high on goods from countries such as India and Brazil.
-
Moderating inflation pressures allowed many global central banks to ease monetary policy during the period. Amid a difficult policymaking environment and slower job growth, the Federal Reserve resumed easing policy in September and delivered quarter-point rate cuts in October and December..
-
In fixed income markets, global bond yields peaked near the start of the reporting period, then gradually declined, ending the reporting period marginally lower than at the start of the period, while experiencing waves of volatility in between. Both credit spreads and US bond market volatility (as measured by the Merrill Lynch Option Volatility Estimate (MOVE) Index), ended near session lows after rising in April and May due to tariff concerns.
-
The municipal bond market produced positive returns over the trailing year, particularly benefiting from positive performance over the second half of the period. Following a spike in April 2025, bond yield volatility generally trended lower, and the resumption of Fed rate cuts bolstered the outlook for fixed income assets, including municipals. The investment grade and high yield municipal markets delivered 4.7% and 2.7% returns, respectively, over the period. Bonds with maturities in the seven to 15-year range performed best while the longest maturity bonds lagged as the municipal yield curve steepened during the year. The yields (yield-to-worst) of the investment grade index and the high yield index ended the period at 3.45% and 5.52%, respectively, well above the five-year averages of 3.07% and 5.09%, respectively, a positive for income-oriented investors.
-
Top contributors to performance relative to the Bloomberg Municipal Bond Index:
-
The fund's longer duration stance benefited relative performance as interest rates generally declined during the reporting period.
-
-
Top detractors from performance relative to the Bloomberg Municipal Bond Index:
-
Yield curve positioning detracted from relative performance.
-
The fund's greater exposure to both the education and industrial revenue sectors held back relative returns. Security selection within AA and A-rated bonds further weakened relative results.
-
FUND PERFORMANCE
The fund’s past performance is not a good predictor of the fund’s future performance. The graph and table below do not reflect the deduction of taxes that a shareholder would pay on fund distributions or the redemption of fund shares. The graph and table below assume reinvestment of dividends and capital gain distributions.
Growth of a Hypothetical $10,000 Investment*
This graph shows the performance of a hypothetical $10,000 investment in Class R6 over a ten year period or since inception, if shorter, in comparison to a broad measure of market performance.
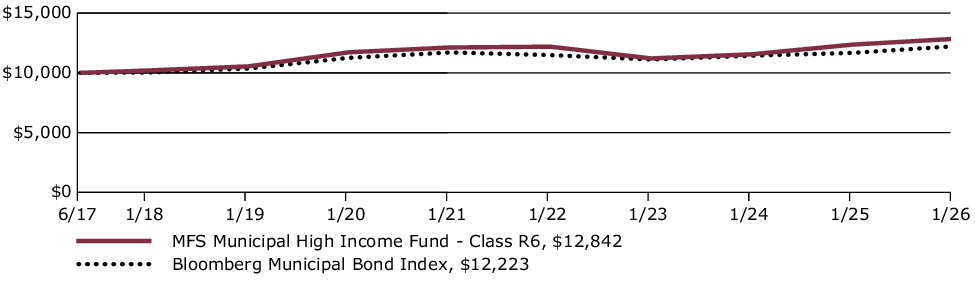
Average Annual Total Returns through 1/31/26
This table shows the average annual total returns of the class of shares noted for the periods shown, both with (if any) and without sales charges. It also shows the average annual total returns of a broad measure of market performance over the same periods.
| Share Class | 1-yr | 5-yr | Life* |
| R6 without sales charge | 3.86% | 1.16% | 2.93% |
| Comparative Benchmark(s) | |||
| Bloomberg Municipal Bond Index ∆ | 4.70% | 0.86% | 2.34% |
|
*
|
For the period from the commencement of the class's investment operations, June 2, 2017 through January 31, 2026.
|
|
∆
|
Source: FactSet Research Systems Inc.
|
Visit mfs.com/perf/r6 for more recent performance information.
FUND STATISTICS AS OF 1/31/26
| Net Assets ($): | 5,330,889,257 | Average Effective Maturity (yrs): | 20.5 | |
| Total Number of Holdings: | 2,013 | Average Effective Duration (yrs): | 8.5 | |
| Total Management Fee ($)#: | 25,434,682 | |||
| Portfolio Turnover Rate (%): | 9 |
# Includes the effect of any management fee waivers, if applicable.
Where the fund holds derivatives, they are not included in the total number of portfolio holdings.
PORTFOLIO COMPOSITION (BASED ON TOTAL INVESTMENTS AS OF 1/31/26)
Portfolio structure
| Fixed Income | 97.5% |
| Money Market Funds | 2.5% |
| Equities | 0.0% |
Composition including fixed income credit
quality
quality
| AAA | 0.9% |
| AA | 12.0% |
| A | 14.0% |
| BBB | 19.1% |
| BB | 12.5% |
| B | 2.5% |
| CCC | 1.4% |
| CC | 1.0% |
| Not Rated | 34.1% |
| Non-Fixed Income | 0.0% |
| Money Market Funds | 2.5% |
Industries
| Healthcare Revenue - Long Term Care | 15.6% |
| Healthcare Revenue - Hospitals | 12.3% |
| Secondary Schools | 8.2% |
| Miscellaneous Revenue - Other | 7.1% |
| Multi-Family Housing Revenue | 6.8% |
| Airport Revenue | 6.6% |
| Universities - Colleges | 3.9% |
| Universities - Dormitories | 3.8% |
| Sales & Excise Tax Revenue | 3.6% |
| Tax - Other | 3.2% |
| Other Industries | 26.4% |
Ratings are assigned using Moody’s, Fitch, and Standard & Poor’s and applying a hierarchy: If all 3 agencies rate a security, the middle rating is assigned; if 2 agencies rate a security, the lower rating is assigned. If none of the 3 agencies rate a security, we use DBRS Morningstar. If none of the 4 agencies rate a security, we use Kroll Bond Rating Agency. Ratings are shown in the S&P and Fitch scale (e.g., AAA). All ratings are subject to change.
For purposes of these classifications, MFS uses its own internal sector/industry classification methodology, which may deviate from classification methodologies used by other industry participants (e.g., the Global Industry Classification Standard).
Ratings are assigned using Moody’s, Fitch, and Standard & Poor’s and applying a hierarchy: If all 3 agencies rate a security, the middle rating is assigned; if 2 agencies rate a security, the lower rating is assigned. If none of the 3 agencies rate a security, we use DBRS Morningstar. If none of the 4 agencies rate a security, we use Kroll Bond Rating Agency. Ratings are shown in the S&P and Fitch scale (e.g., AAA). All ratings are subject to change.
FUND EXPENSES
What were the fund costs for the last year?
| (based on a hypothetical $10,000 investment) | ||
| Class Name | Costs of a $10,000 investment | Costs paid as a percentage of a $10,000 investment |
| I | $67 | 0.66% |
MANAGEMENT'S DISCUSSION OF FUND PERFORMANCE
-
For the twelve months ended January 31, 2026, Class I shares of the MFS Municipal High Income Fund (fund) provided a total return of 3.64%, at net asset value. This compares with a return of 4.70% for the fund’s benchmark, the Bloomberg Municipal Bond Index.
-
Global equity markets reached record levels during the period, withstanding considerable volatility amid tariffs, geopolitical conflict and high levels of uncertainty. In the US, a pro-growth tax and spending bill was signed into law, while in Europe, renewed focus on defense and infrastructure spending brightened the outlook. In Japan, the election of a pro-growth prime minister sent stocks to new highs. Optimism over artificial intelligence remained quite high.
-
Considerable progress was made in trade talks between the US and many major trading partners, with a fragile truce between the US and China extended through late 2026. US tariffs remained high on goods from countries such as India and Brazil.
-
Moderating inflation pressures allowed many global central banks to ease monetary policy during the period. Amid a difficult policymaking environment and slower job growth, the Federal Reserve resumed easing policy in September and delivered quarter-point rate cuts in October and December..
-
In fixed income markets, global bond yields peaked near the start of the reporting period, then gradually declined, ending the reporting period marginally lower than at the start of the period, while experiencing waves of volatility in between. Both credit spreads and US bond market volatility (as measured by the Merrill Lynch Option Volatility Estimate (MOVE) Index), ended near session lows after rising in April and May due to tariff concerns.
-
The municipal bond market produced positive returns over the trailing year, particularly benefiting from positive performance over the second half of the period. Following a spike in April 2025, bond yield volatility generally trended lower, and the resumption of Fed rate cuts bolstered the outlook for fixed income assets, including municipals. The investment grade and high yield municipal markets delivered 4.7% and 2.7% returns, respectively, over the period. Bonds with maturities in the seven to 15-year range performed best while the longest maturity bonds lagged as the municipal yield curve steepened during the year. The yields (yield-to-worst) of the investment grade index and the high yield index ended the period at 3.45% and 5.52%, respectively, well above the five-year averages of 3.07% and 5.09%, respectively, a positive for income-oriented investors.
-
Top contributors to performance relative to the Bloomberg Municipal Bond Index:
-
The fund's longer duration stance benefited relative performance as interest rates generally declined during the reporting period.
-
-
Top detractors from performance relative to the Bloomberg Municipal Bond Index:
-
Yield curve positioning detracted from relative performance.
-
The fund's greater exposure to both the education and industrial revenue sectors held back relative returns. Security selection within AA and A-rated bonds further weakened relative results.
-
FUND PERFORMANCE
The fund’s past performance is not a good predictor of the fund’s future performance. The graph and table below do not reflect the deduction of taxes that a shareholder would pay on fund distributions or the redemption of fund shares. The graph and table below assume reinvestment of dividends and capital gain distributions.
Growth of a Hypothetical $10,000 Investment
This graph shows the performance of a hypothetical $10,000 investment in Class I over a ten year period or since inception, if shorter, in comparison to a broad measure of market performance.
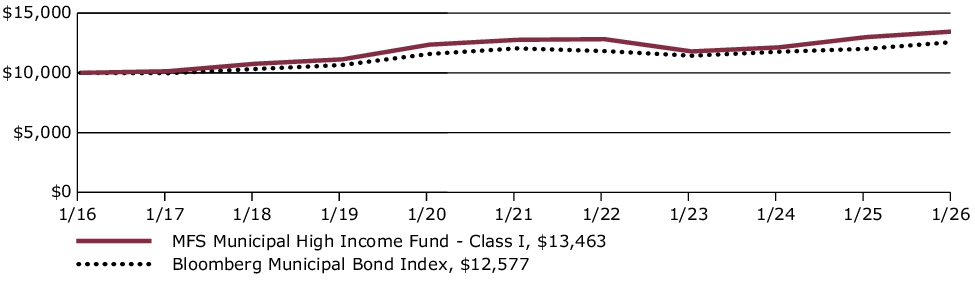
Average Annual Total Returns through 1/31/26
This table shows the average annual total returns of the class of shares noted for the periods shown, both with (if any) and without sales charges. It also shows the average annual total returns of a broad measure of market performance over the same periods.
| Share Class | 1-yr | 5-yr | 10-yr |
| I without sales charge | 3.64% | 1.08% | 3.02% |
| Comparative Benchmark(s) | |||
| Bloomberg Municipal Bond Index ∆ | 4.70% | 0.86% | 2.32% |
|
∆
|
Source: FactSet Research Systems Inc.
|
Visit mfs.com/perf/i for more recent performance information.
FUND STATISTICS AS OF 1/31/26
| Net Assets ($): | 5,330,889,257 | Average Effective Maturity (yrs): | 20.5 | |
| Total Number of Holdings: | 2,013 | Average Effective Duration (yrs): | 8.5 | |
| Total Management Fee ($)#: | 25,434,682 | |||
| Portfolio Turnover Rate (%): | 9 |
# Includes the effect of any management fee waivers, if applicable.
Where the fund holds derivatives, they are not included in the total number of portfolio holdings.
PORTFOLIO COMPOSITION (BASED ON TOTAL INVESTMENTS AS OF 1/31/26)
Portfolio structure
| Fixed Income | 97.5% |
| Money Market Funds | 2.5% |
| Equities | 0.0% |
Composition including fixed income credit
quality
quality
| AAA | 0.9% |
| AA | 12.0% |
| A | 14.0% |
| BBB | 19.1% |
| BB | 12.5% |
| B | 2.5% |
| CCC | 1.4% |
| CC | 1.0% |
| Not Rated | 34.1% |
| Non-Fixed Income | 0.0% |
| Money Market Funds | 2.5% |
Industries
| Healthcare Revenue - Long Term Care | 15.6% |
| Healthcare Revenue - Hospitals | 12.3% |
| Secondary Schools | 8.2% |
| Miscellaneous Revenue - Other | 7.1% |
| Multi-Family Housing Revenue | 6.8% |
| Airport Revenue | 6.6% |
| Universities - Colleges | 3.9% |
| Universities - Dormitories | 3.8% |
| Sales & Excise Tax Revenue | 3.6% |
| Tax - Other | 3.2% |
| Other Industries | 26.4% |
Ratings are assigned using Moody’s, Fitch, and Standard & Poor’s and applying a hierarchy: If all 3 agencies rate a security, the middle rating is assigned; if 2 agencies rate a security, the lower rating is assigned. If none of the 3 agencies rate a security, we use DBRS Morningstar. If none of the 4 agencies rate a security, we use Kroll Bond Rating Agency. Ratings are shown in the S&P and Fitch scale (e.g., AAA). All ratings are subject to change.
For purposes of these classifications, MFS uses its own internal sector/industry classification methodology, which may deviate from classification methodologies used by other industry participants (e.g., the Global Industry Classification Standard).
Ratings are assigned using Moody’s, Fitch, and Standard & Poor’s and applying a hierarchy: If all 3 agencies rate a security, the middle rating is assigned; if 2 agencies rate a security, the lower rating is assigned. If none of the 3 agencies rate a security, we use DBRS Morningstar. If none of the 4 agencies rate a security, we use Kroll Bond Rating Agency. Ratings are shown in the S&P and Fitch scale (e.g., AAA). All ratings are subject to change.
FUND EXPENSES
What were the fund costs for the last year?
| (based on a hypothetical $10,000 investment) | ||
| Class Name | Costs of a $10,000 investment | Costs paid as a percentage of a $10,000 investment |
| C | $168 | 1.66% |
MANAGEMENT'S DISCUSSION OF FUND PERFORMANCE
-
For the twelve months ended January 31, 2026, Class C shares of the MFS Municipal High Income Fund (fund) provided a total return of 2.77%, at net asset value. This compares with a return of 4.70% for the fund’s benchmark, the Bloomberg Municipal Bond Index.
-
Global equity markets reached record levels during the period, withstanding considerable volatility amid tariffs, geopolitical conflict and high levels of uncertainty. In the US, a pro-growth tax and spending bill was signed into law, while in Europe, renewed focus on defense and infrastructure spending brightened the outlook. In Japan, the election of a pro-growth prime minister sent stocks to new highs. Optimism over artificial intelligence remained quite high.
-
Considerable progress was made in trade talks between the US and many major trading partners, with a fragile truce between the US and China extended through late 2026. US tariffs remained high on goods from countries such as India and Brazil.
-
Moderating inflation pressures allowed many global central banks to ease monetary policy during the period. Amid a difficult policymaking environment and slower job growth, the Federal Reserve resumed easing policy in September and delivered quarter-point rate cuts in October and December..
-
In fixed income markets, global bond yields peaked near the start of the reporting period, then gradually declined, ending the reporting period marginally lower than at the start of the period, while experiencing waves of volatility in between. Both credit spreads and US bond market volatility (as measured by the Merrill Lynch Option Volatility Estimate (MOVE) Index), ended near session lows after rising in April and May due to tariff concerns.
-
The municipal bond market produced positive returns over the trailing year, particularly benefiting from positive performance over the second half of the period. Following a spike in April 2025, bond yield volatility generally trended lower, and the resumption of Fed rate cuts bolstered the outlook for fixed income assets, including municipals. The investment grade and high yield municipal markets delivered 4.7% and 2.7% returns, respectively, over the period. Bonds with maturities in the seven to 15-year range performed best while the longest maturity bonds lagged as the municipal yield curve steepened during the year. The yields (yield-to-worst) of the investment grade index and the high yield index ended the period at 3.45% and 5.52%, respectively, well above the five-year averages of 3.07% and 5.09%, respectively, a positive for income-oriented investors.
-
Top contributors to performance relative to the Bloomberg Municipal Bond Index:
-
The fund's longer duration stance benefited relative performance as interest rates generally declined during the reporting period.
-
-
Top detractors from performance relative to the Bloomberg Municipal Bond Index:
-
Yield curve positioning detracted from relative performance.
-
The fund's greater exposure to both the education and industrial revenue sectors held back relative returns. Security selection within AA and A-rated bonds further weakened relative results.
-
FUND PERFORMANCE
The fund’s past performance is not a good predictor of the fund’s future performance. The graph and table below do not reflect the deduction of taxes that a shareholder would pay on fund distributions or the redemption of fund shares. The graph and table below assume reinvestment of dividends and capital gain distributions.
Growth of a Hypothetical $10,000 Investment
This graph shows the performance of a hypothetical $10,000 investment in Class C over a ten year period or since inception, if shorter, in comparison to a broad measure of market performance.
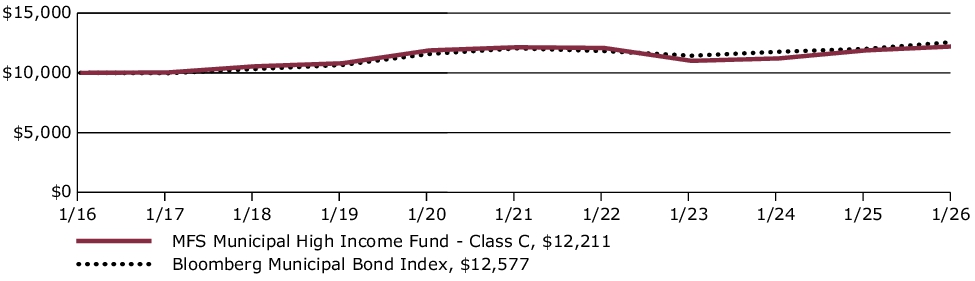
Average Annual Total Returns through 1/31/26
This table shows the average annual total returns of the class of shares noted for the periods shown, both with (if any) and without sales charges. It also shows the average annual total returns of a broad measure of market performance over the same periods.
| Share Class | 1-yr | 5-yr | 10-yr |
| C without sales charge | 2.77% | 0.11% | 2.02% |
| C with CDSC (1% for 12 months)× | 1.77% | 0.11% | 2.02% |
| Comparative Benchmark(s) | |||
| Bloomberg Municipal Bond Index ∆ | 4.70% | 0.86% | 2.32% |
|
∆
|
Source: FactSet Research Systems Inc.
|
|
×
|
Assuming redemption at the end of the applicable period.
|
Visit mfs.com/perf/c for more recent performance information.
FUND STATISTICS AS OF 1/31/26
| Net Assets ($): | 5,330,889,257 | Average Effective Maturity (yrs): | 20.5 | |
| Total Number of Holdings: | 2,013 | Average Effective Duration (yrs): | 8.5 | |
| Total Management Fee ($)#: | 25,434,682 | |||
| Portfolio Turnover Rate (%): | 9 |
# Includes the effect of any management fee waivers, if applicable.
Where the fund holds derivatives, they are not included in the total number of portfolio holdings.
PORTFOLIO COMPOSITION (BASED ON TOTAL INVESTMENTS AS OF 1/31/26)
Portfolio structure
| Fixed Income | 97.5% |
| Money Market Funds | 2.5% |
| Equities | 0.0% |
Composition including fixed income credit
quality
quality
| AAA | 0.9% |
| AA | 12.0% |
| A | 14.0% |
| BBB | 19.1% |
| BB | 12.5% |
| B | 2.5% |
| CCC | 1.4% |
| CC | 1.0% |
| Not Rated | 34.1% |
| Non-Fixed Income | 0.0% |
| Money Market Funds | 2.5% |
Industries
| Healthcare Revenue - Long Term Care | 15.6% |
| Healthcare Revenue - Hospitals | 12.3% |
| Secondary Schools | 8.2% |
| Miscellaneous Revenue - Other | 7.1% |
| Multi-Family Housing Revenue | 6.8% |
| Airport Revenue | 6.6% |
| Universities - Colleges | 3.9% |
| Universities - Dormitories | 3.8% |
| Sales & Excise Tax Revenue | 3.6% |
| Tax - Other | 3.2% |
| Other Industries | 26.4% |
Ratings are assigned using Moody’s, Fitch, and Standard & Poor’s and applying a hierarchy: If all 3 agencies rate a security, the middle rating is assigned; if 2 agencies rate a security, the lower rating is assigned. If none of the 3 agencies rate a security, we use DBRS Morningstar. If none of the 4 agencies rate a security, we use Kroll Bond Rating Agency. Ratings are shown in the S&P and Fitch scale (e.g., AAA). All ratings are subject to change.
For purposes of these classifications, MFS uses its own internal sector/industry classification methodology, which may deviate from classification methodologies used by other industry participants (e.g., the Global Industry Classification Standard).
Ratings are assigned using Moody’s, Fitch, and Standard & Poor’s and applying a hierarchy: If all 3 agencies rate a security, the middle rating is assigned; if 2 agencies rate a security, the lower rating is assigned. If none of the 3 agencies rate a security, we use DBRS Morningstar. If none of the 4 agencies rate a security, we use Kroll Bond Rating Agency. Ratings are shown in the S&P and Fitch scale (e.g., AAA). All ratings are subject to change.
FUND EXPENSES
What were the fund costs for the last year?
| (based on a hypothetical $10,000 investment) | ||
| Class Name | Costs of a $10,000 investment | Costs paid as a percentage of a $10,000 investment |
| B | $143 | 1.41% |
MANAGEMENT'S DISCUSSION OF FUND PERFORMANCE
-
For the twelve months ended January 31, 2026, Class B shares of the MFS Municipal High Income Fund (fund) provided a total return of 3.03%, at net asset value. This compares with a return of 4.70% for the fund’s benchmark, the Bloomberg Municipal Bond Index.
-
Global equity markets reached record levels during the period, withstanding considerable volatility amid tariffs, geopolitical conflict and high levels of uncertainty. In the US, a pro-growth tax and spending bill was signed into law, while in Europe, renewed focus on defense and infrastructure spending brightened the outlook. In Japan, the election of a pro-growth prime minister sent stocks to new highs. Optimism over artificial intelligence remained quite high.
-
Considerable progress was made in trade talks between the US and many major trading partners, with a fragile truce between the US and China extended through late 2026. US tariffs remained high on goods from countries such as India and Brazil.
-
Moderating inflation pressures allowed many global central banks to ease monetary policy during the period. Amid a difficult policymaking environment and slower job growth, the Federal Reserve resumed easing policy in September and delivered quarter-point rate cuts in October and December..
-
In fixed income markets, global bond yields peaked near the start of the reporting period, then gradually declined, ending the reporting period marginally lower than at the start of the period, while experiencing waves of volatility in between. Both credit spreads and US bond market volatility (as measured by the Merrill Lynch Option Volatility Estimate (MOVE) Index), ended near session lows after rising in April and May due to tariff concerns.
-
The municipal bond market produced positive returns over the trailing year, particularly benefiting from positive performance over the second half of the period. Following a spike in April 2025, bond yield volatility generally trended lower, and the resumption of Fed rate cuts bolstered the outlook for fixed income assets, including municipals. The investment grade and high yield municipal markets delivered 4.7% and 2.7% returns, respectively, over the period. Bonds with maturities in the seven to 15-year range performed best while the longest maturity bonds lagged as the municipal yield curve steepened during the year. The yields (yield-to-worst) of the investment grade index and the high yield index ended the period at 3.45% and 5.52%, respectively, well above the five-year averages of 3.07% and 5.09%, respectively, a positive for income-oriented investors.
-
Top contributors to performance relative to the Bloomberg Municipal Bond Index:
-
The fund's longer duration stance benefited relative performance as interest rates generally declined during the reporting period.
-
-
Top detractors from performance relative to the Bloomberg Municipal Bond Index:
-
Yield curve positioning detracted from relative performance.
-
The fund's greater exposure to both the education and industrial revenue sectors held back relative returns. Security selection within AA and A-rated bonds further weakened relative results.
-
FUND PERFORMANCE
The fund’s past performance is not a good predictor of the fund’s future performance. The graph and table below do not reflect the deduction of taxes that a shareholder would pay on fund distributions or the redemption of fund shares. The graph and table below assume reinvestment of dividends and capital gain distributions.
Growth of a Hypothetical $10,000 Investment
This graph shows the performance of a hypothetical $10,000 investment in Class B over a ten year period or since inception, if shorter, in comparison to a broad measure of market performance.
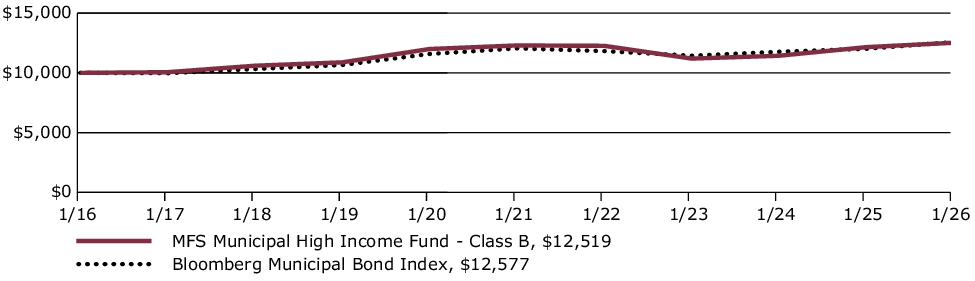
Average Annual Total Returns through 1/31/26
This table shows the average annual total returns of the class of shares noted for the periods shown, both with (if any) and without sales charges. It also shows the average annual total returns of a broad measure of market performance over the same periods.
| Share Class | 1-yr | 5-yr | 10-yr |
| B without sales charge | 3.03% | 0.36% | 2.27% |
| B with CDSC (declining over six years from 4% to 0%)× | (0.95)% | 0.02% | 2.27% |
| Comparative Benchmark(s) | |||
| Bloomberg Municipal Bond Index ∆ | 4.70% | 0.86% | 2.32% |
|
∆
|
Source: FactSet Research Systems Inc.
|
|
×
|
Assuming redemption at the end of the applicable period.
|
Visit mfs.com/perf/b for more recent performance information.
FUND STATISTICS AS OF 1/31/26
| Net Assets ($): | 5,330,889,257 | Average Effective Maturity (yrs): | 20.5 | |
| Total Number of Holdings: | 2,013 | Average Effective Duration (yrs): | 8.5 | |
| Total Management Fee ($)#: | 25,434,682 | |||
| Portfolio Turnover Rate (%): | 9 |
# Includes the effect of any management fee waivers, if applicable.
Where the fund holds derivatives, they are not included in the total number of portfolio holdings.
PORTFOLIO COMPOSITION (BASED ON TOTAL INVESTMENTS AS OF 1/31/26)
Portfolio structure
| Fixed Income | 97.5% |
| Money Market Funds | 2.5% |
| Equities | 0.0% |
Composition including fixed income credit
quality
quality
| AAA | 0.9% |
| AA | 12.0% |
| A | 14.0% |
| BBB | 19.1% |
| BB | 12.5% |
| B | 2.5% |
| CCC | 1.4% |
| CC | 1.0% |
| Not Rated | 34.1% |
| Non-Fixed Income | 0.0% |
| Money Market Funds | 2.5% |
Industries
| Healthcare Revenue - Long Term Care | 15.6% |
| Healthcare Revenue - Hospitals | 12.3% |
| Secondary Schools | 8.2% |
| Miscellaneous Revenue - Other | 7.1% |
| Multi-Family Housing Revenue | 6.8% |
| Airport Revenue | 6.6% |
| Universities - Colleges | 3.9% |
| Universities - Dormitories | 3.8% |
| Sales & Excise Tax Revenue | 3.6% |
| Tax - Other | 3.2% |
| Other Industries | 26.4% |
Ratings are assigned using Moody’s, Fitch, and Standard & Poor’s and applying a hierarchy: If all 3 agencies rate a security, the middle rating is assigned; if 2 agencies rate a security, the lower rating is assigned. If none of the 3 agencies rate a security, we use DBRS Morningstar. If none of the 4 agencies rate a security, we use Kroll Bond Rating Agency. Ratings are shown in the S&P and Fitch scale (e.g., AAA). All ratings are subject to change.
For purposes of these classifications, MFS uses its own internal sector/industry classification methodology, which may deviate from classification methodologies used by other industry participants (e.g., the Global Industry Classification Standard).
Ratings are assigned using Moody’s, Fitch, and Standard & Poor’s and applying a hierarchy: If all 3 agencies rate a security, the middle rating is assigned; if 2 agencies rate a security, the lower rating is assigned. If none of the 3 agencies rate a security, we use DBRS Morningstar. If none of the 4 agencies rate a security, we use Kroll Bond Rating Agency. Ratings are shown in the S&P and Fitch scale (e.g., AAA). All ratings are subject to change.
FUND EXPENSES
What were the fund costs for the last year?
| (based on a hypothetical $10,000 investment) | ||
| Class Name | Costs of a $10,000 investment | Costs paid as a percentage of a $10,000 investment |
| A | $67 | 0.66% |
MANAGEMENT'S DISCUSSION OF FUND PERFORMANCE
-
For the twelve months ended January 31, 2026, Class A shares of the MFS Municipal High Income Fund (fund) provided a total return of 3.79%, at net asset value. This compares with a return of 4.70% for the fund’s benchmark, the Bloomberg Municipal Bond Index.
-
Global equity markets reached record levels during the period, withstanding considerable volatility amid tariffs, geopolitical conflict and high levels of uncertainty. In the US, a pro-growth tax and spending bill was signed into law, while in Europe, renewed focus on defense and infrastructure spending brightened the outlook. In Japan, the election of a pro-growth prime minister sent stocks to new highs. Optimism over artificial intelligence remained quite high.
-
Considerable progress was made in trade talks between the US and many major trading partners, with a fragile truce between the US and China extended through late 2026. US tariffs remained high on goods from countries such as India and Brazil.
-
Moderating inflation pressures allowed many global central banks to ease monetary policy during the period. Amid a difficult policymaking environment and slower job growth, the Federal Reserve resumed easing policy in September and delivered quarter-point rate cuts in October and December..
-
In fixed income markets, global bond yields peaked near the start of the reporting period, then gradually declined, ending the reporting period marginally lower than at the start of the period, while experiencing waves of volatility in between. Both credit spreads and US bond market volatility (as measured by the Merrill Lynch Option Volatility Estimate (MOVE) Index), ended near session lows after rising in April and May due to tariff concerns.
-
The municipal bond market produced positive returns over the trailing year, particularly benefiting from positive performance over the second half of the period. Following a spike in April 2025, bond yield volatility generally trended lower, and the resumption of Fed rate cuts bolstered the outlook for fixed income assets, including municipals. The investment grade and high yield municipal markets delivered 4.7% and 2.7% returns, respectively, over the period. Bonds with maturities in the seven to 15-year range performed best while the longest maturity bonds lagged as the municipal yield curve steepened during the year. The yields (yield-to-worst) of the investment grade index and the high yield index ended the period at 3.45% and 5.52%, respectively, well above the five-year averages of 3.07% and 5.09%, respectively, a positive for income-oriented investors.
-
Top contributors to performance relative to the Bloomberg Municipal Bond Index:
-
The fund's longer duration stance benefited relative performance as interest rates generally declined during the reporting period.
-
-
Top detractors from performance relative to the Bloomberg Municipal Bond Index:
-
Yield curve positioning detracted from relative performance.
-
The fund's greater exposure to both the education and industrial revenue sectors held back relative returns. Security selection within AA and A-rated bonds further weakened relative results.
-
FUND PERFORMANCE
The fund’s past performance is not a good predictor of the fund’s future performance. The graph and table below do not reflect the deduction of taxes that a shareholder would pay on fund distributions or the redemption of fund shares. The graph and table below assume reinvestment of dividends and capital gain distributions.
Growth of a Hypothetical $10,000 Investment
This graph shows the performance of a hypothetical $10,000 investment in Class A over a ten year period or since inception, if shorter, in comparison to a broad measure of market performance. This graph includes the deduction of the maximum applicable sales charge.
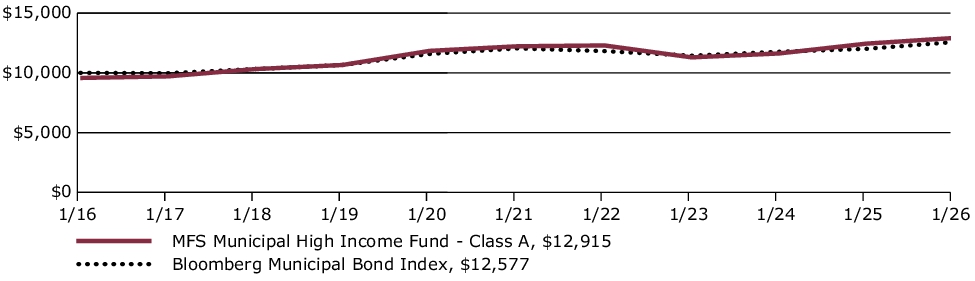
Average Annual Total Returns through 1/31/26
This table shows the average annual total returns of the class of shares noted for the periods shown, both with (if any) and without sales charges. It also shows the average annual total returns of a broad measure of market performance over the same periods.
| Share Class | 1-yr | 5-yr | 10-yr |
| A without sales charge | 3.79% | 1.11% | 3.04% |
| A with initial sales charge (4.25%) | (0.62)% | 0.23% | 2.59% |
| Comparative Benchmark(s) | |||
| Bloomberg Municipal Bond Index ∆ | 4.70% | 0.86% | 2.32% |
|
∆
|
Source: FactSet Research Systems Inc.
|
Visit mfs.com/perf/a for more recent performance information.
FUND STATISTICS AS OF 1/31/26
| Net Assets ($): | 5,330,889,257 | Average Effective Maturity (yrs): | 20.5 | |
| Total Number of Holdings: | 2,013 | Average Effective Duration (yrs): | 8.5 | |
| Total Management Fee ($)#: | 25,434,682 | |||
| Portfolio Turnover Rate (%): | 9 |
# Includes the effect of any management fee waivers, if applicable.
Where the fund holds derivatives, they are not included in the total number of portfolio holdings.
PORTFOLIO COMPOSITION (BASED ON TOTAL INVESTMENTS AS OF 1/31/26)
Portfolio structure
| Fixed Income | 97.5% |
| Money Market Funds | 2.5% |
| Equities | 0.0% |
Composition including fixed income credit
quality
| AAA | 0.9% |
| AA | 12.0% |
| A | 14.0% |
| BBB | 19.1% |
| BB | 12.5% |
| B | 2.5% |
| CCC | 1.4% |
| CC | 1.0% |
| Not Rated | 34.1% |
| Non-Fixed Income | 0.0% |
| Money Market Funds | 2.5% |
Industries
| Healthcare Revenue - Long Term Care | 15.6% |
| Healthcare Revenue - Hospitals | 12.3% |
| Secondary Schools | 8.2% |
| Miscellaneous Revenue - Other | 7.1% |
| Multi-Family Housing Revenue | 6.8% |
| Airport Revenue | 6.6% |
| Universities - Colleges | 3.9% |
| Universities - Dormitories | 3.8% |
| Sales & Excise Tax Revenue | 3.6% |
| Tax - Other | 3.2% |
| Other Industries | 26.4% |
Ratings are assigned using Moody’s, Fitch, and Standard & Poor’s and applying a hierarchy: If all 3 agencies rate a security, the middle rating is assigned; if 2 agencies rate a security, the lower rating is assigned. If none of the 3 agencies rate a security, we use DBRS Morningstar. If none of the 4 agencies rate a security, we use Kroll Bond Rating Agency. Ratings are shown in the S&P and Fitch scale (e.g., AAA). All ratings are subject to change.
For purposes of these classifications, MFS uses its own internal sector/industry classification methodology, which may deviate from classification methodologies used by other industry participants (e.g., the Global Industry Classification Standard).
Ratings are assigned using Moody’s, Fitch, and Standard & Poor’s and applying a hierarchy: If all 3 agencies rate a security, the middle rating is assigned; if 2 agencies rate a security, the lower rating is assigned. If none of the 3 agencies rate a security, we use DBRS Morningstar. If none of the 4 agencies rate a security, we use Kroll Bond Rating Agency. Ratings are shown in the S&P and Fitch scale (e.g., AAA). All ratings are subject to change.
FUND EXPENSES
What were the fund costs for the last year?
| (based on a hypothetical $10,000 investment) | ||
| Fund Name | Costs of a $10,000 investment | Costs paid as a percentage of a $10,000 investment |
| MFS High Yield Pooled Portfolio | $3 | 0.03% |
MANAGEMENT'S DISCUSSION OF FUND PERFORMANCE
-
For the twelve months ended January 31, 2026, shares of the MFS High Yield Pooled Portfolio (fund) provided a total return of 8.64%, at net asset value. This compares with a return of 6.85% for the fund’s benchmark, the Bloomberg U.S. Aggregate Bond Index. The fund's other benchmark, the Bloomberg U.S. Corporate High-Yield 2% Issuer Capped Index, generated a return of 7.70%.
-
Global equity markets reached record levels during the period, withstanding considerable volatility amid tariffs, geopolitical conflict and high levels of uncertainty. In the US, a pro-growth tax and spending bill was signed into law, while in Europe, renewed focus on defense and infrastructure spending brightened the outlook. In Japan, the election of a pro-growth prime minister sent stocks to new highs. Optimism over artificial intelligence remained quite high.
-
Considerable progress was made in trade talks between the US and many major trading partners, with a fragile truce between the US and China extended through late 2026. US tariffs remained high on goods from countries such as India and Brazil.
-
Moderating inflation pressures allowed many global central banks to ease monetary policy during the period. Amid a difficult policymaking environment and slower job growth, the Federal Reserve resumed easing policy in September and delivered quarter-point rate cuts in October and December.
-
In fixed income markets, global bond yields peaked near the start of the reporting period, then gradually declined, ending the reporting period marginally lower than at the start of the period, while experiencing waves of volatility in between. Both credit spreads and US bond market volatility (as measured by the Merrill Lynch Option Volatility Estimate (MOVE) Index), ended near session lows after rising in April and May due to tariff concerns.
-
Top contributors to performance relative to the Bloomberg U.S. Corporate High-Yield 2% Issuer Capped Index:
-
From a quality perspective, security selection in CCC-rated bonds, particularly within the consumer cyclical, capital goods, and technology sectors, strengthened relative returns. Favorable security selection in BB-rated bonds also helped, most notably within the basic industry, consumer cyclicals, finance companies, and energy sectors.
-
-
Top detractors from performance relative to the Bloomberg U.S. Corporate High-Yield 2% Issuer Capped Index:
-
Security selection within the communications sector held back relative performance.
-
During the reporting period, the fund’s cash position weakened relative performance.
-
FUND PERFORMANCE
The fund’s past performance is not a good predictor of the fund’s future performance. The graph and table below do not reflect the deduction of taxes that a shareholder would pay on fund distributions or the redemption of fund shares. The graph and table below assume reinvestment of dividends and capital gain distributions.
Growth of a Hypothetical $10,000 Investment
This graph shows the performance of a hypothetical $10,000 investment in the fund over a ten year period or since inception, if shorter, in comparison to (i) a broad measure of market performance and (ii) an additional index that MFS believes more closely reflects the market segments in which the fund invests.
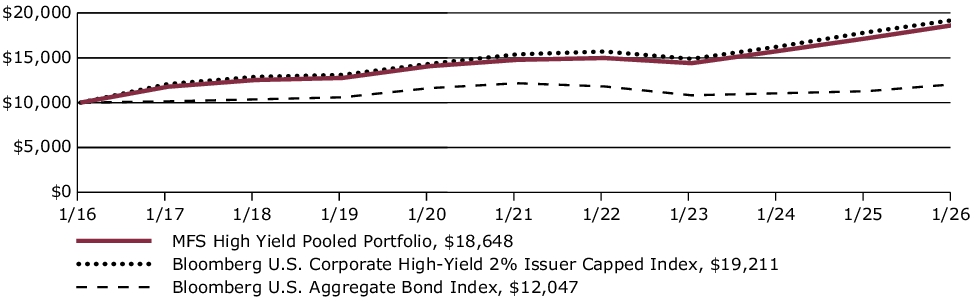
Average Annual Total Returns through 1/31/26
This table shows the average annual total returns of the fund for the periods shown. It also shows the average annual total returns of (i) a broad measure of market performance and (ii) an additional index that MFS believes more closely reflects the market segments in which the fund invests, over the same periods.
| Fund Name | 1-yr | 5-yr | 10-yr |
| MFS High Yield Pooled Portfolio | 8.64% | 4.77% | 6.43% |
| Comparative Benchmark(s) | |||
| Bloomberg U.S. Aggregate Bond Index ∆ | 6.85% | (0.20)% | 1.88% |
| Bloomberg U.S. Corporate High-Yield 2% Issuer Capped Index ∆ | 7.70% | 4.54% | 6.75% |
|
∆
|
Source: FactSet Research Systems Inc.
|
FUND STATISTICS AS OF 1/31/26
| Net Assets ($): | 553,158,062 | Average Effective Maturity (yrs): | 3.4 | |
| Total Number of Holdings: | 364 | Average Effective Duration (yrs): | 2.8 | |
| Total Management Fee ($)#: | 0 | |||
| Portfolio Turnover Rate (%): | 50 |
# The fund does not pay a management fee.
Where the fund holds derivatives, they are not included in the total number of portfolio holdings.
PORTFOLIO COMPOSITION (BASED ON TOTAL INVESTMENTS AS OF 1/31/26)
Portfolio structure
| Fixed Income ~ | 97.6% |
| Money Market Funds | 2.3% |
| Equities | 0.1% |
Composition including fixed income credit
quality
quality
| BBB | 0.4% |
| BB | 45.0% |
| B | 39.0% |
| CCC | 11.4% |
| CC | 0.3% |
| Not Rated | 1.5% |
| Non-Fixed Income | 0.1% |
| Money Market Funds | 2.3% |
Ratings are assigned using Moody’s, Fitch, and Standard & Poor’s and applying a hierarchy: If all 3 agencies rate a security, the middle rating is assigned; if 2 agencies rate a security, the lower rating is assigned. If none of the 3 agencies rate a security, we use DBRS Morningstar. If none of the 4 agencies rate a security, we use Kroll Bond Rating Agency. Ratings are shown in the S&P and Fitch scale (e.g., AAA). All ratings are subject to change.
~ The fund invests a portion of its assets in Exchange-Traded Funds (ETFs) or Options on ETFs to gain fixed income exposure. Percentages include the direct exposure from investing in ETFs or Options on ETFs and not the indirect exposure to the underlying holdings.
Ratings are assigned using Moody’s, Fitch, and Standard & Poor’s and applying a hierarchy: If all 3 agencies rate a security, the middle rating is assigned; if 2 agencies rate a security, the lower rating is assigned. If none of the 3 agencies rate a security, we use DBRS Morningstar. If none of the 4 agencies rate a security, we use Kroll Bond Rating Agency. Ratings are shown in the S&P and Fitch scale (e.g., AAA). All ratings are subject to change.
| [1] | Includes the effect of any management fee waivers, if applicable. |
| [2] | Includes the effect of any management fee waivers, if applicable. |
| [3] | Includes the effect of any management fee waivers, if applicable. |
| [4] | Includes the effect of any management fee waivers, if applicable. |
| [5] | Includes the effect of any management fee waivers, if applicable. |
| [6] | Includes the effect of any management fee waivers, if applicable. |
| [7] | Includes the effect of any management fee waivers, if applicable. |
| [8] | Includes the effect of any management fee waivers, if applicable. |
| [9] | Includes the effect of any management fee waivers, if applicable. |
| [10] | Expenses are direct expenses and do not include underlying fund fees and expenses. |
| [11] | Includes the effect of any management fee waivers, if applicable. |
| [12] | Expenses are direct expenses and do not include underlying fund fees and expenses. |
| [13] | Includes the effect of any management fee waivers, if applicable. |
| [14] | Expenses are direct expenses and do not include underlying fund fees and expenses. |
| [15] | Includes the effect of any management fee waivers, if applicable. |
| [16] | Expenses are direct expenses and do not include underlying fund fees and expenses. |
| [17] | Includes the effect of any management fee waivers, if applicable. |
| [18] | Expenses are direct expenses and do not include underlying fund fees and expenses. |
| [19] | Includes the effect of any management fee waivers, if applicable. |
| [20] | Expenses are direct expenses and do not include underlying fund fees and expenses. |
| [21] | Includes the effect of any management fee waivers, if applicable. |
| [22] | Expenses are direct expenses and do not include underlying fund fees and expenses. |
| [23] | Includes the effect of any management fee waivers, if applicable. |
| [24] | Expenses are direct expenses and do not include underlying fund fees and expenses. |
| [25] | Includes the effect of any management fee waivers, if applicable. |
| [26] | Expenses are direct expenses and do not include underlying fund fees and expenses. |
| [27] | Includes the effect of any management fee waivers, if applicable. |
| [28] | Includes the effect of any management fee waivers, if applicable. |
| [29] | Includes the effect of any management fee waivers, if applicable. |
| [30] | Includes the effect of any management fee waivers, if applicable. |
| [31] | Includes the effect of any management fee waivers, if applicable. |
| [32] | Includes the effect of any management fee waivers, if applicable. |
| [33] | The fund does not pay a management fee. |