Pay vs Performance Disclosure
Dec. 31, 2025
USD ($)
$ / shares
Dec. 31, 2024
USD ($)
$ / shares
Dec. 31, 2023
USD ($)
$ / shares
Dec. 31, 2022
USD ($)
$ / shares
Dec. 31, 2021
USD ($)
$ / shares
PAY VERSUS PERFORMANCE COMPARISON
The information below presents the relationship between the compensation of our Named Executive Officers and certain performance measures in accordance with Item 402(v) of Regulation S-K. The amounts presented in the tables below do not necessarily represent amounts actually earned or realized by our Named Executive Officers for the respective years. For a detailed discussion of our compensation programs and pay for performance philosophy, please refer to the “Compensation Discussion and Analysis” section above.
| Year | Summary Compensation Table Total for CEO ($)(1) | Compensation Actually Paid to CEO ($)(2) | Average Summary Compensation Table Total for Non-CEO NEOs ($)(3) | Average Compensation Actually Paid to Non-CEO NEOs ($)(2)(3) | Value of Initial Fixed $100 Investment Based On: | Net Income ($) (In Millions) | FFO per Diluted Share/Unit(5) | |||||||||||||||||||
| Total Shareholder Return ($) | Peer Group Total Shareholder Return ($)(4) | |||||||||||||||||||||||||
| 2025 | 8,288,366 | 14,919,391 | 2,767,824 | 4,489,078 | 155.0 | 126.7 | 264.0 | 2.96 | ||||||||||||||||||
| 2024 | 6,617,506 | 6,952,717 | 2,279,283 | 2,367,001 | 136.6 | 117.6 | 296.0 | 2.65 | ||||||||||||||||||
| 2023 | 6,413,736 | 6,471,113 | 2,187,401 | 2,179,595 | 139.5 | 112.0 | 285.8 | 2.44 | ||||||||||||||||||
| 2022 | 5,675,125 | 5,009,154 | 1,946,025 | 1,758,889 | 124.7 | 100.6 | 381.6 | 2.28 | ||||||||||||||||||
| 2021 | 5,242,451 | 10,913,430 | 1,853,333 | 3,779,800 | 167.0 | 134.1 | 277.2 | 1.97 | ||||||||||||||||||
(1)The dollar amounts reported are the amounts of total compensation reported for our CEO, Mr. Baccile, in the Summary Compensation Table for the years ended December 31, 2025, 2024, 2023, 2022 and 2021.
(2)The dollar amounts represent the amount of “compensation actually paid,” as computed in accordance with Item 402(v) of Regulation S-K. The tables below these footnotes show the steps taken to compute such amounts paid to the CEO and non-CEO NEOs in accordance with Item 402(v) of Regulation S-K.
(3)The dollar amounts reported reflect the average compensation reported for our NEOs, other than our CEO, in the Summary Compensation Table for the years ended December 31, 2025, 2024, 2023, 2022 and 2021.
(4)Reflects cumulative total shareholder return of the FTSE Nareit All Equity REITs Index (the “FTSE Index”), which is the index used by the Company for purposes of Item 201(e) of Regulation S-K under the Exchange Act in the Company’s Annual Report on Form 10-K for the year ended December 31, 2025.
(5)FFO represents net income available to common stockholders, unitholders and participating securities, plus depreciation and other amortization of real estate, plus impairment of real estate, minus gain (or plus loss) on sale of real estate, adjusted for any associated income tax provision or benefit. Similar adjustments are made for our share of net income from an unconsolidated joint venture. FFO is a non-GAAP financial measure created by Nareit as a supplemental measure of REIT operating performance that excludes certain items from net income determined in accordance with GAAP. FFO is calculated by the Company in accordance with the definition adopted by the Board of Governors of Nareit and therefore may not be comparable to other similarly titled measures of other companies.
| Year | 2025 | 2024 | 2023 | 2022 | 2021 | ||||||||||||||||||||||||
| CEO | |||||||||||||||||||||||||||||
| Summary Compensation Table (SCT) Total Compensation ($) | 8,288,366 | 6,617,506 | 6,413,736 | 5,675,125 | 5,242,451 | ||||||||||||||||||||||||
| Adjustments for stock awards: | |||||||||||||||||||||||||||||
| Reported Value of Equity Awards in SCT ($) | (5,212,199) | (3,810,539) | (3,714,199) | (3,165,627) | (2,113,787) | ||||||||||||||||||||||||
| Fair Value of Equity Awards Granted in the Year and Unvested ($) | 7,200,241 | 3,898,748 | 3,758,544 | 2,957,058 | 3,873,565 | ||||||||||||||||||||||||
| Change in Fair Value of Outstanding and Unvested Equity Awards from Prior Years ($) | 1,590,083 | 223,528 | 102,783 | (938,114) | 2,695,084 | ||||||||||||||||||||||||
| Change in Fair Value of Equity Awards Granted in Prior Years that Vested in the Year ($) | 2,490,672 | (207,851) | (292,753) | 199,495 | 1,017,850 | ||||||||||||||||||||||||
| Value of Dividends or other Earnings Paid on Awards ($) | 562,228 | 231,325 | 203,002 | 281,217 | 198,267 | ||||||||||||||||||||||||
Compensation Actually Paid ($)(1)(2) | 14,919,391 | 6,952,717 | 6,471,113 | 5,009,154 | 10,913,430 | ||||||||||||||||||||||||
| Non-CEO NEOs | |||||||||||||||||||||||||||||
| SCT Total Compensation ($) | 2,767,824 | 2,279,283 | 2,187,401 | 1,946,025 | 1,853,333 | ||||||||||||||||||||||||
| Adjustments for stock awards: | |||||||||||||||||||||||||||||
| Reported Value of Equity Awards in SCT ($) | (1,333,323) | (994,037) | (963,439) | (807,314) | (702,519) | ||||||||||||||||||||||||
| Fair Value of Equity Awards Granted in the Year and Unvested ($) | 1,841,865 | 1,017,590 | 974,392 | 754,115 | 1,287,373 | ||||||||||||||||||||||||
| Change in Fair Value of Outstanding and Unvested Equity Awards from Prior Years ($) | 416,696 | 58,722 | 27,602 | (293,287) | 797,355 | ||||||||||||||||||||||||
| Change in Fair Value of Equity Awards Granted in Prior Years that Vested in the Year ($) | 649,770 | (53,806) | (107,620) | 69,244 | 463,324 | ||||||||||||||||||||||||
| Value of Dividends or other Earnings Paid on Awards ($) | 146,246 | 59,249 | 61,259 | 90,106 | 80,934 | ||||||||||||||||||||||||
Compensation Actually Paid ($)(1)(2) | 4,489,078 | 2,367,001 | 2,179,595 | 1,758,889 | 3,779,800 | ||||||||||||||||||||||||
(1)Fair value or change in fair value, as applicable, of equity awards in “Compensation Actually Paid” was determined by reference to (a) for Time-Based Units and Time-Based RSUs, closing price on applicable year-end dates ($66.20, $48.26, $52.67, $50.13 and $57.27 as of December 31, 2021, 2022, 2023, 2024 and 2025, respectively) or, in the case of vesting dates, the actual vesting price, and (b) for Performance Units and Performance RSUs, the fair value calculated by a Monte Carlo simulation model as of the applicable year-end date(s) or in the case of vesting date, the actual vesting price, determined based on the same methodology as used to determine grant date fair values but using the closing stock price on the applicable revaluation date as the current market price and based on volatility, dividend rates and risk free rates determined as of the revaluation date.
(2)As previously discussed in the Company’s 2021 proxy statement, during the year ended December 31, 2020, each NEO received one-time transitional equity grants in connection with the transition of the historical compensation program to our current compensation program. Specifically, the 2020 grants included one-year, two-year and three-year vesting or performance periods as one-time only grants in order maintain an appropriate level of overall long-term compensation opportunity during the transition between the two programs. For the years ended December 31, 2022 and 2021, the value of these one-time transition awards included in Compensation Actually Paid for the CEO was $(74,205) and $743,580, respectively. For the years ended December 31, 2022 and 2021, the value of these one-time transition awards included in Compensation Actually Paid for the Non-CEO NEOs was $(40,450) and $111,154, respectively.
(3)The dollar amounts reported reflect the average compensation reported for our NEOs, other than our CEO, in the Summary Compensation Table for the years ended December 31, 2025, 2024, 2023, 2022 and 2021.
(4)Reflects cumulative total shareholder return of the FTSE Nareit All Equity REITs Index (the “FTSE Index”), which is the index used by the Company for purposes of Item 201(e) of Regulation S-K under the Exchange Act in the Company’s Annual Report on Form 10-K for the year ended December 31, 2025.
| Year | 2025 | 2024 | 2023 | 2022 | 2021 | ||||||||||||||||||||||||
| CEO | |||||||||||||||||||||||||||||
| Summary Compensation Table (SCT) Total Compensation ($) | 8,288,366 | 6,617,506 | 6,413,736 | 5,675,125 | 5,242,451 | ||||||||||||||||||||||||
| Adjustments for stock awards: | |||||||||||||||||||||||||||||
| Reported Value of Equity Awards in SCT ($) | (5,212,199) | (3,810,539) | (3,714,199) | (3,165,627) | (2,113,787) | ||||||||||||||||||||||||
| Fair Value of Equity Awards Granted in the Year and Unvested ($) | 7,200,241 | 3,898,748 | 3,758,544 | 2,957,058 | 3,873,565 | ||||||||||||||||||||||||
| Change in Fair Value of Outstanding and Unvested Equity Awards from Prior Years ($) | 1,590,083 | 223,528 | 102,783 | (938,114) | 2,695,084 | ||||||||||||||||||||||||
| Change in Fair Value of Equity Awards Granted in Prior Years that Vested in the Year ($) | 2,490,672 | (207,851) | (292,753) | 199,495 | 1,017,850 | ||||||||||||||||||||||||
| Value of Dividends or other Earnings Paid on Awards ($) | 562,228 | 231,325 | 203,002 | 281,217 | 198,267 | ||||||||||||||||||||||||
Compensation Actually Paid ($)(1)(2) | 14,919,391 | 6,952,717 | 6,471,113 | 5,009,154 | 10,913,430 | ||||||||||||||||||||||||
| Non-CEO NEOs | |||||||||||||||||||||||||||||
| SCT Total Compensation ($) | 2,767,824 | 2,279,283 | 2,187,401 | 1,946,025 | 1,853,333 | ||||||||||||||||||||||||
| Adjustments for stock awards: | |||||||||||||||||||||||||||||
| Reported Value of Equity Awards in SCT ($) | (1,333,323) | (994,037) | (963,439) | (807,314) | (702,519) | ||||||||||||||||||||||||
| Fair Value of Equity Awards Granted in the Year and Unvested ($) | 1,841,865 | 1,017,590 | 974,392 | 754,115 | 1,287,373 | ||||||||||||||||||||||||
| Change in Fair Value of Outstanding and Unvested Equity Awards from Prior Years ($) | 416,696 | 58,722 | 27,602 | (293,287) | 797,355 | ||||||||||||||||||||||||
| Change in Fair Value of Equity Awards Granted in Prior Years that Vested in the Year ($) | 649,770 | (53,806) | (107,620) | 69,244 | 463,324 | ||||||||||||||||||||||||
| Value of Dividends or other Earnings Paid on Awards ($) | 146,246 | 59,249 | 61,259 | 90,106 | 80,934 | ||||||||||||||||||||||||
Compensation Actually Paid ($)(1)(2) | 4,489,078 | 2,367,001 | 2,179,595 | 1,758,889 | 3,779,800 | ||||||||||||||||||||||||
(1)Fair value or change in fair value, as applicable, of equity awards in “Compensation Actually Paid” was determined by reference to (a) for Time-Based Units and Time-Based RSUs, closing price on applicable year-end dates ($66.20, $48.26, $52.67, $50.13 and $57.27 as of December 31, 2021, 2022, 2023, 2024 and 2025, respectively) or, in the case of vesting dates, the actual vesting price, and (b) for Performance Units and Performance RSUs, the fair value calculated by a Monte Carlo simulation model as of the applicable year-end date(s) or in the case of vesting date, the actual vesting price, determined based on the same methodology as used to determine grant date fair values but using the closing stock price on the applicable revaluation date as the current market price and based on volatility, dividend rates and risk free rates determined as of the revaluation date.
(2)As previously discussed in the Company’s 2021 proxy statement, during the year ended December 31, 2020, each NEO received one-time transitional equity grants in connection with the transition of the historical compensation program to our current compensation program. Specifically, the 2020 grants included one-year, two-year and three-year vesting or performance periods as one-time only grants in order maintain an appropriate level of overall long-term compensation opportunity during the transition between the two programs. For the years ended December 31, 2022 and 2021, the value of these one-time transition awards included in Compensation Actually Paid for the CEO was $(74,205) and $743,580, respectively. For the years ended December 31, 2022 and 2021, the value of these one-time transition awards included in Compensation Actually Paid for the Non-CEO NEOs was $(40,450) and $111,154, respectively.
| CAP vs. Shareholder Return | ||
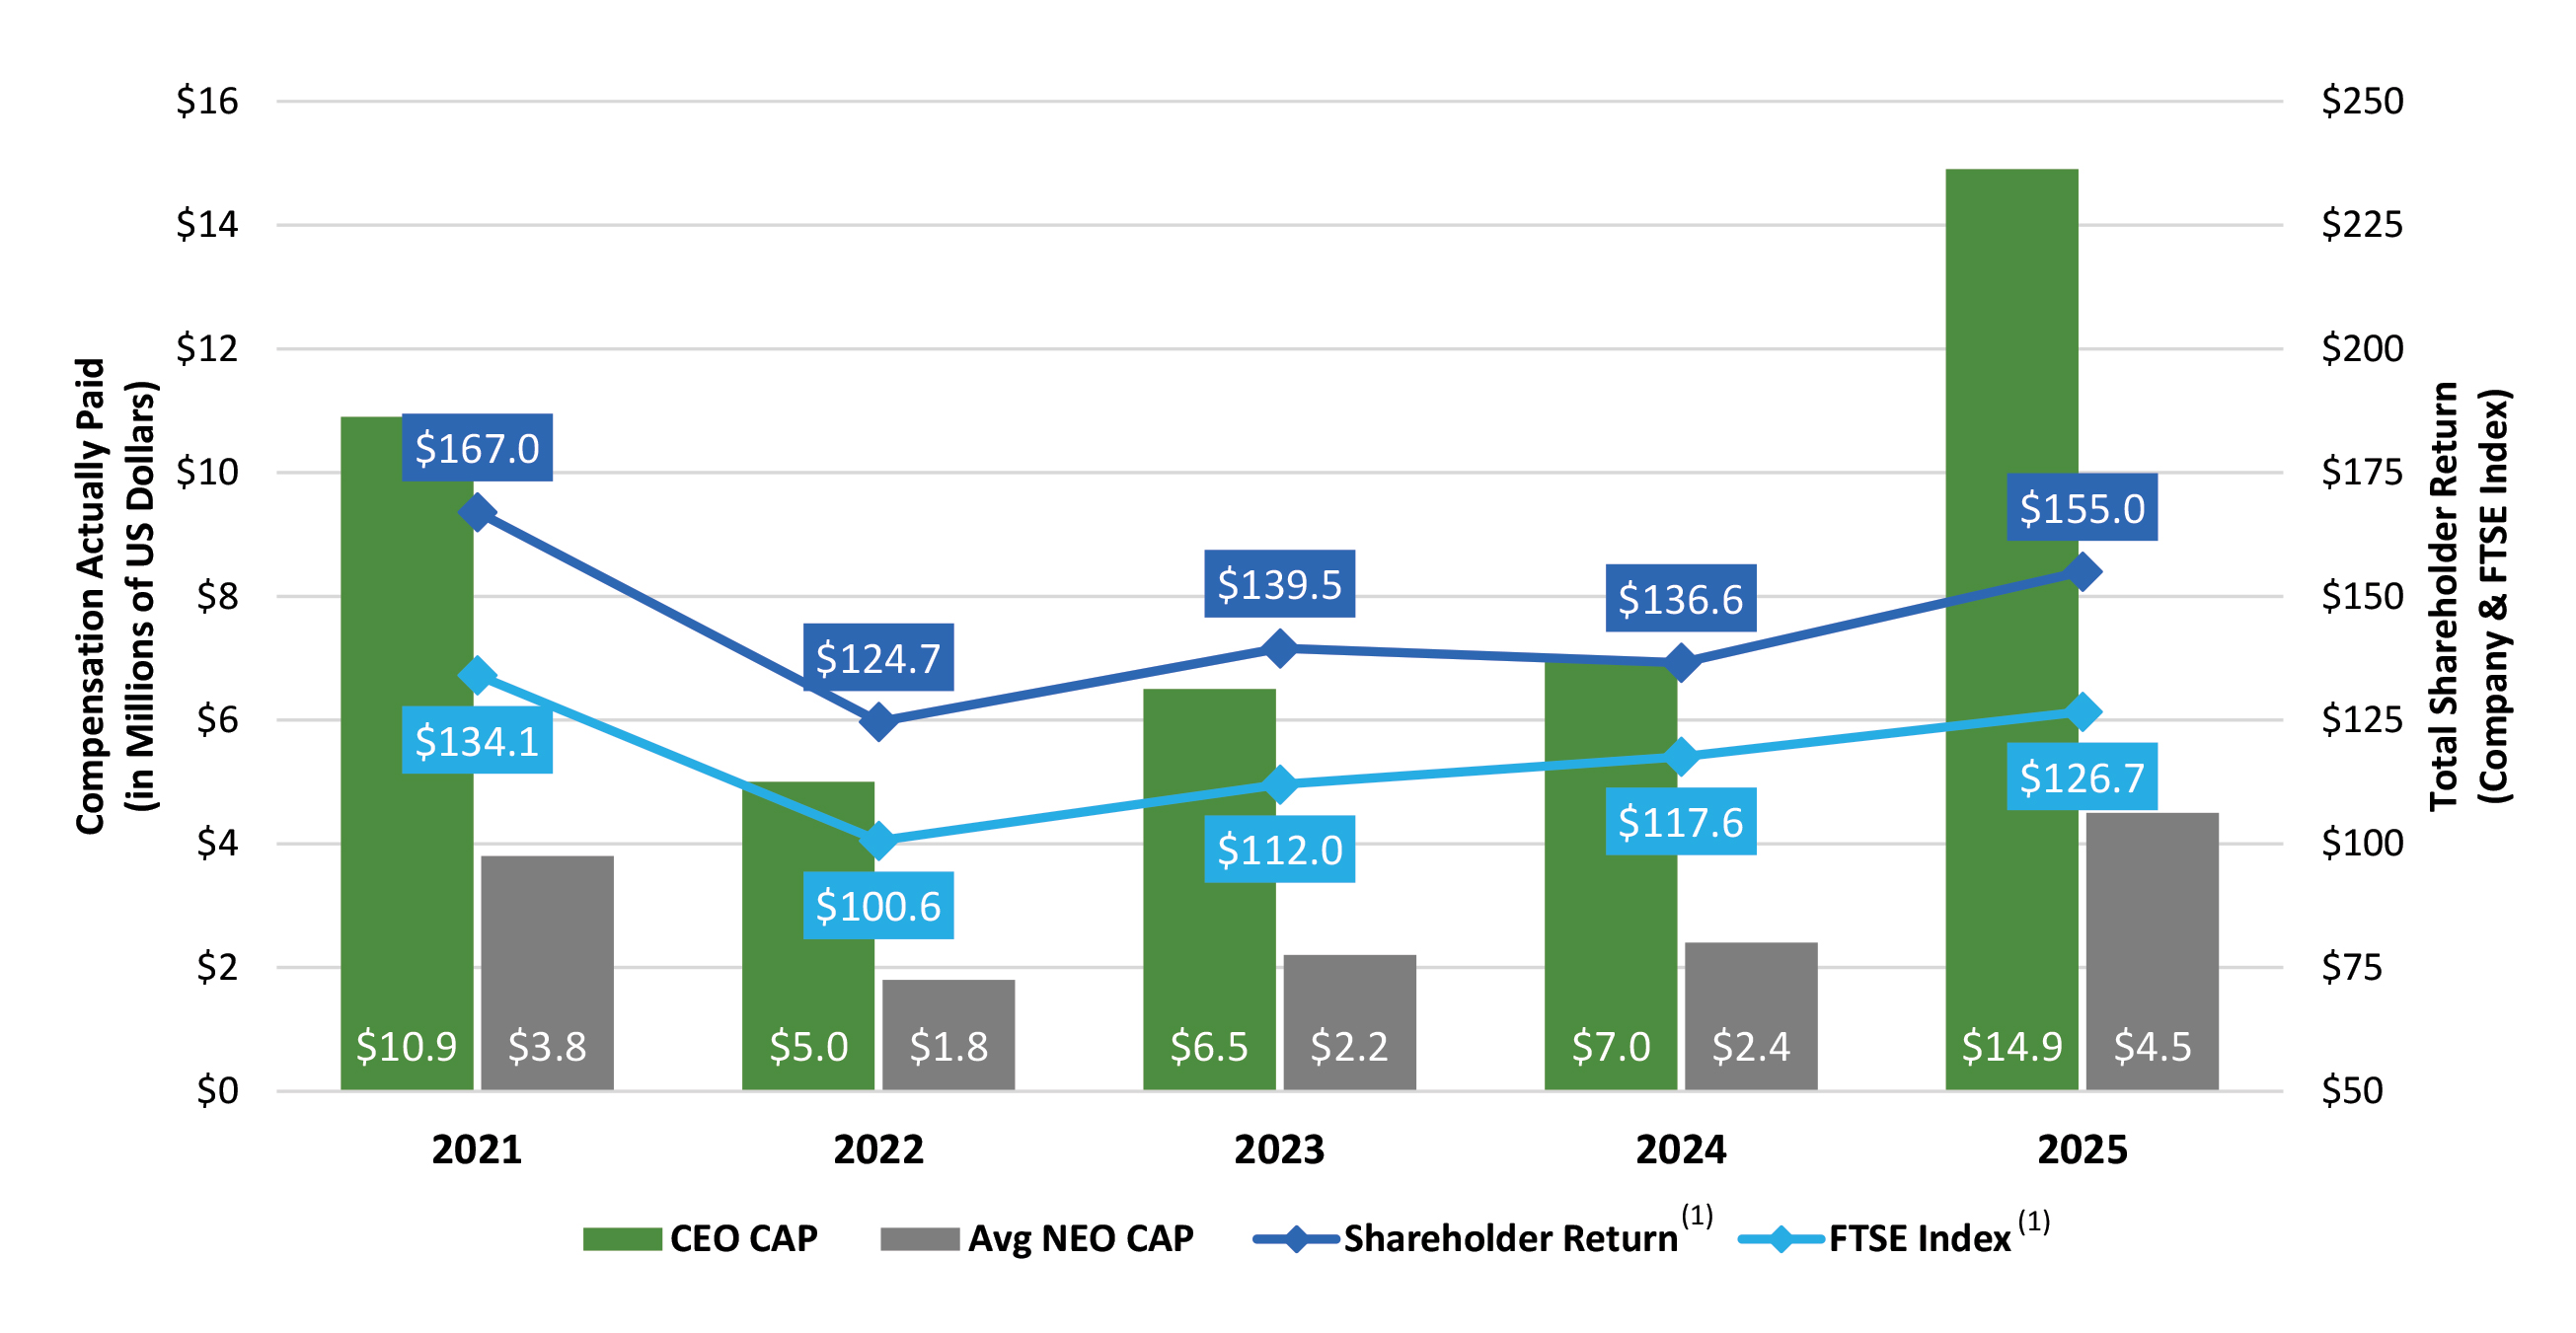 | ||
(1)Value assumes $100 invested on December 31, 2020.
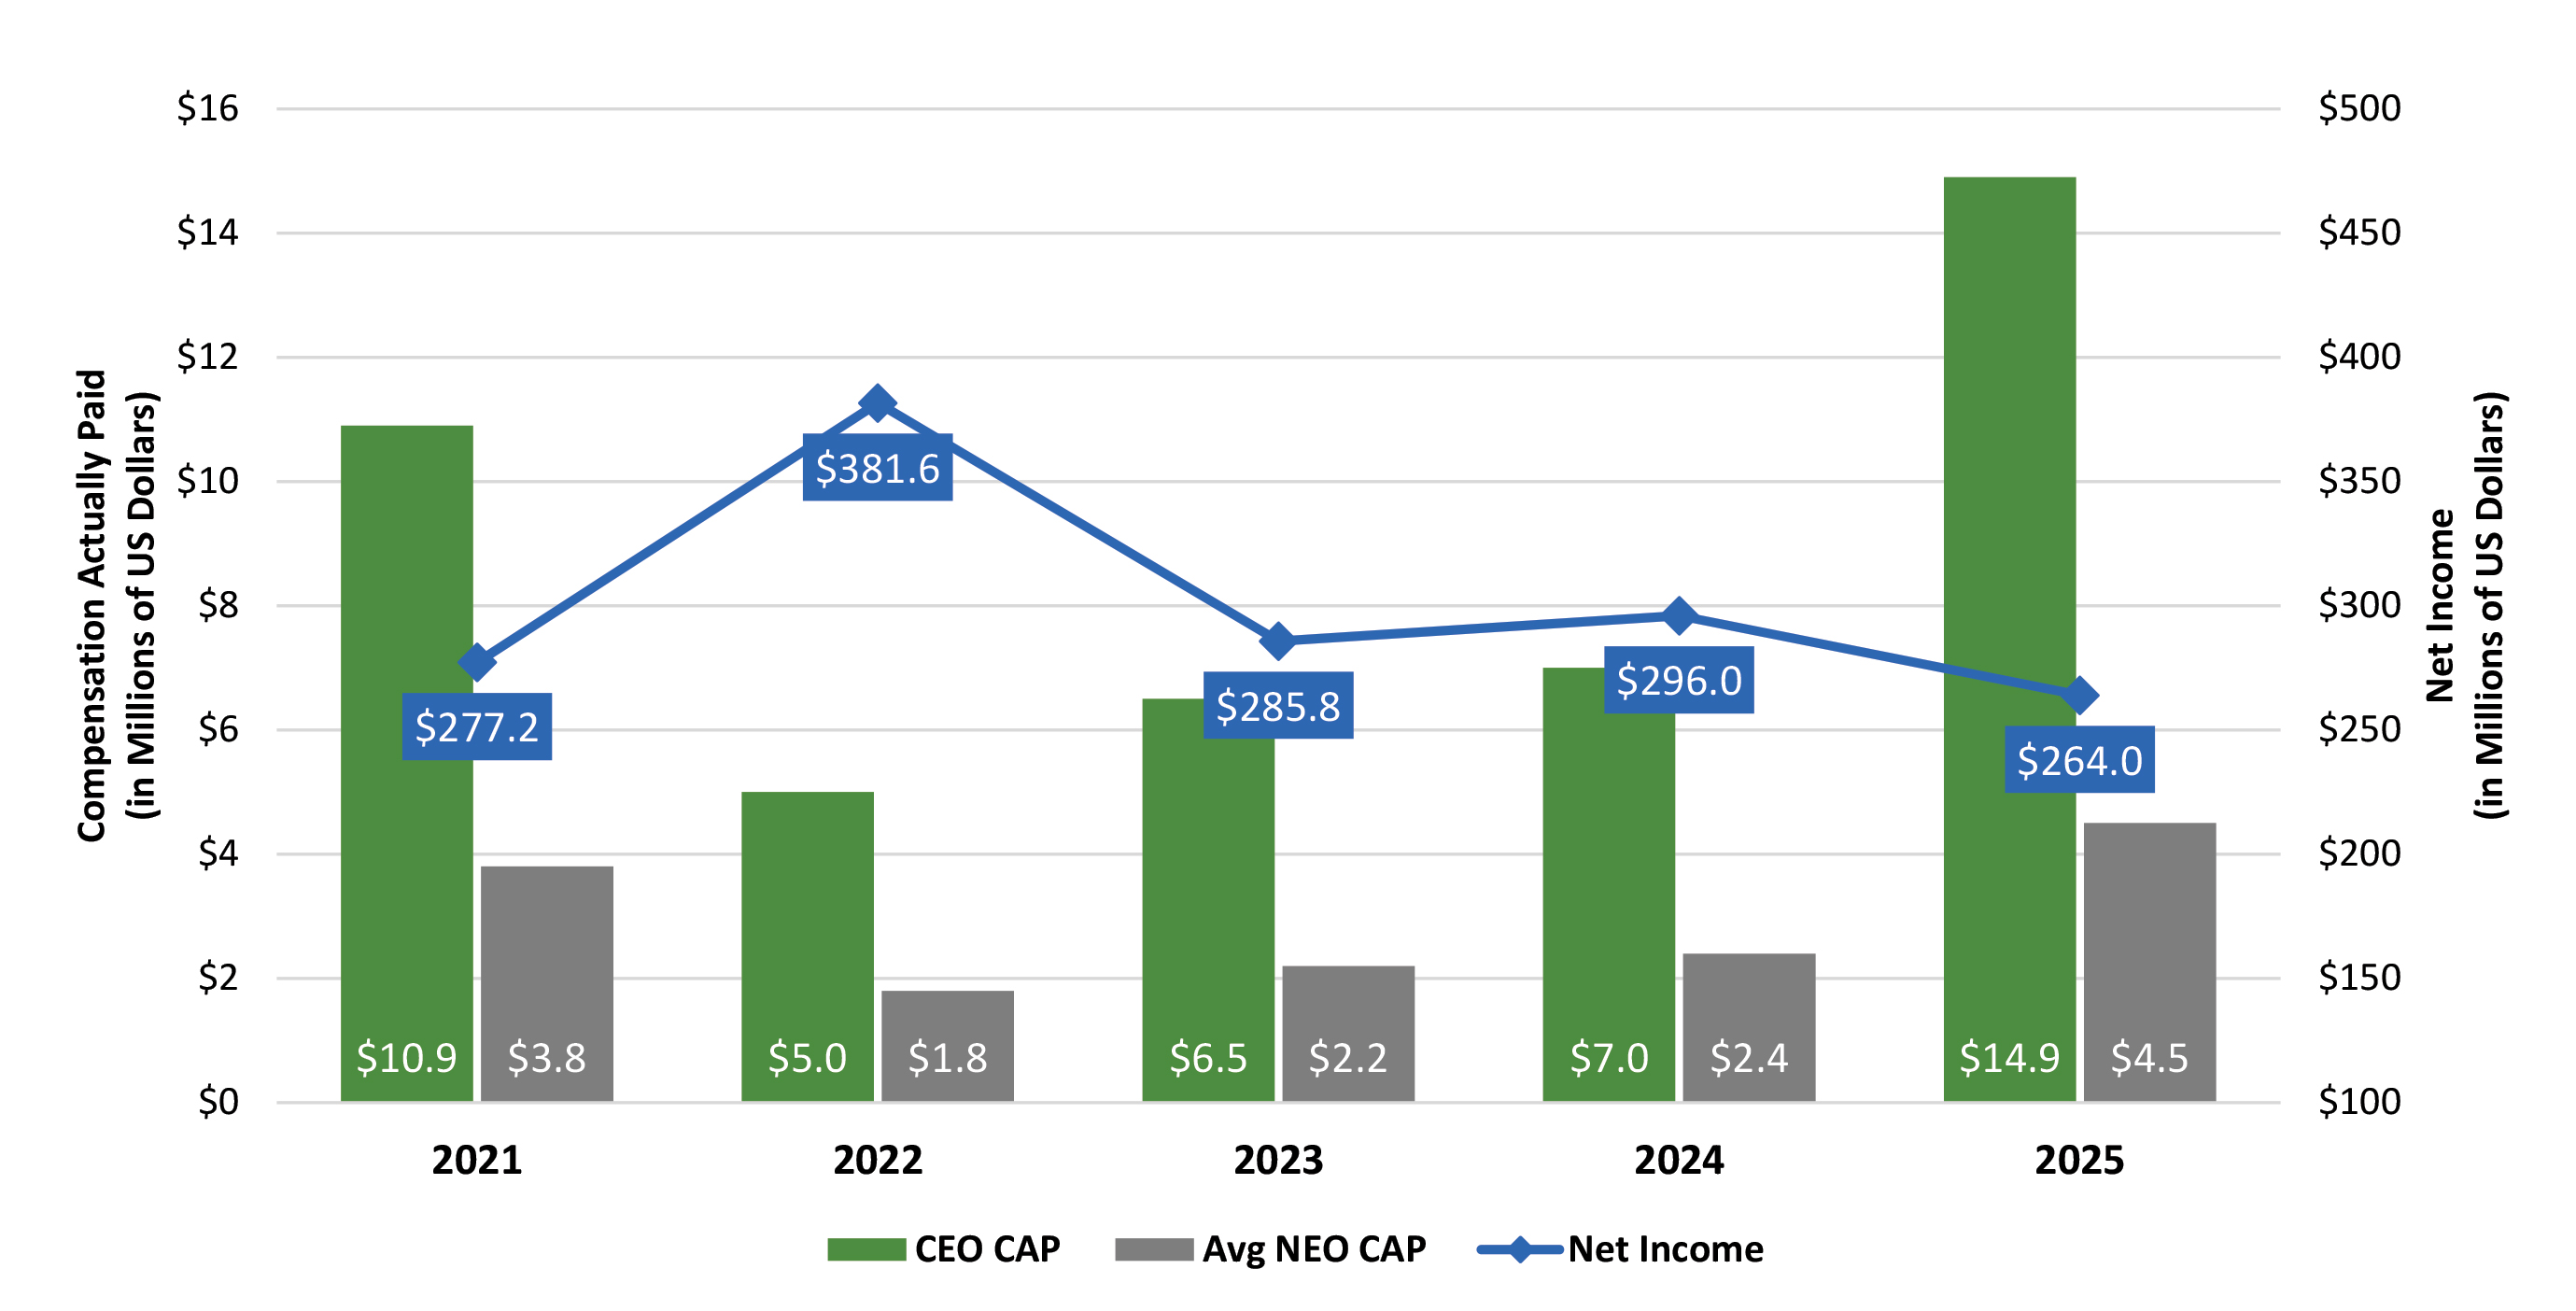
| CAP vs. Net Income | ||
 | ||
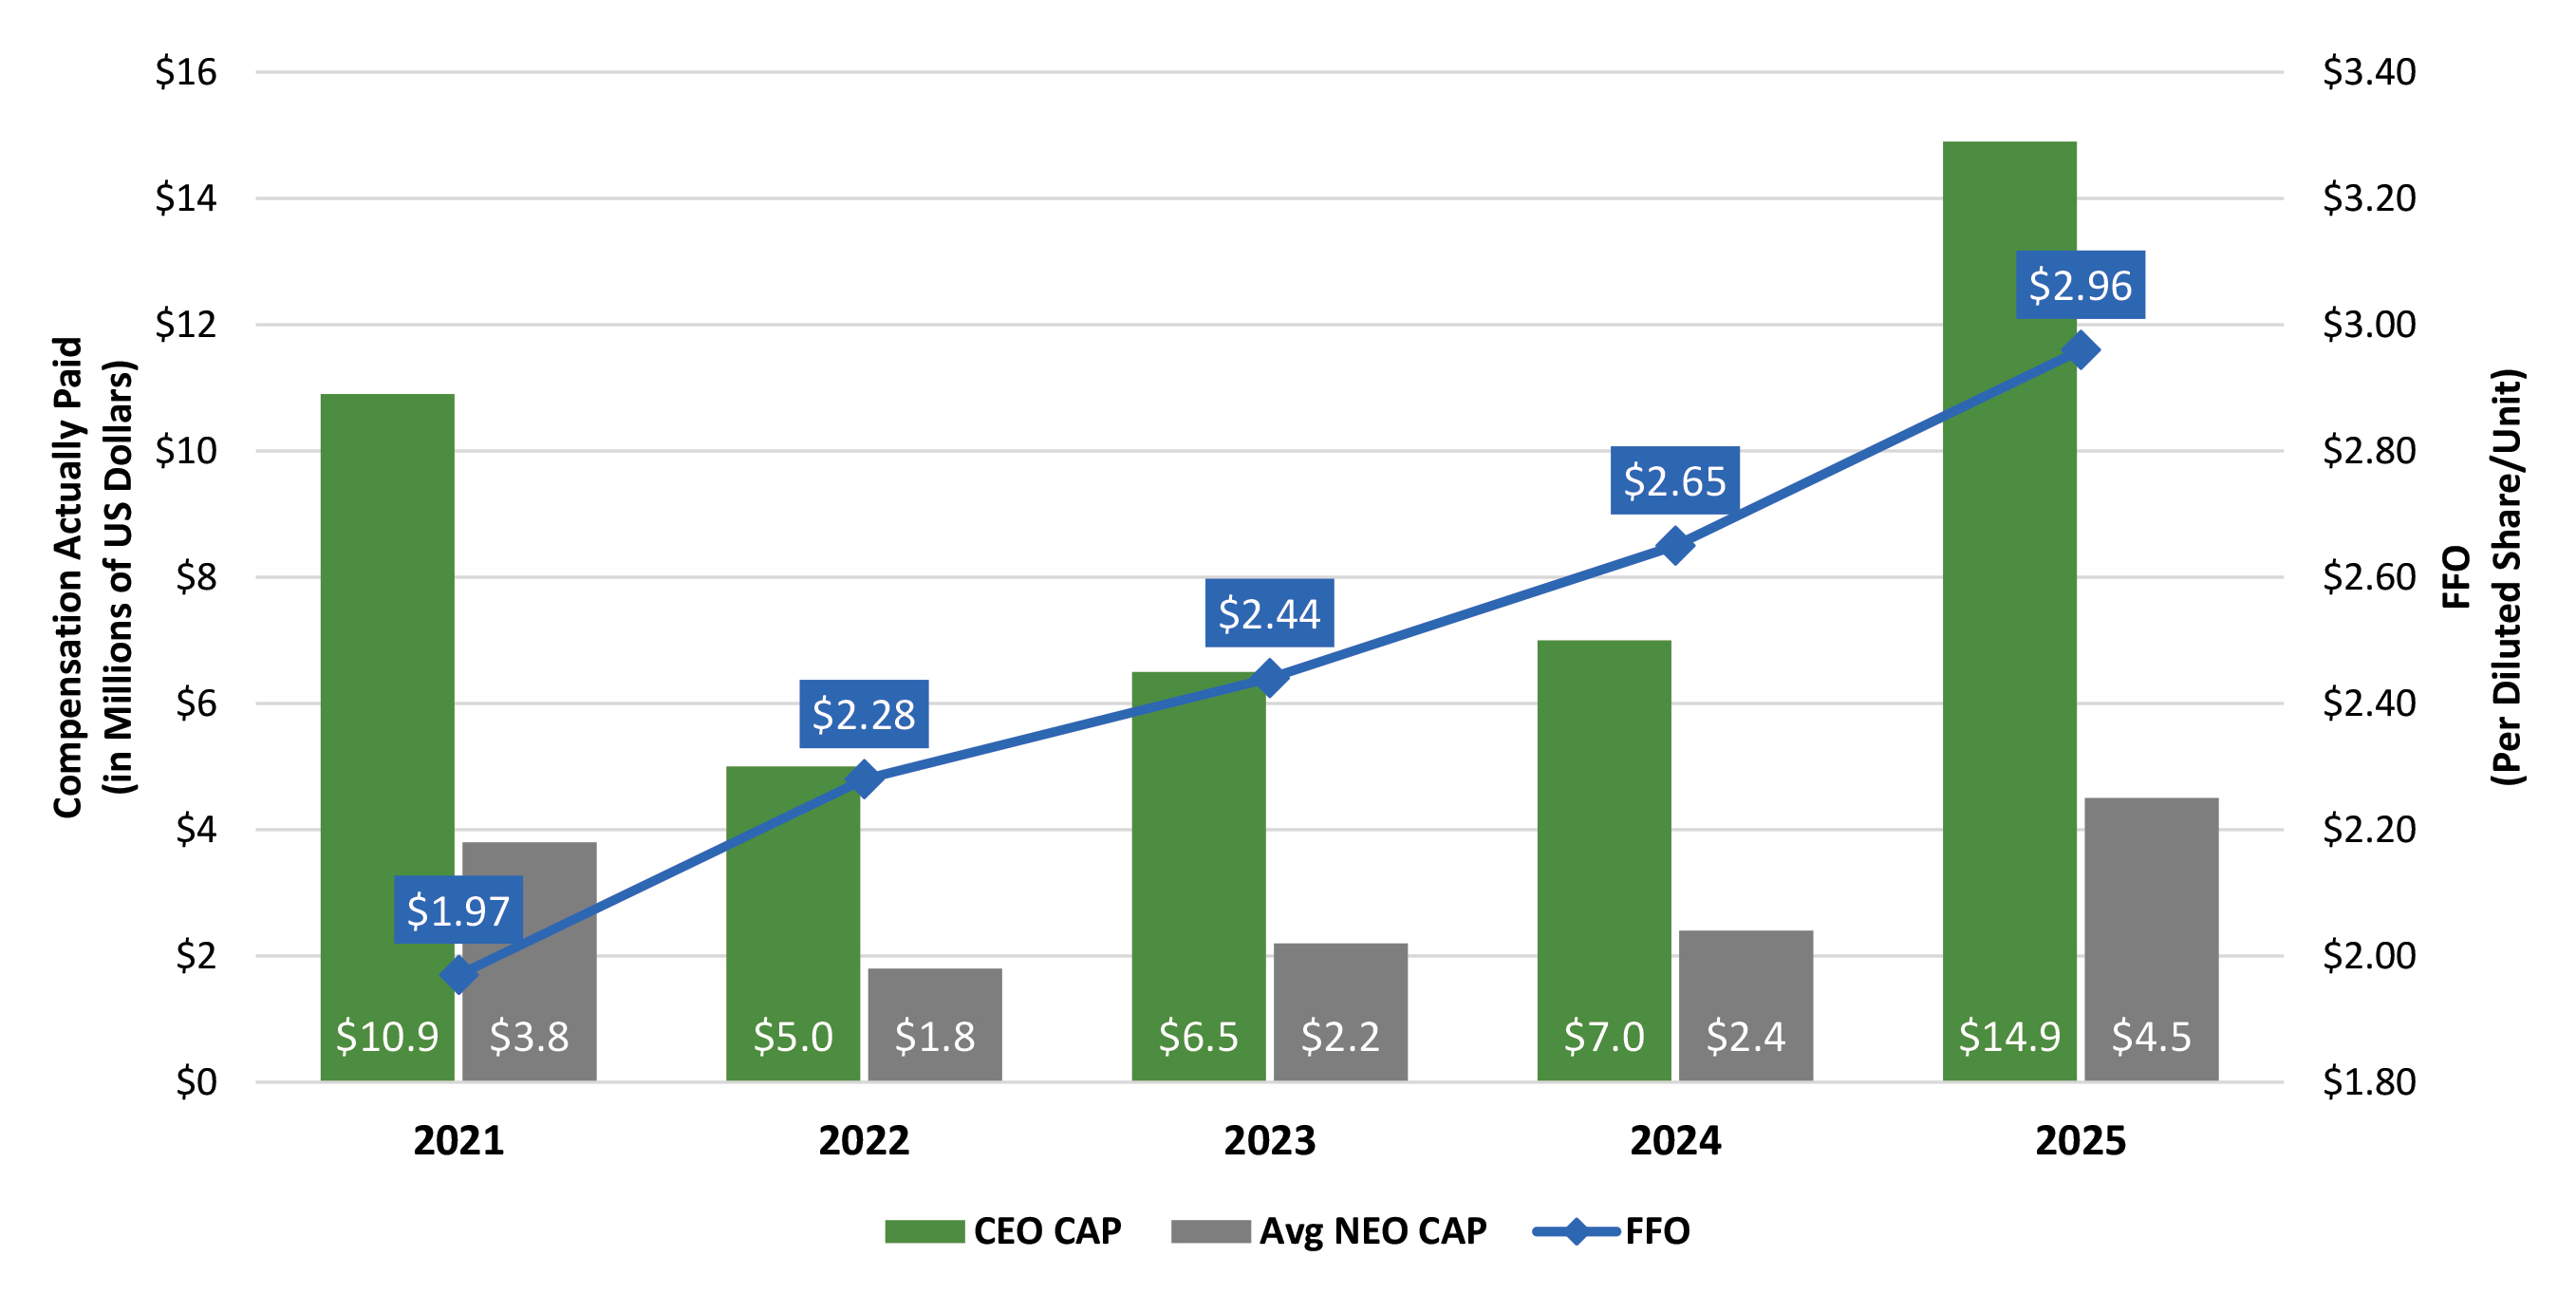
| CAP vs. FFO per Diluted Share/Unit | ||
 | ||
Other Important Financial Performance Measures for Executive Compensation
The following is a list identifying the most important financial performance measures used by our Compensation Committee to link the “compensation actually paid” (“CAP”) to our CEO and other Named Executive Officers in 2025 to the Company’s performance. The role of each of these performance measures on our Named Executive Officer’s compensation is discussed in the “Compensation Discussion and Analysis” section above.
| Financial Performance Measures | ||
FFO per Diluted Share/Unit | ||
| Relative TSR to FTSE Nareit All REITs Equity Index | ||
Relative TSR to Long-Term Incentive Peer Group | ||
| Cash Same Store NOI Growth | ||
(2)The dollar amounts represent the amount of “compensation actually paid,” as computed in accordance with Item 402(v) of Regulation S-K. The tables below these footnotes show the steps taken to compute such amounts paid to the CEO and non-CEO NEOs in accordance with Item 402(v) of Regulation S-K.