Pay vs Performance Disclosure - USD ($)
Dec. 31, 2025
Dec. 31, 2024
Dec. 31, 2023
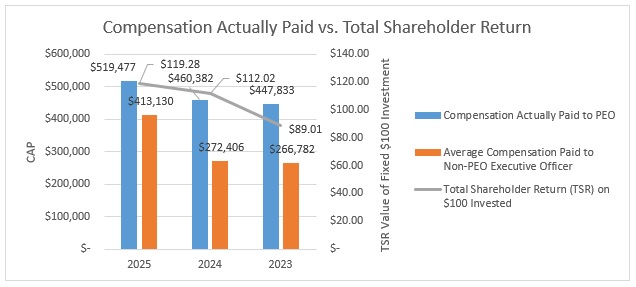
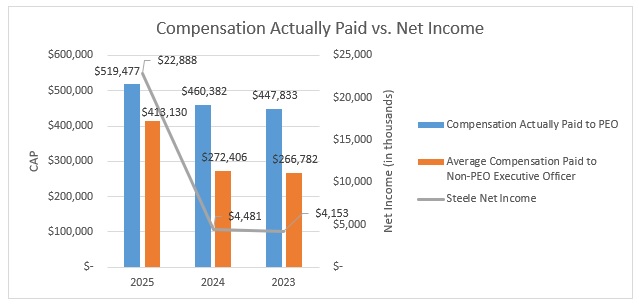
PAY VERSUS PERFORMANCE TABLE
|
Year |
Summary Compensation Table Total for PEO (1) |
Compensation Actually Paid to PEO (1) |
Average Summary Compensation Table Total for Non‑PEO Named Executive Officers (2) |
Average Compensation Actually Paid to Non‑PEO Named Executive Officers (2) |
Value of Initial Fixed $100 Investment Based on Total Shareholder Return |
Net Income (In thousands) |
||||||||||||||||||
|
2025 |
$ | 519,477 | $ | 519,477 | $ | 413,130 | $ | 413,130 | $ | 119.28 | $ | 22,888 | ||||||||||||
|
2024 |
$ | 460,382 | $ | 460,382 | $ | 272,406 | $ | 272,406 | $ | 112.02 | $ | 4,481 | ||||||||||||
| 2023 | $ | 447,833 | $ | 447,833 | $ | 266,782 | $ | 266,782 | $ | 89.01 | $ | 4,153 | ||||||||||||
(1) “PEO,” or Principal Executive Officer, was Jeffrey J. Kapsar for 2025, 2024 and 2023.
(2) Non‑PEO NEOs in 2025 were Thomas C. Graver, Jr. and J. Todd Troxell, and in 2024 and 2023 were Thomas C. Graver, Jr. and Thomas L. Eberhart.