Pay vs Performance Disclosure
Dec. 31, 2025
Sep. 30, 2025
Dec. 31, 2025
USD ($)
Dec. 31, 2024
USD ($)
Dec. 31, 2023
USD ($)
Dec. 31, 2022
USD ($)
Dec. 31, 2021
USD ($)
Value of Initial Fixed $100 Investment(2) Based On: | ||||||||||||||||||||||||||||||||
| Year | Summary Compensation Table Total for PEO Gary Shiffman(1) | Compensation Actually Paid to PEO Gary Shiffman | Summary Compensation Table Total for PEO Charles Young(1) | Compensation Actually Paid to PEO Charles Young | Average Summary Compensation Table Total for Non-PEO NEOs | Average Compensation Actually Paid to Non-PEO NEOs | Total Shareholder Return | Dow Jones U.S. Real Estate Residential Index | Net Income / (loss)(3) (in millions) | Core FFO / Share | ||||||||||||||||||||||
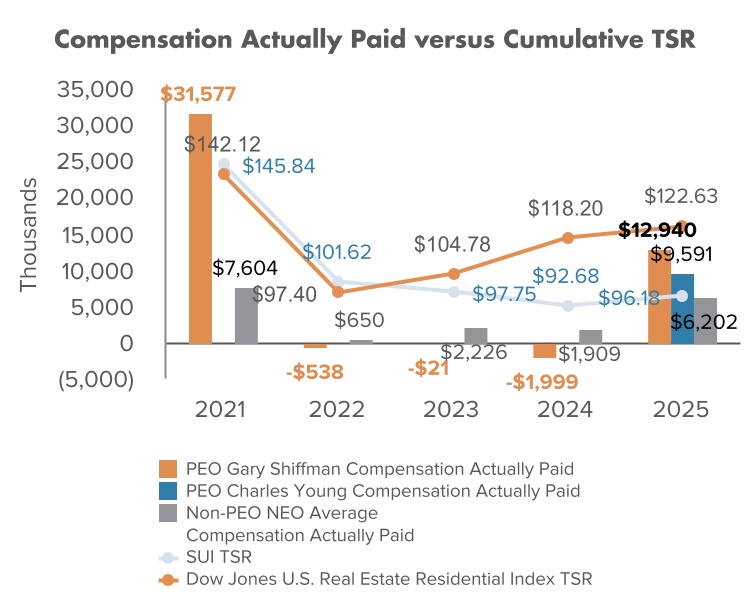
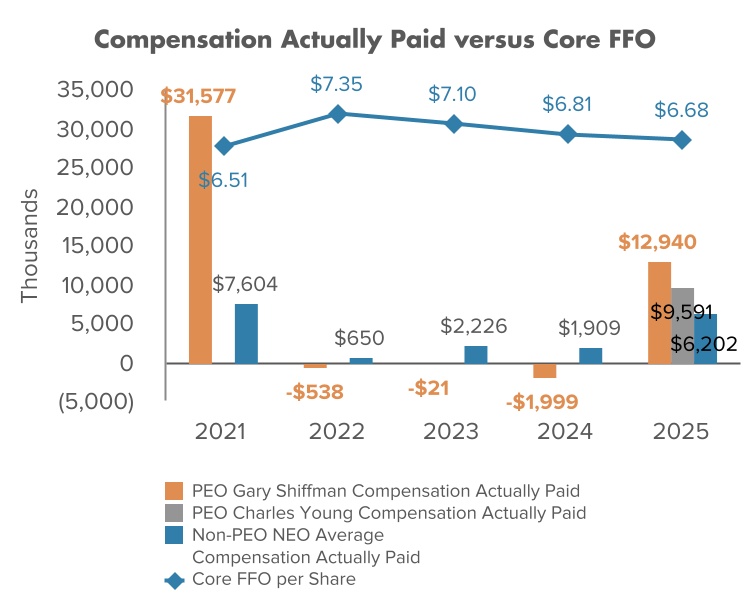
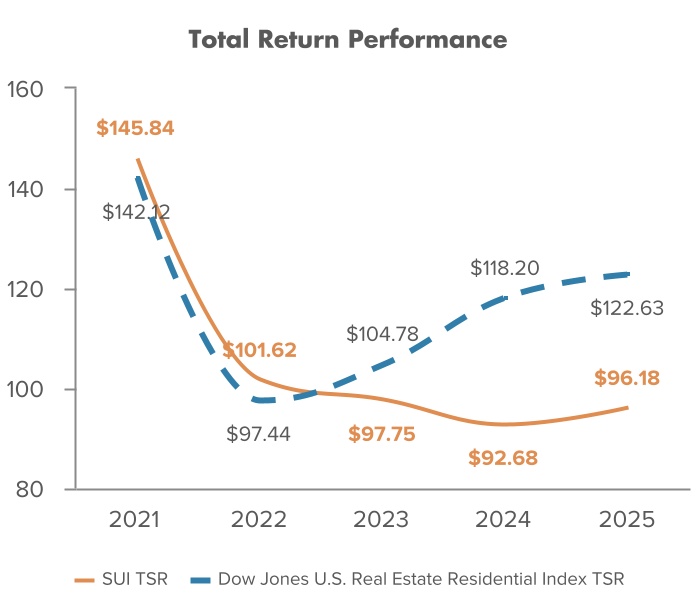
2025 | $ | 12,549,984 | $ | 12,940,234 | $ | 9,865,401 | $ | 9,590,997 | $ | 6,608,756 | $ | 5,931,772 | $ | 96.18 | $ | 122.63 | $ | 1,361.2 | $ | 6.68 | ||||||||||||
2024 | $ | 2,663,867 | $ | (1,998,961) | $ | — | $ | — | $ | 2,912,462 | $ | 1,908,646 | $ | 92.68 | $ | 118.20 | $ | 89.0 | $ | 6.81 | ||||||||||||
2023 | $ | 11,870,887 | $ | (21,335) | $ | — | $ | — | $ | 2,946,851 | $ | 2,225,608 | $ | 97.75 | $ | 104.78 | $ | (213.3) | $ | 7.10 | ||||||||||||
2022 | $ | 15,879,159 | $ | (537,705) | $ | — | $ | — | $ | 3,797,842 | $ | 650,211 | $ | 101.62 | $ | 97.44 | $ | 242.0 | $ | 7.35 | ||||||||||||
2021 | $ | 14,791,142 | $ | 31,577,299 | $ | — | $ | — | $ | 4,374,864 | $ | 7,604,150 | $ | 145.84 | $ | 142.12 | $ | 380.2 | $ | 6.51 | ||||||||||||
Our Non-PEO NEOs included in the table above are as follows:
| Year | Non-PEO NEOs | ||||
2025 | Fernando Castro-Caratini, Marc Farrugia, John B. McLaren, Aaron Weiss | ||||
2024 | Fernando Castro-Caratini, Bruce D. Thelen, John B. McLaren, Aaron Weiss | ||||
2023 | Fernando Castro-Caratini, Bruce D. Thelen, Marc Farrugia, Aaron Weiss | ||||
2022 | Fernando Castro-Caratini, Karen J. Dearing, John B. McLaren, Bruce D. Thelen, Aaron Weiss | ||||
2021 | Karen J. Dearing, John B. McLaren, Bruce D. Thelen, Aaron Weiss | ||||
Differences in our summary compensation table amounts and compensation actually paid reflect the following:
| Year | 2025 | 2024 | 2023 | 2022 | 2021 | |||||||||||||||||||||||||||||||||||||||||||||
| PEO - Gary Shiffman | PEO - Charles Young | Non-PEO NEOs | PEO | Non-PEO NEOs | PEO | Non-PEO NEOs | PEO | Non-PEO NEOs | PEO | Non-PEO NEOs | ||||||||||||||||||||||||||||||||||||||||
| Deduction for amounts reported under the “Stock Awards” in the summary compensation table | $ | (8,337,656) | $ | (7,921,661) | $ | (4,273,854) | $ | (1,254,434) | $ | (2,174,366) | $ | (10,207,801) | $ | (2,021,183) | $ | (13,308,027) | $ | (2,449,215) | $ | (12,134,515) | $ | (3,054,299) | ||||||||||||||||||||||||||||
| Increase based on ASC 718 fair value of awards granted during the year that remain unvested as of year end, determined as of year end | 3,717,300 | 6,647,270 | 3,245,145 | 451,303 | 1,720,542 | 7,561,009 | 1,562,608 | 9,536,728 | 1,757,757 | 17,581,362 | 4,169,907 | |||||||||||||||||||||||||||||||||||||||
| Increase based on ASC 718 fair value of awards granted during the year that vested during the year, determined as of vesting date | — | 999,987 | — | — | — | — | — | — | — | — | — | |||||||||||||||||||||||||||||||||||||||
| Increase / (deduction) for awards granted during prior year that were outstanding and unvested as of year end, determined based on change in ASC 718 fair value from prior year end to current year end | 3,799,030 | — | (133,213) | (4,431,955) | (673,926) | (8,671,507) | (356,644) | (10,955,590) | (2,231,046) | 11,147,435 | 1,988,939 | |||||||||||||||||||||||||||||||||||||||
| Increase / (deduction) for awards granted during prior year that vested during the year, determined based on change in ASC 718 fair value from prior year end to vesting date | 228,868 | — | 77,826 | (123,488) | (22,847) | (773,054) | (8,584) | (2,602,551) | (389,594) | (414,809) | (22,465) | |||||||||||||||||||||||||||||||||||||||
| Deduction of ASC 718 fair value of awards granted during prior year that were forfeited during current year, determined as of prior year end | — | — | — | — | — | (725,010) | — | — | — | (356,171) | (29,706) | |||||||||||||||||||||||||||||||||||||||
| Addition of any dividends or other earnings paid on equity awards during the year, prior to the vesting date that are not otherwise reflected in the fair value of such award or included in any other component of total compensation for the year | 982,708 | — | 407,114 | 695,746 | 146,781 | 924,141 | 102,560 | 912,577 | 164,467 | 962,854 | 176,909 | |||||||||||||||||||||||||||||||||||||||
| Total Adjustments | $ | 390,250 | $ | (274,404) | $ | (676,982) | $ | (4,662,828) | $ | (1,003,816) | $ | (11,892,222) | $ | (721,243) | $ | (16,416,863) | $ | (3,147,631) | $ | 16,786,156 | $ | 3,229,285 | ||||||||||||||||||||||||||||
Our compensation "actually paid" is heavily influenced by the fair value of equity awards from year to year. As stock price volatility and fluctuations in the stock market impact the valuations of our awards, our resulting compensation “actually paid” to our PEOs and our Non-PEO NEOs can be higher or lower (or even negative, as shown for 2022 through 2024), than the figures disclosed in the summary compensation table. This is particularly true for Mr. Shiffman, whose equity awards made up approximately 82% of total compensation for 2020 through 2023, and therefore have a significant impact on our overall "actually paid" compensation.
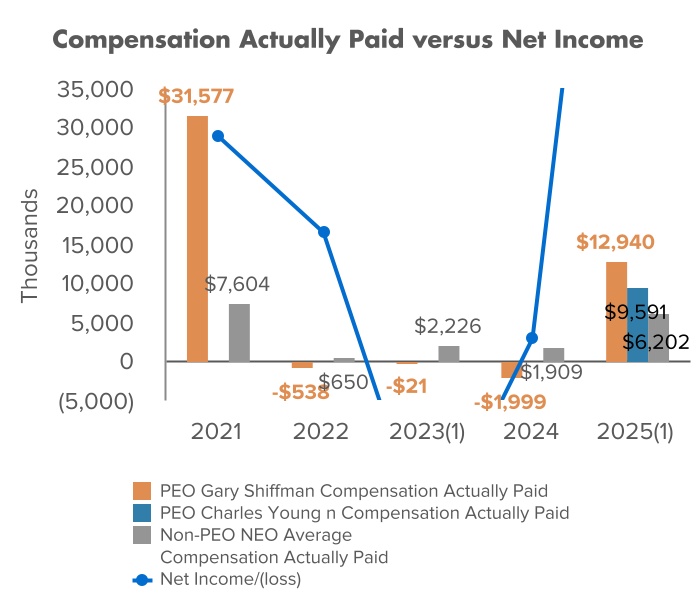
(1) 2023 and 2025 Net Income/(loss) was ($213,300) and $1,361,200, respectively, which is not reflected in the chart above due to size restrictions.
| Performance Measures | Year Ended December 31, 2025 | Methodology Used to Calculate Financial Performance Measures | Reconciliations to Non-GAAP Financial Measures | ||||||||
| Financial | |||||||||||
| Core FFO per Share Performance | $6.68 | FFO is a standard operating performance measure for REITs and is defined by Nareit as GAAP net income (loss), excluding gains (or losses) from sales of certain real estate assets, plus real estate related depreciation and amortization, impairments of certain real estate assets and investments, and after adjustments for nonconsolidated partnerships and joint ventures. Core FFO is a primary operating measure in our publicly-reported earnings results, and is defined as FFO excluding certain gain and loss items that management considers unrelated to the operational and financial performance of our core business. | Refer to Appendix A for the reconciliation of Net Income to Core FFO | ||||||||
| Same Property combined NOI growth - MH, RV, and UK | 5.5% | NOI is calculated by deducting direct property operating expenses from property operating revenues, thereby providing a measure of the actual operating performance of our properties. Same Properties are primarily those properties that we have owned and operated continuously since January 1, 2024. | Refer to (1) Appendix A for the reconciliation of Net Income to NOI and (2) table below for the breakdown of NOI | ||||||||