Pay Versus Performance
The following tables provide pay versus performance information required by Regulation S-K. For information regarding the Company’s pay-for-performance philosophy and how the Company aligns executive compensation with the Company’s performance, refer to “Executive Compensation: Compensation Discussion and Analysis.”
|
|
|
|
|
|
|
|
|
|
|
|
|
|
|
|
|
|
|
|
|
|
|
|
|
|
|
|
|
|
|
||||||
Year |
|
Summary |
|
SCT Total |
|
Compensation |
|
CAP to |
|
Average |
|
Average |
||||||||||||||||||||||||
|
|
|
|
|
|
|
|
|
|
|
|
|
|
|
|
|
|
|
|
|
|
|
|
|
|
|
|
|
|
|
||||||
|
|
|
|
|
|
|
|
|
|
|
|
|
|
|
|
|
|
|
|
|
|
|
|
|
|
|
|
|
|
|
||||||
2025 |
|
|
$ |
2,775,881 |
|
|
|
|
$ |
14,140,217 |
|
|
|
|
$ |
2,954,364 |
|
|
|
|
$ |
24,892,348 |
|
|
|
|
$ |
3,402,819 |
|
|
|
|
$ |
6,034,845 |
|
|
|
|
|
|
|
|
|
|
|
|
|
|
|
|
|
|
|
|
|
|
|
|
|
|
|
|
|
|
|
|
|
||||||
2024 |
|
|
$ |
3,301,012 |
|
|
|
|
N/A |
|
|
|
|
$ |
4,424,038 |
|
|
|
|
N/A |
|
|
|
|
$ |
2,078,530 |
|
|
|
|
$ |
2,611,401 |
|
|
||
|
|
|
|
|
|
|
|
|
|
|
|
|
|
|
|
|
|
|
|
|
|
|
|
|
|
|
|
|
|
|
||||||
|
|
|
|
|
|
|
|
|
|
|
|
|
|
|
|
|
|
|
|
|
|
|
|
|
|
|
|
|
|
|
||||||
2023 |
|
|
$ |
2,237,839 |
|
|
|
|
N/A |
|
|
|
|
$ |
1,620,732 |
|
|
|
|
N/A |
|
|
|
|
$ |
1,721,885 |
|
|
|
|
$ |
1,191,132 |
|
|
||
|
|
|
|
|
|
|
|
|
|
|
|
|
|
|
|
|
|
|
|
|
|
|
|
|
|
|
|
|
|
|
||||||
|
|
|
|
|
|
|
|
|
|
|
|
|
|
|
|
|
|
|
|
|
|
|
|
|
|
|
|
|
|
|
||||||
2022 |
|
|
N/A |
|
|
|
|
$ |
4,655,746 |
|
|
|
|
N/A |
|
|
|
|
$ |
540,703 |
|
|
|
|
$ |
1,699,411 |
|
|
|
|
$ |
364,560 |
|
|
||
|
|
|
|
|
|
|
|
|
|
|
|
|
|
|
|
|
|
|
|
|
|
|
|
|
|
|
|
|
|
|
||||||
|
|
|
|
|
|
|
|
|
|
|
|
|
|
|
|
|
|
|
|
|
|
|
|
|
|
|
|
|
|
|
||||||
2021 |
|
|
N/A |
|
|
|
|
$ |
6,848,969 |
|
|
|
|
N/A |
|
|
|
|
$ |
9,015,601 |
|
|
|
|
$ |
2,107,197 |
|
|
|
|
$ |
2,525,213 |
|
|
||
|
|
|
|
|
|
|
|
|
|
|
|
|
|
|
|
|
|
|
|
|
|
|
|
|
|
|
|
|
|
|
||||||
|
|
|
|
|
|
|
|
|
|
|
|
|
|
|
|
|
|
|
|
|
|
|
|
|
|
|
|
|
|
|
||||||
|
|
|
|
|
|
|
|
|
|
|
|
|
|
|
|
|
|
|
|
|
||||
|
|
|
Value of Initial Fixed $100 |
|
|
|
|
|
|
|
|
|
|
|
|
|||||||||
|
|
|
|
|
|
|
|
|
|
|
|
|
|
|
|
|
|
|
|
|
||||
|
|
|
|
|
|
|
|
|
|
|
|
|
|
|
|
|
|
|
|
|
||||
Year |
|
Total |
|
Peer Group |
|
Net Income |
|
Adjusted EBITDA |
||||||||||||||||
|
|
|
|
|
|
|
|
|
|
|
|
|
|
|
|
|
|
|
|
|
||||
|
|
|
|
|
|
|
|
|
|
|
|
|
|
|
|
|
|
|
|
|
||||
2025 |
|
|
$ |
87.16 |
|
|
|
|
$ |
77.88 |
|
|
|
|
$ |
165,388 |
|
|
|
|
$ |
275,590 |
|
|
|
|
|
|
|
|
|
|
|
|
|
|
|
|
|
|
|
|
|
|
|
||||
2024 |
|
|
$ |
53.46 |
|
|
|
|
$ |
78.31 |
|
|
|
|
$ |
(99,069 |
) |
|
|
|
$ |
224,022 |
|
|
|
|
|
|
|
|
|
|
|
|
|
|
|
|
|
|
|
|
|
|
|
||||
|
|
|
|
|
|
|
|
|
|
|
|
|
|
|
|
|
|
|
|
|
||||
2023 |
|
|
$ |
37.90 |
|
|
|
|
$ |
75.74 |
|
|
|
|
$ |
(60,408 |
) |
|
|
|
$ |
200,418 |
|
|
|
|
|
|
|
|
|
|
|
|
|
|
|
|
|
|
|
|
|
|
|
||||
|
|
|
|
|
|
|
|
|
|
|
|
|
|
|
|
|
|
|
|
|
||||
2022 |
|
|
$ |
60.55 |
|
|
|
|
$ |
77.81 |
|
|
|
|
$ |
66,331 |
|
|
|
|
$ |
241,033 |
|
|
|
|
|
|
|
|
|
|
|
|
|
|
|
|
|
|
|
|
|
|
|
||||
|
|
|
|
|
|
|
|
|
|
|
|
|
|
|
|
|
|
|
|
|
||||
2021 |
|
|
$ |
110.88 |
|
|
|
|
$ |
105.76 |
|
|
|
|
$ |
130,937 |
|
|
|
|
$ |
265,476 |
|
|
|
|
|
|
|
|
|
|
|
|
|
|
|
|
|
|
|
|
|
|
|
||||
|
|
|
|
|
|
|
|
|
|
|
|
|
|
|
|
|
|
|
|
|
||||
Adjustments to Calculate Compensation “Actually Paid” to First PEO(7) |
|
2025 |
2024 |
2023 |
||||||||||||
|
|
|
|
|
|
|
|
|
|
|
|
|
|
|||
|
|
|
|
|
|
|
|
|
|
|
|
|
|
|||
SCT Total |
|
|
$ |
2,775,881 |
|
|
|
$ |
3,301,012 |
|
|
|
$ |
2,237,839 |
|
|
|
|
|
|
|
|
|
|
|
|
|
|
|
|
|||
|
|
|
|
|
|
|
|
|
|
|
|
|
|
|||
Minus: Grant Date Fair Value of Awards Granted During the Year(8) |
|
|
$ |
(730,720 |
) |
|
|
$ |
(1,180,087 |
) |
|
|
$ |
(1,025,015 |
) |
|
|
|
|
|
|
|
|
|
|
|
|
|
|
|
|||
|
|
|
|
|
|
|
|
|
|
|
|
|
|
|||
Plus (Minus): CAP Adjustments Calculated Using SEC Methodology(9) |
|
|
$ |
909,203 |
|
|
|
$ |
2,303,113 |
|
|
|
$ |
407,908 |
|
|
|
|
|
|
|
|
|
|
|
|
|
|
|
|
|||
|
|
|
|
|
|
|
|
|
|
|
|
|
|
|||
CAP Total |
|
|
$ |
2,954,364 |
|
|
|
$ |
4,424,038 |
|
|
|
$ |
1,620,732 |
|
|
|
|
|
|
|
|
|
|
|
|
|
|
|
|
|||
|
|
|
|
|
|
|
|
|
|
|
|
|
|
|||
Adjustments to Calculate Compensation “Actually Paid” to Second PEO(7) |
|
2025 |
|
2022 |
|
2021 |
||||||||||||
|
|
|
|
|
|
|
|
|
|
|
|
|
|
|
|
|||
SCT Total |
|
|
$ |
14,140,217 |
|
|
|
|
$ |
4,655,746 |
|
|
|
|
$ |
6,848,969 |
|
|
|
|
|
|
|
|
|
|
|
|
|
|
|
|
|
|
|||
|
|
|
|
|
|
|
|
|
|
|
|
|
|
|
|
|||
Minus: Grant Date Fair Value of Awards Granted During the Year(8) |
|
|
$ |
(8,456,024 |
) |
|
|
|
$ |
(3,500,013 |
) |
|
|
|
$ |
(3,500,021 |
) |
|
|
|
|
|
|
|
|
|
|
|
|
|
|
|
|
|
|||
|
|
|
|
|
|
|
|
|
|
|
|
|
|
|
|
|||
Plus (Minus): CAP Adjustments Calculated Using SEC Methodology(9) |
|
|
$ |
19,208,155 |
|
|
|
|
$ |
(615,030 |
) |
|
|
|
$ |
5,666,653 |
|
|
|
|
|
|
|
|
|
|
|
|
|
|
|
|
|
|
|||
|
|
|
|
|
|
|
|
|
|
|
|
|
|
|
|
|||
CAP Total |
|
|
$ |
24,892,348 |
|
|
|
|
$ |
540,703 |
|
|
|
|
$ |
9,015,601 |
|
|
|
|
|
|
|
|
|
|
|
|
|
|
|
|
|
|
|||
Adjustments to Calculate Compensation “Actually Paid” to |
|
2025 |
|
2024 |
|
2023 |
|
2022 |
|
2021 |
||||||||||||||||||||
Non-PEO NEOs(6) |
|
|
|
|
|
|
|
|
|
|
|
|
|
|
|
|
|
|
|
|
|
|
|
|
|
|||||
|
|
|
|
|
|
|
|
|
|
|
|
|
|
|
|
|
|
|
|
|
|
|
|
|
|
|||||
SCT Total |
|
|
$ |
3,402,819 |
|
|
|
|
$ |
2,078,530 |
|
|
|
|
$ |
1,721,885 |
|
|
|
|
$ |
1,699,411 |
|
|
|
|
$ |
2,107,197 |
|
|
|
|
|
|
|
|
|
|
|
|
|
|
|
|
|
|
|
|
|
|
|
|
|
|
|
|
|||||
|
|
|
|
|
|
|
|
|
|
|
|
|
|
|
|
|
|
|
|
|
|
|
|
|
|
|||||
Minus: Grant Date Fair Value of Awards Granted During the Year(7) |
|
|
$ |
(1,853,151 |
) |
|
|
|
$ |
(715,395 |
) |
|
|
|
$ |
(931,681 |
) |
|
|
|
$ |
(1,081,261 |
) |
|
|
|
$ |
(990,016 |
) |
|
|
|
|
|
|
|
|
|
|
|
|
|
|
|
|
|
|
|
|
|
|
|
|
|
|
|
|||||
|
|
|
|
|
|
|
|
|
|
|
|
|
|
|
|
|
|
|
|
|
|
|
|
|
|
|||||
Plus (Minus): CAP Adjustments Calculated Using SEC Methodology(8) |
|
|
$ |
4,485,177 |
|
|
|
|
$ |
1,248,266 |
|
|
|
|
$ |
400,928 |
|
|
|
|
$ |
(253,590 |
) |
|
|
|
$ |
1,408,032 |
|
|
|
|
|
|
|
|
|
|
|
|
|
|
|
|
|
|
|
|
|
|
|
|
|
|
|
|
|||||
|
|
|
|
|
|
|
|
|
|
|
|
|
|
|
|
|
|
|
|
|
|
|
|
|
|
|||||
CAP Total |
|
|
$ |
6,034,845 |
|
|
|
|
$ |
2,611,401 |
|
|
|
|
$ |
1,191,132 |
|
|
|
|
$ |
364,560 |
|
|
|
|
$ |
2,525,213 |
|
|
|
|
|
|
|
|
|
|
|
|
|
|
|
|
|
|
|
|
|
|
|
|
|
|
|
|
|||||
(6)As shown in these tables, the Compensation “Actually Paid” totals represent the SCT totals for the applicable year, but adjusted as required by SEC rules to include the fair value of current and prior year equity awards that are outstanding, vested or forfeited during the applicable year, instead of the grant date value of awards granted during the applicable year.
The specific calculations with respect to the CAP fair value of equity for the relevant years are shown in the tables below:
First PEO – CAP Equity Adjustments |
|
2025 |
2024 |
2023 |
||||||||||||
|
|
|
|
|
|
|
|
|
|
|
|
|
|
|||
YE Value of Current Year Awards Outstanding as of YE |
|
|
$ |
1,104,601 |
|
|
|
$ |
2,057,295 |
|
|
|
$ |
616,999 |
|
|
|
|
|
|
|
|
|
|
|
|
|
|
|
|
|||
|
|
|
|
|
|
|
|
|
|
|
|
|
|
|||
Change in Value as of YE for Prior Year Awards Outstanding as of YE |
|
|
$ |
— |
|
|
|
$ |
240,247 |
|
|
|
$ |
(187,294 |
) |
|
|
|
|
|
|
|
|
|
|
|
|
|
|
|
|||
|
|
|
|
|
|
|
|
|
|
|
|
|
|
|||
Change in Value as of Vesting Date for Prior Year Awards |
|
|
$ |
(195,398 |
) |
|
|
$ |
5,571 |
|
|
|
$ |
(21,797 |
) |
|
|
|
|
|
|
|
|
|
|
|
|
|
|
|
|||
|
|
|
|
|
|
|
|
|
|
|
|
|
|
|||
Value as of Vesting Date for Current Year Awards That Vested During the Year |
|
|
$ |
— |
|
|
|
$ |
— |
|
|
|
$ |
— |
|
|
|
|
|
|
|
|
|
|
|
|
|
|
|
|
|||
|
|
|
|
|
|
|
|
|
|
|
|
|
|
|||
Value as of Vesting Date for Dividend Equivalents Paid During the Year Not Otherwise Included in Total Compensation |
|
|
$ |
— |
|
|
|
$ |
— |
|
|
|
$ |
— |
|
|
|
|
|
|
|
|
|
|
|
|
|
|
|
|
|||
|
|
|
|
|
|
|
|
|
|
|
|
|
|
|||
Value as of Prior YE for Prior Year Awards Forfeited During the Year |
|
|
$ |
— |
|
|
|
$ |
— |
|
|
|
$ |
— |
|
|
|
|
|
|
|
|
|
|
|
|
|
|
|
|
|||
|
|
|
|
|
|
|
|
|
|
|
|
|
|
|||
Value of Equity for CAP Purposes |
|
|
$ |
909,203 |
|
|
|
$ |
2,303,113 |
|
|
|
$ |
407,908 |
|
|
|
|
|
|
|
|
|
|
|
|
|
|
|
|
|||
Second PEO – CAP Equity Adjustments |
|
2025 |
|
2022 |
|
2021 |
||||||||||||
|
|
|
|
|
|
|
|
|
|
|
|
|
|
|
|
|||
YE Value of Current Year Awards Outstanding as of YE |
|
|
$ |
19,232,391 |
|
|
|
|
$ |
— |
|
|
|
|
$ |
4,664,583 |
|
|
|
|
|
|
|
|
|
|
|
|
|
|
|
|
|
|
|||
|
|
|
|
|
|
|
|
|
|
|
|
|
|
|
|
|||
Change in Value as of YE for Prior Year Awards Outstanding as of YE |
|
|
$ |
— |
|
|
|
|
$ |
— |
|
|
|
|
$ |
— |
|
|
|
|
|
|
|
|
|
|
|
|
|
|
|
|
|
|
|||
|
|
|
|
|
|
|
|
|
|
|
|
|
|
|
|
|||
Change in Value as of Vesting Date for Prior Year Awards That Vested During the Year |
|
|
$ |
(24,236 |
) |
|
|
|
$ |
(1,748,149 |
) |
|
|
|
$ |
1,002,070 |
|
|
|
|
|
|
|
|
|
|
|
|
|
|
|
|
|
|
|||
|
|
|
|
|
|
|
|
|
|
|
|
|
|
|
|
|||
Value as of Vesting Date for Current Year Awards That Vested During the Year |
|
|
$ |
— |
|
|
|
|
$ |
1,133,119 |
|
|
|
|
$ |
— |
|
|
|
|
|
|
|
|
|
|
|
|
|
|
|
|
|
|
|||
|
|
|
|
|
|
|
|
|
|
|
|
|
|
|
|
|||
Value as of Vesting Date for Dividend Equivalents Paid During the Year Not Otherwise Included in Total Compensation |
|
|
$ |
— |
|
|
|
|
$ |
— |
|
|
|
|
$ |
— |
|
|
|
|
|
|
|
|
|
|
|
|
|
|
|
|
|
|
|||
|
|
|
|
|
|
|
|
|
|
|
|
|
|
|
|
|||
Value as of Prior YE for Prior Year Awards Forfeited During the Year |
|
|
$ |
— |
|
|
|
|
$ |
— |
|
|
|
|
$ |
— |
|
|
|
|
|
|
|
|
|
|
|
|
|
|
|
|
|
|
|||
|
|
|
|
|
|
|
|
|
|
|
|
|
|
|
|
|||
Value of Equity for CAP Purposes |
|
|
$ |
19,208,155 |
|
|
|
|
$ |
(615,030 |
) |
|
|
|
$ |
5,666,653 |
|
|
|
|
|
|
|
|
|
|
|
|
|
|
|
|
|
|
|||
Non-PEO NEOs – CAP Equity Adjustments |
2025 |
2024 |
2023 |
2022 |
2021 |
||||||||||||||||||||
|
|
|
|
|
|
|
|
|
|
|
|
|
|
|
|
|
|
|
|
|
|||||
YE Value of Current Year Awards Outstanding as of YE |
|
$ |
4,057,776 |
|
|
|
$ |
834,923 |
|
|
|
$ |
560,818 |
|
|
|
$ |
350,057 |
|
|
|
$ |
1,310,553 |
|
|
|
|
|
|
|
|
|
|
|
|
|
|
|
|
|
|
|
|
|
|
|
|||||
|
|
|
|
|
|
|
|
|
|
|
|
|
|
|
|
|
|
|
|
|
|||||
Change in Value as of YE for Prior Year Awards Outstanding as of YE |
|
$ |
453,943 |
|
|
|
$ |
122,479 |
|
|
|
$ |
(150,476 |
) |
|
|
$ |
(496,890 |
) |
|
|
$ |
60,423 |
|
|
|
|
|
|
|
|
|
|
|
|
|
|
|
|
|
|
|
|
|
|
|
|||||
|
|
|
|
|
|
|
|
|
|
|
|
|
|
|
|
|
|
|
|
|
|||||
Change in Value as of Vesting Date for Prior Year Awards That Vested During the Year |
|
$ |
(26,542 |
) |
|
|
$ |
2,366 |
|
|
|
$ |
(9,414 |
) |
|
|
$ |
(106,757 |
) |
|
|
$ |
37,056 |
|
|
|
|
|
|
|
|
|
|
|
|
|
|
|
|
|
|
|
|
|
|
|
|||||
|
|
|
|
|
|
|
|
|
|
|
|
|
|
|
|
|
|
|
|
|
|||||
Value as of Vesting Date for Current Year Awards That Vested During the Year |
|
$ |
— |
|
|
|
$ |
288,498 |
|
|
|
$ |
— |
|
|
|
$ |
— |
|
|
|
$ |
— |
|
|
|
|
|
|
|
|
|
|
|
|
|
|
|
|
|
|
|
|
|
|
|
|||||
|
|
|
|
|
|
|
|
|
|
|
|
|
|
|
|
|
|
|
|
|
|||||
Value as of Vesting Date for Dividend Equivalents Paid During the Year Not Otherwise Included in Total Compensation |
|
$ |
— |
|
|
|
$ |
— |
|
|
|
$ |
— |
|
|
|
$ |
— |
|
|
|
$ |
— |
|
|
|
|
|
|
|
|
|
|
|
|
|
|
|
|
|
|
|
|
|
|
|
|||||
|
|
|
|
|
|
|
|
|
|
|
|
|
|
|
|
|
|
|
|
|
|||||
Value as of Prior YE for Prior Year Awards Forfeited During the Year |
|
$ |
— |
|
|
|
$ |
— |
|
|
|
$ |
— |
|
|
|
$ |
— |
|
|
|
$ |
— |
|
|
|
|
|
|
|
|
|
|
|
|
|
|
|
|
|
|
|
|
|
|
|
|||||
|
|
|
|
|
|
|
|
|
|
|
|
|
|
|
|
|
|
|
|
|
|||||
Value of Equity for CAP Purposes |
|
$ |
4,485,177 |
|
|
|
$ |
1,248,266 |
|
|
|
$ |
400,928 |
|
|
|
$ |
(253,590 |
) |
|
|
$ |
1,408,032 |
|
|
|
|
|
|
|
|
|
|
|
|
|
|
|
|
|
|
|
|
|
|
|
|||||
Adjustments to Calculate Compensation “Actually Paid” to First PEO(7) |
|
2025 |
2024 |
2023 |
||||||||||||
|
|
|
|
|
|
|
|
|
|
|
|
|
|
|||
|
|
|
|
|
|
|
|
|
|
|
|
|
|
|||
SCT Total |
|
|
$ |
2,775,881 |
|
|
|
$ |
3,301,012 |
|
|
|
$ |
2,237,839 |
|
|
|
|
|
|
|
|
|
|
|
|
|
|
|
|
|||
|
|
|
|
|
|
|
|
|
|
|
|
|
|
|||
Minus: Grant Date Fair Value of Awards Granted During the Year(8) |
|
|
$ |
(730,720 |
) |
|
|
$ |
(1,180,087 |
) |
|
|
$ |
(1,025,015 |
) |
|
|
|
|
|
|
|
|
|
|
|
|
|
|
|
|||
|
|
|
|
|
|
|
|
|
|
|
|
|
|
|||
Plus (Minus): CAP Adjustments Calculated Using SEC Methodology(9) |
|
|
$ |
909,203 |
|
|
|
$ |
2,303,113 |
|
|
|
$ |
407,908 |
|
|
|
|
|
|
|
|
|
|
|
|
|
|
|
|
|||
|
|
|
|
|
|
|
|
|
|
|
|
|
|
|||
CAP Total |
|
|
$ |
2,954,364 |
|
|
|
$ |
4,424,038 |
|
|
|
$ |
1,620,732 |
|
|
|
|
|
|
|
|
|
|
|
|
|
|
|
|
|||
|
|
|
|
|
|
|
|
|
|
|
|
|
|
|||
Adjustments to Calculate Compensation “Actually Paid” to Second PEO(7) |
|
2025 |
|
2022 |
|
2021 |
||||||||||||
|
|
|
|
|
|
|
|
|
|
|
|
|
|
|
|
|||
SCT Total |
|
|
$ |
14,140,217 |
|
|
|
|
$ |
4,655,746 |
|
|
|
|
$ |
6,848,969 |
|
|
|
|
|
|
|
|
|
|
|
|
|
|
|
|
|
|
|||
|
|
|
|
|
|
|
|
|
|
|
|
|
|
|
|
|||
Minus: Grant Date Fair Value of Awards Granted During the Year(8) |
|
|
$ |
(8,456,024 |
) |
|
|
|
$ |
(3,500,013 |
) |
|
|
|
$ |
(3,500,021 |
) |
|
|
|
|
|
|
|
|
|
|
|
|
|
|
|
|
|
|||
|
|
|
|
|
|
|
|
|
|
|
|
|
|
|
|
|||
Plus (Minus): CAP Adjustments Calculated Using SEC Methodology(9) |
|
|
$ |
19,208,155 |
|
|
|
|
$ |
(615,030 |
) |
|
|
|
$ |
5,666,653 |
|
|
|
|
|
|
|
|
|
|
|
|
|
|
|
|
|
|
|||
|
|
|
|
|
|
|
|
|
|
|
|
|
|
|
|
|||
CAP Total |
|
|
$ |
24,892,348 |
|
|
|
|
$ |
540,703 |
|
|
|
|
$ |
9,015,601 |
|
|
|
|
|
|
|
|
|
|
|
|
|
|
|
|
|
|
|||
Adjustments to Calculate Compensation “Actually Paid” to |
|
2025 |
|
2024 |
|
2023 |
|
2022 |
|
2021 |
||||||||||||||||||||
Non-PEO NEOs(6) |
|
|
|
|
|
|
|
|
|
|
|
|
|
|
|
|
|
|
|
|
|
|
|
|
|
|||||
|
|
|
|
|
|
|
|
|
|
|
|
|
|
|
|
|
|
|
|
|
|
|
|
|
|
|||||
SCT Total |
|
|
$ |
3,402,819 |
|
|
|
|
$ |
2,078,530 |
|
|
|
|
$ |
1,721,885 |
|
|
|
|
$ |
1,699,411 |
|
|
|
|
$ |
2,107,197 |
|
|
|
|
|
|
|
|
|
|
|
|
|
|
|
|
|
|
|
|
|
|
|
|
|
|
|
|
|||||
|
|
|
|
|
|
|
|
|
|
|
|
|
|
|
|
|
|
|
|
|
|
|
|
|
|
|||||
Minus: Grant Date Fair Value of Awards Granted During the Year(7) |
|
|
$ |
(1,853,151 |
) |
|
|
|
$ |
(715,395 |
) |
|
|
|
$ |
(931,681 |
) |
|
|
|
$ |
(1,081,261 |
) |
|
|
|
$ |
(990,016 |
) |
|
|
|
|
|
|
|
|
|
|
|
|
|
|
|
|
|
|
|
|
|
|
|
|
|
|
|
|||||
|
|
|
|
|
|
|
|
|
|
|
|
|
|
|
|
|
|
|
|
|
|
|
|
|
|
|||||
Plus (Minus): CAP Adjustments Calculated Using SEC Methodology(8) |
|
|
$ |
4,485,177 |
|
|
|
|
$ |
1,248,266 |
|
|
|
|
$ |
400,928 |
|
|
|
|
$ |
(253,590 |
) |
|
|
|
$ |
1,408,032 |
|
|
|
|
|
|
|
|
|
|
|
|
|
|
|
|
|
|
|
|
|
|
|
|
|
|
|
|
|||||
|
|
|
|
|
|
|
|
|
|
|
|
|
|
|
|
|
|
|
|
|
|
|
|
|
|
|||||
CAP Total |
|
|
$ |
6,034,845 |
|
|
|
|
$ |
2,611,401 |
|
|
|
|
$ |
1,191,132 |
|
|
|
|
$ |
364,560 |
|
|
|
|
$ |
2,525,213 |
|
|
|
|
|
|
|
|
|
|
|
|
|
|
|
|
|
|
|
|
|
|
|
|
|
|
|
|
|||||
The specific calculations with respect to the CAP fair value of equity for the relevant years are shown in the tables below:
First PEO – CAP Equity Adjustments |
|
2025 |
2024 |
2023 |
||||||||||||
|
|
|
|
|
|
|
|
|
|
|
|
|
|
|||
YE Value of Current Year Awards Outstanding as of YE |
|
|
$ |
1,104,601 |
|
|
|
$ |
2,057,295 |
|
|
|
$ |
616,999 |
|
|
|
|
|
|
|
|
|
|
|
|
|
|
|
|
|||
|
|
|
|
|
|
|
|
|
|
|
|
|
|
|||
Change in Value as of YE for Prior Year Awards Outstanding as of YE |
|
|
$ |
— |
|
|
|
$ |
240,247 |
|
|
|
$ |
(187,294 |
) |
|
|
|
|
|
|
|
|
|
|
|
|
|
|
|
|||
|
|
|
|
|
|
|
|
|
|
|
|
|
|
|||
Change in Value as of Vesting Date for Prior Year Awards |
|
|
$ |
(195,398 |
) |
|
|
$ |
5,571 |
|
|
|
$ |
(21,797 |
) |
|
|
|
|
|
|
|
|
|
|
|
|
|
|
|
|||
|
|
|
|
|
|
|
|
|
|
|
|
|
|
|||
Value as of Vesting Date for Current Year Awards That Vested During the Year |
|
|
$ |
— |
|
|
|
$ |
— |
|
|
|
$ |
— |
|
|
|
|
|
|
|
|
|
|
|
|
|
|
|
|
|||
|
|
|
|
|
|
|
|
|
|
|
|
|
|
|||
Value as of Vesting Date for Dividend Equivalents Paid During the Year Not Otherwise Included in Total Compensation |
|
|
$ |
— |
|
|
|
$ |
— |
|
|
|
$ |
— |
|
|
|
|
|
|
|
|
|
|
|
|
|
|
|
|
|||
|
|
|
|
|
|
|
|
|
|
|
|
|
|
|||
Value as of Prior YE for Prior Year Awards Forfeited During the Year |
|
|
$ |
— |
|
|
|
$ |
— |
|
|
|
$ |
— |
|
|
|
|
|
|
|
|
|
|
|
|
|
|
|
|
|||
|
|
|
|
|
|
|
|
|
|
|
|
|
|
|||
Value of Equity for CAP Purposes |
|
|
$ |
909,203 |
|
|
|
$ |
2,303,113 |
|
|
|
$ |
407,908 |
|
|
|
|
|
|
|
|
|
|
|
|
|
|
|
|
|||
Second PEO – CAP Equity Adjustments |
|
2025 |
|
2022 |
|
2021 |
||||||||||||
|
|
|
|
|
|
|
|
|
|
|
|
|
|
|
|
|||
YE Value of Current Year Awards Outstanding as of YE |
|
|
$ |
19,232,391 |
|
|
|
|
$ |
— |
|
|
|
|
$ |
4,664,583 |
|
|
|
|
|
|
|
|
|
|
|
|
|
|
|
|
|
|
|||
|
|
|
|
|
|
|
|
|
|
|
|
|
|
|
|
|||
Change in Value as of YE for Prior Year Awards Outstanding as of YE |
|
|
$ |
— |
|
|
|
|
$ |
— |
|
|
|
|
$ |
— |
|
|
|
|
|
|
|
|
|
|
|
|
|
|
|
|
|
|
|||
|
|
|
|
|
|
|
|
|
|
|
|
|
|
|
|
|||
Change in Value as of Vesting Date for Prior Year Awards That Vested During the Year |
|
|
$ |
(24,236 |
) |
|
|
|
$ |
(1,748,149 |
) |
|
|
|
$ |
1,002,070 |
|
|
|
|
|
|
|
|
|
|
|
|
|
|
|
|
|
|
|||
|
|
|
|
|
|
|
|
|
|
|
|
|
|
|
|
|||
Value as of Vesting Date for Current Year Awards That Vested During the Year |
|
|
$ |
— |
|
|
|
|
$ |
1,133,119 |
|
|
|
|
$ |
— |
|
|
|
|
|
|
|
|
|
|
|
|
|
|
|
|
|
|
|||
|
|
|
|
|
|
|
|
|
|
|
|
|
|
|
|
|||
Value as of Vesting Date for Dividend Equivalents Paid During the Year Not Otherwise Included in Total Compensation |
|
|
$ |
— |
|
|
|
|
$ |
— |
|
|
|
|
$ |
— |
|
|
|
|
|
|
|
|
|
|
|
|
|
|
|
|
|
|
|||
|
|
|
|
|
|
|
|
|
|
|
|
|
|
|
|
|||
Value as of Prior YE for Prior Year Awards Forfeited During the Year |
|
|
$ |
— |
|
|
|
|
$ |
— |
|
|
|
|
$ |
— |
|
|
|
|
|
|
|
|
|
|
|
|
|
|
|
|
|
|
|||
|
|
|
|
|
|
|
|
|
|
|
|
|
|
|
|
|||
Value of Equity for CAP Purposes |
|
|
$ |
19,208,155 |
|
|
|
|
$ |
(615,030 |
) |
|
|
|
$ |
5,666,653 |
|
|
|
|
|
|
|
|
|
|
|
|
|
|
|
|
|
|
|||
Non-PEO NEOs – CAP Equity Adjustments |
2025 |
2024 |
2023 |
2022 |
2021 |
||||||||||||||||||||
|
|
|
|
|
|
|
|
|
|
|
|
|
|
|
|
|
|
|
|
|
|||||
YE Value of Current Year Awards Outstanding as of YE |
|
$ |
4,057,776 |
|
|
|
$ |
834,923 |
|
|
|
$ |
560,818 |
|
|
|
$ |
350,057 |
|
|
|
$ |
1,310,553 |
|
|
|
|
|
|
|
|
|
|
|
|
|
|
|
|
|
|
|
|
|
|
|
|||||
|
|
|
|
|
|
|
|
|
|
|
|
|
|
|
|
|
|
|
|
|
|||||
Change in Value as of YE for Prior Year Awards Outstanding as of YE |
|
$ |
453,943 |
|
|
|
$ |
122,479 |
|
|
|
$ |
(150,476 |
) |
|
|
$ |
(496,890 |
) |
|
|
$ |
60,423 |
|
|
|
|
|
|
|
|
|
|
|
|
|
|
|
|
|
|
|
|
|
|
|
|||||
|
|
|
|
|
|
|
|
|
|
|
|
|
|
|
|
|
|
|
|
|
|||||
Change in Value as of Vesting Date for Prior Year Awards That Vested During the Year |
|
$ |
(26,542 |
) |
|
|
$ |
2,366 |
|
|
|
$ |
(9,414 |
) |
|
|
$ |
(106,757 |
) |
|
|
$ |
37,056 |
|
|
|
|
|
|
|
|
|
|
|
|
|
|
|
|
|
|
|
|
|
|
|
|||||
|
|
|
|
|
|
|
|
|
|
|
|
|
|
|
|
|
|
|
|
|
|||||
Value as of Vesting Date for Current Year Awards That Vested During the Year |
|
$ |
— |
|
|
|
$ |
288,498 |
|
|
|
$ |
— |
|
|
|
$ |
— |
|
|
|
$ |
— |
|
|
|
|
|
|
|
|
|
|
|
|
|
|
|
|
|
|
|
|
|
|
|
|||||
|
|
|
|
|
|
|
|
|
|
|
|
|
|
|
|
|
|
|
|
|
|||||
Value as of Vesting Date for Dividend Equivalents Paid During the Year Not Otherwise Included in Total Compensation |
|
$ |
— |
|
|
|
$ |
— |
|
|
|
$ |
— |
|
|
|
$ |
— |
|
|
|
$ |
— |
|
|
|
|
|
|
|
|
|
|
|
|
|
|
|
|
|
|
|
|
|
|
|
|||||
|
|
|
|
|
|
|
|
|
|
|
|
|
|
|
|
|
|
|
|
|
|||||
Value as of Prior YE for Prior Year Awards Forfeited During the Year |
|
$ |
— |
|
|
|
$ |
— |
|
|
|
$ |
— |
|
|
|
$ |
— |
|
|
|
$ |
— |
|
|
|
|
|
|
|
|
|
|
|
|
|
|
|
|
|
|
|
|
|
|
|
|||||
|
|
|
|
|
|
|
|
|
|
|
|
|
|
|
|
|
|
|
|
|
|||||
Value of Equity for CAP Purposes |
|
$ |
4,485,177 |
|
|
|
$ |
1,248,266 |
|
|
|
$ |
400,928 |
|
|
|
$ |
(253,590 |
) |
|
|
$ |
1,408,032 |
|
|
|
|
|
|
|
|
|
|
|
|
|
|
|
|
|
|
|
|
|
|
|
|||||
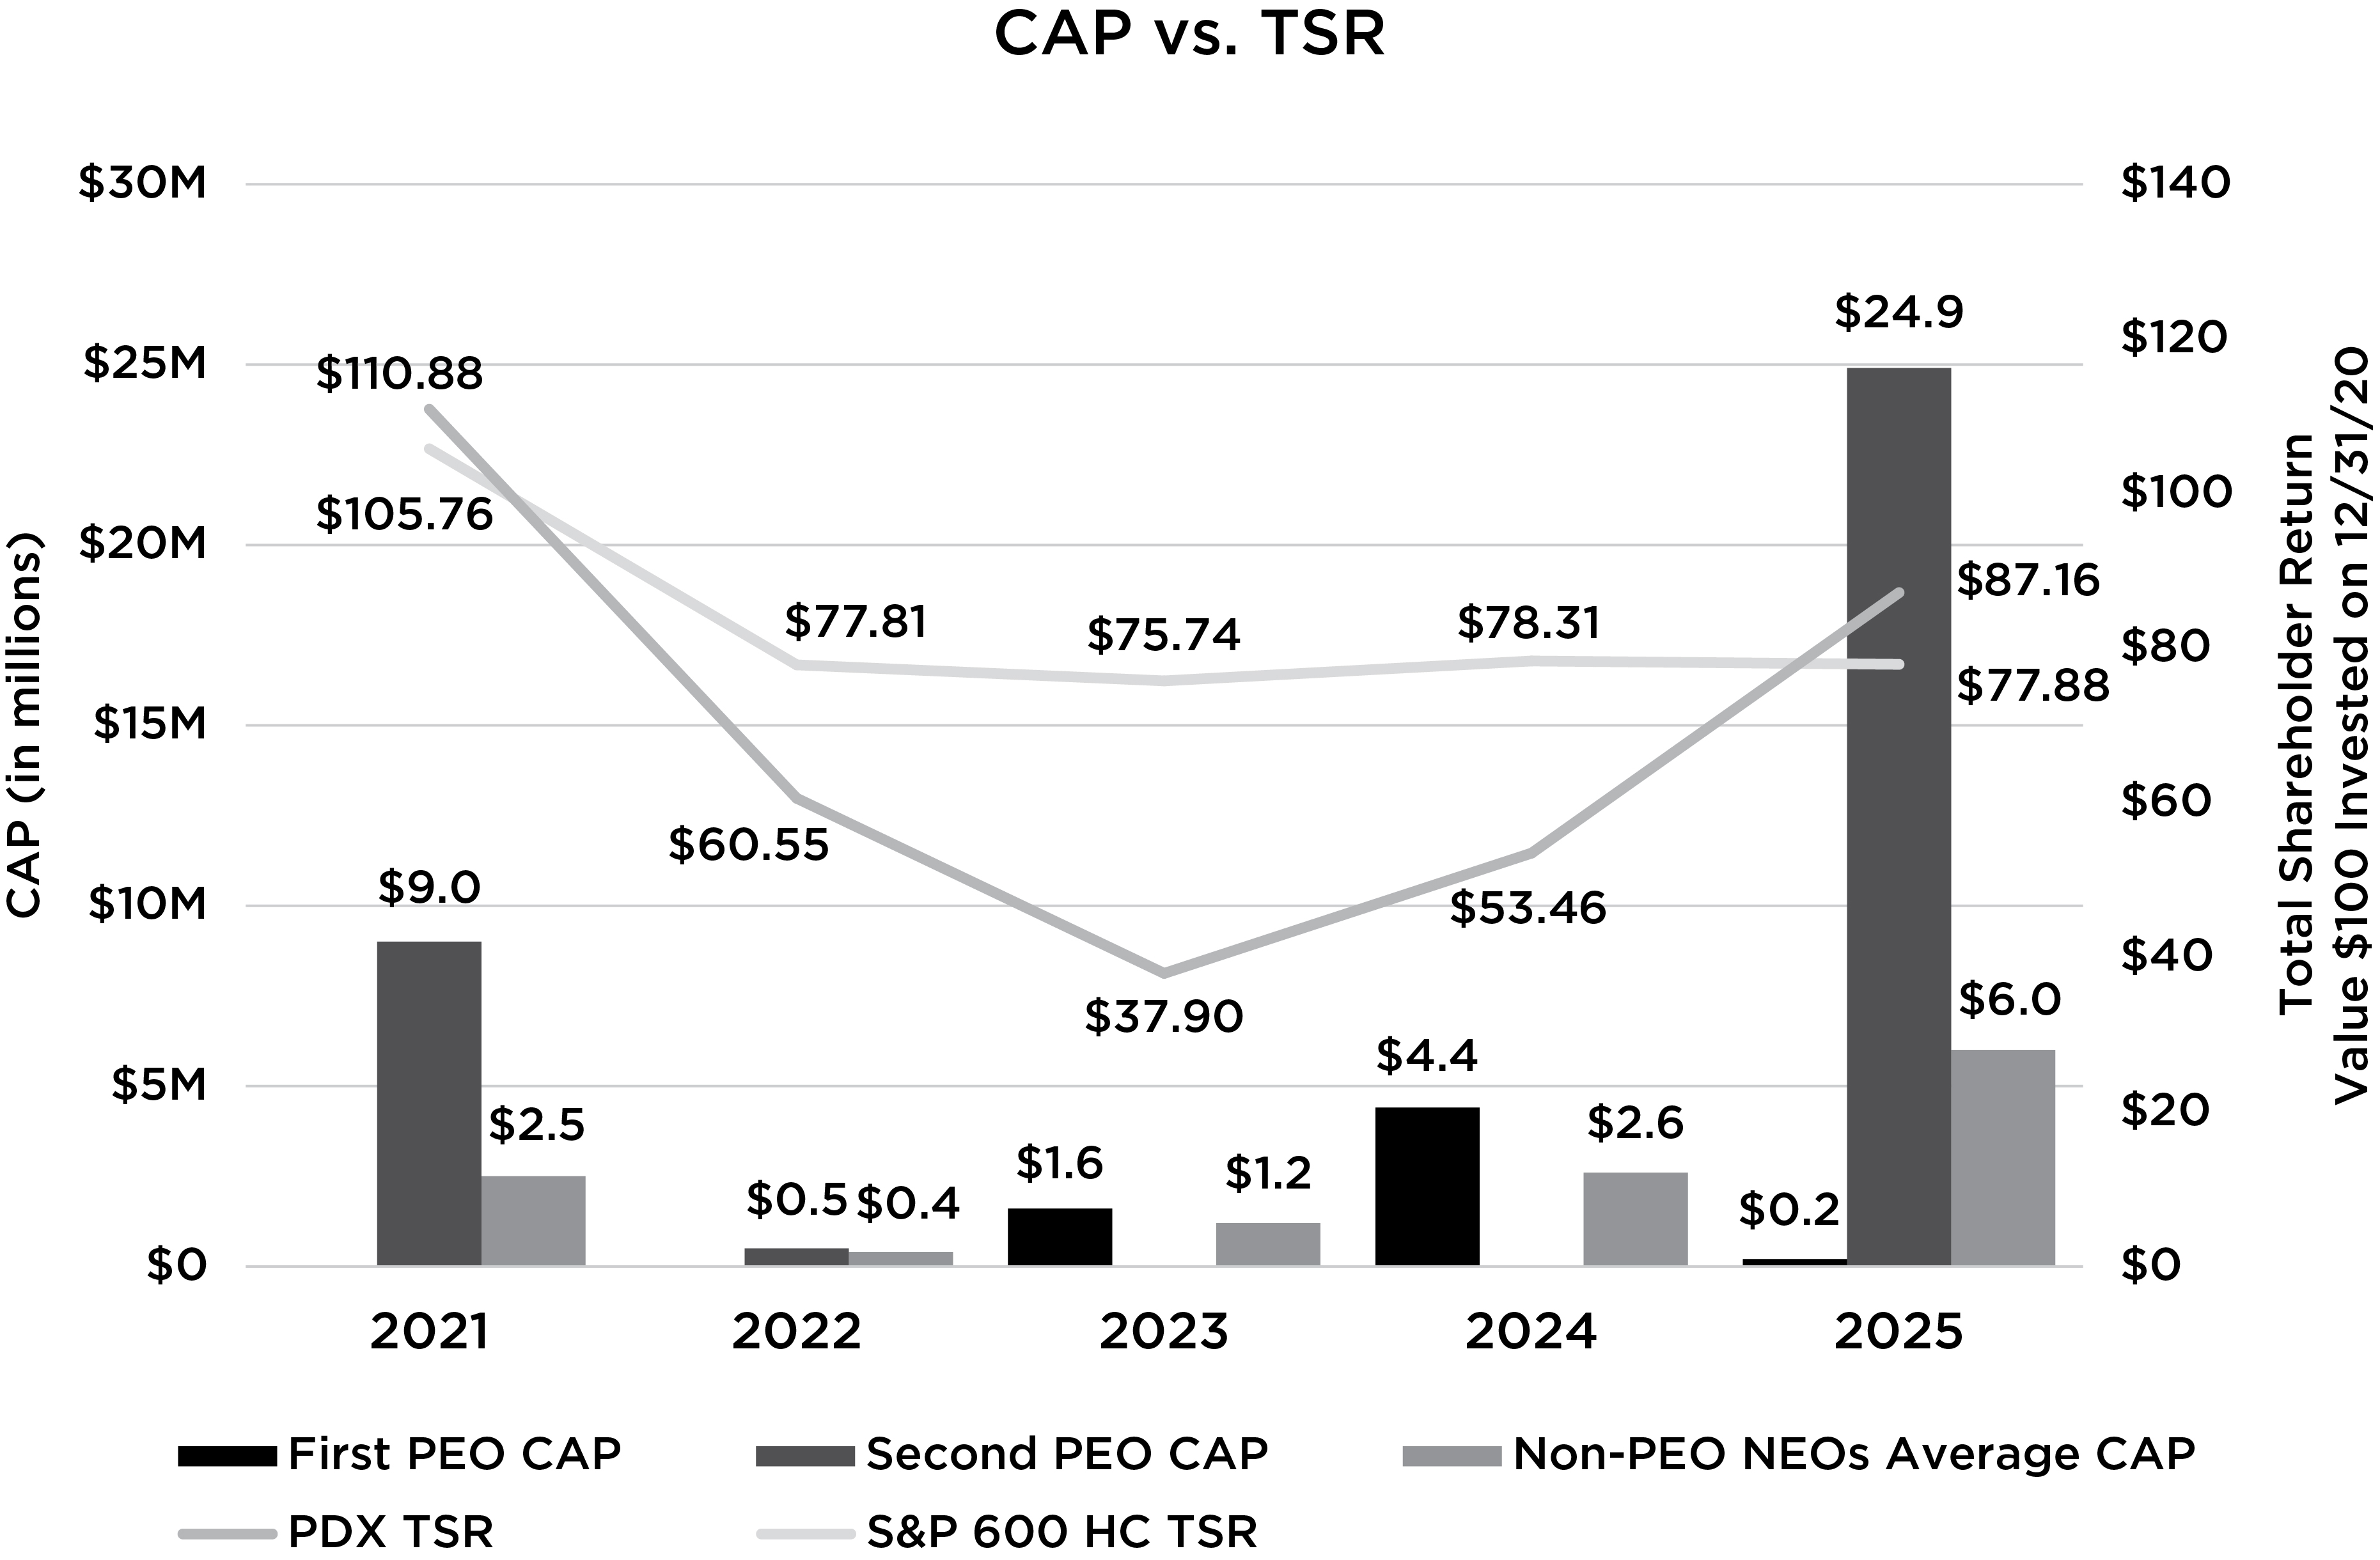
The following chart shows the relationship of the compensation actually paid to our PEOs and the average compensation actually paid to our other non-PEO NEOs to the total shareholder return for the Company (“PDX”) and for the S&P 600 Healthcare Index (“S&P 600 HC”).
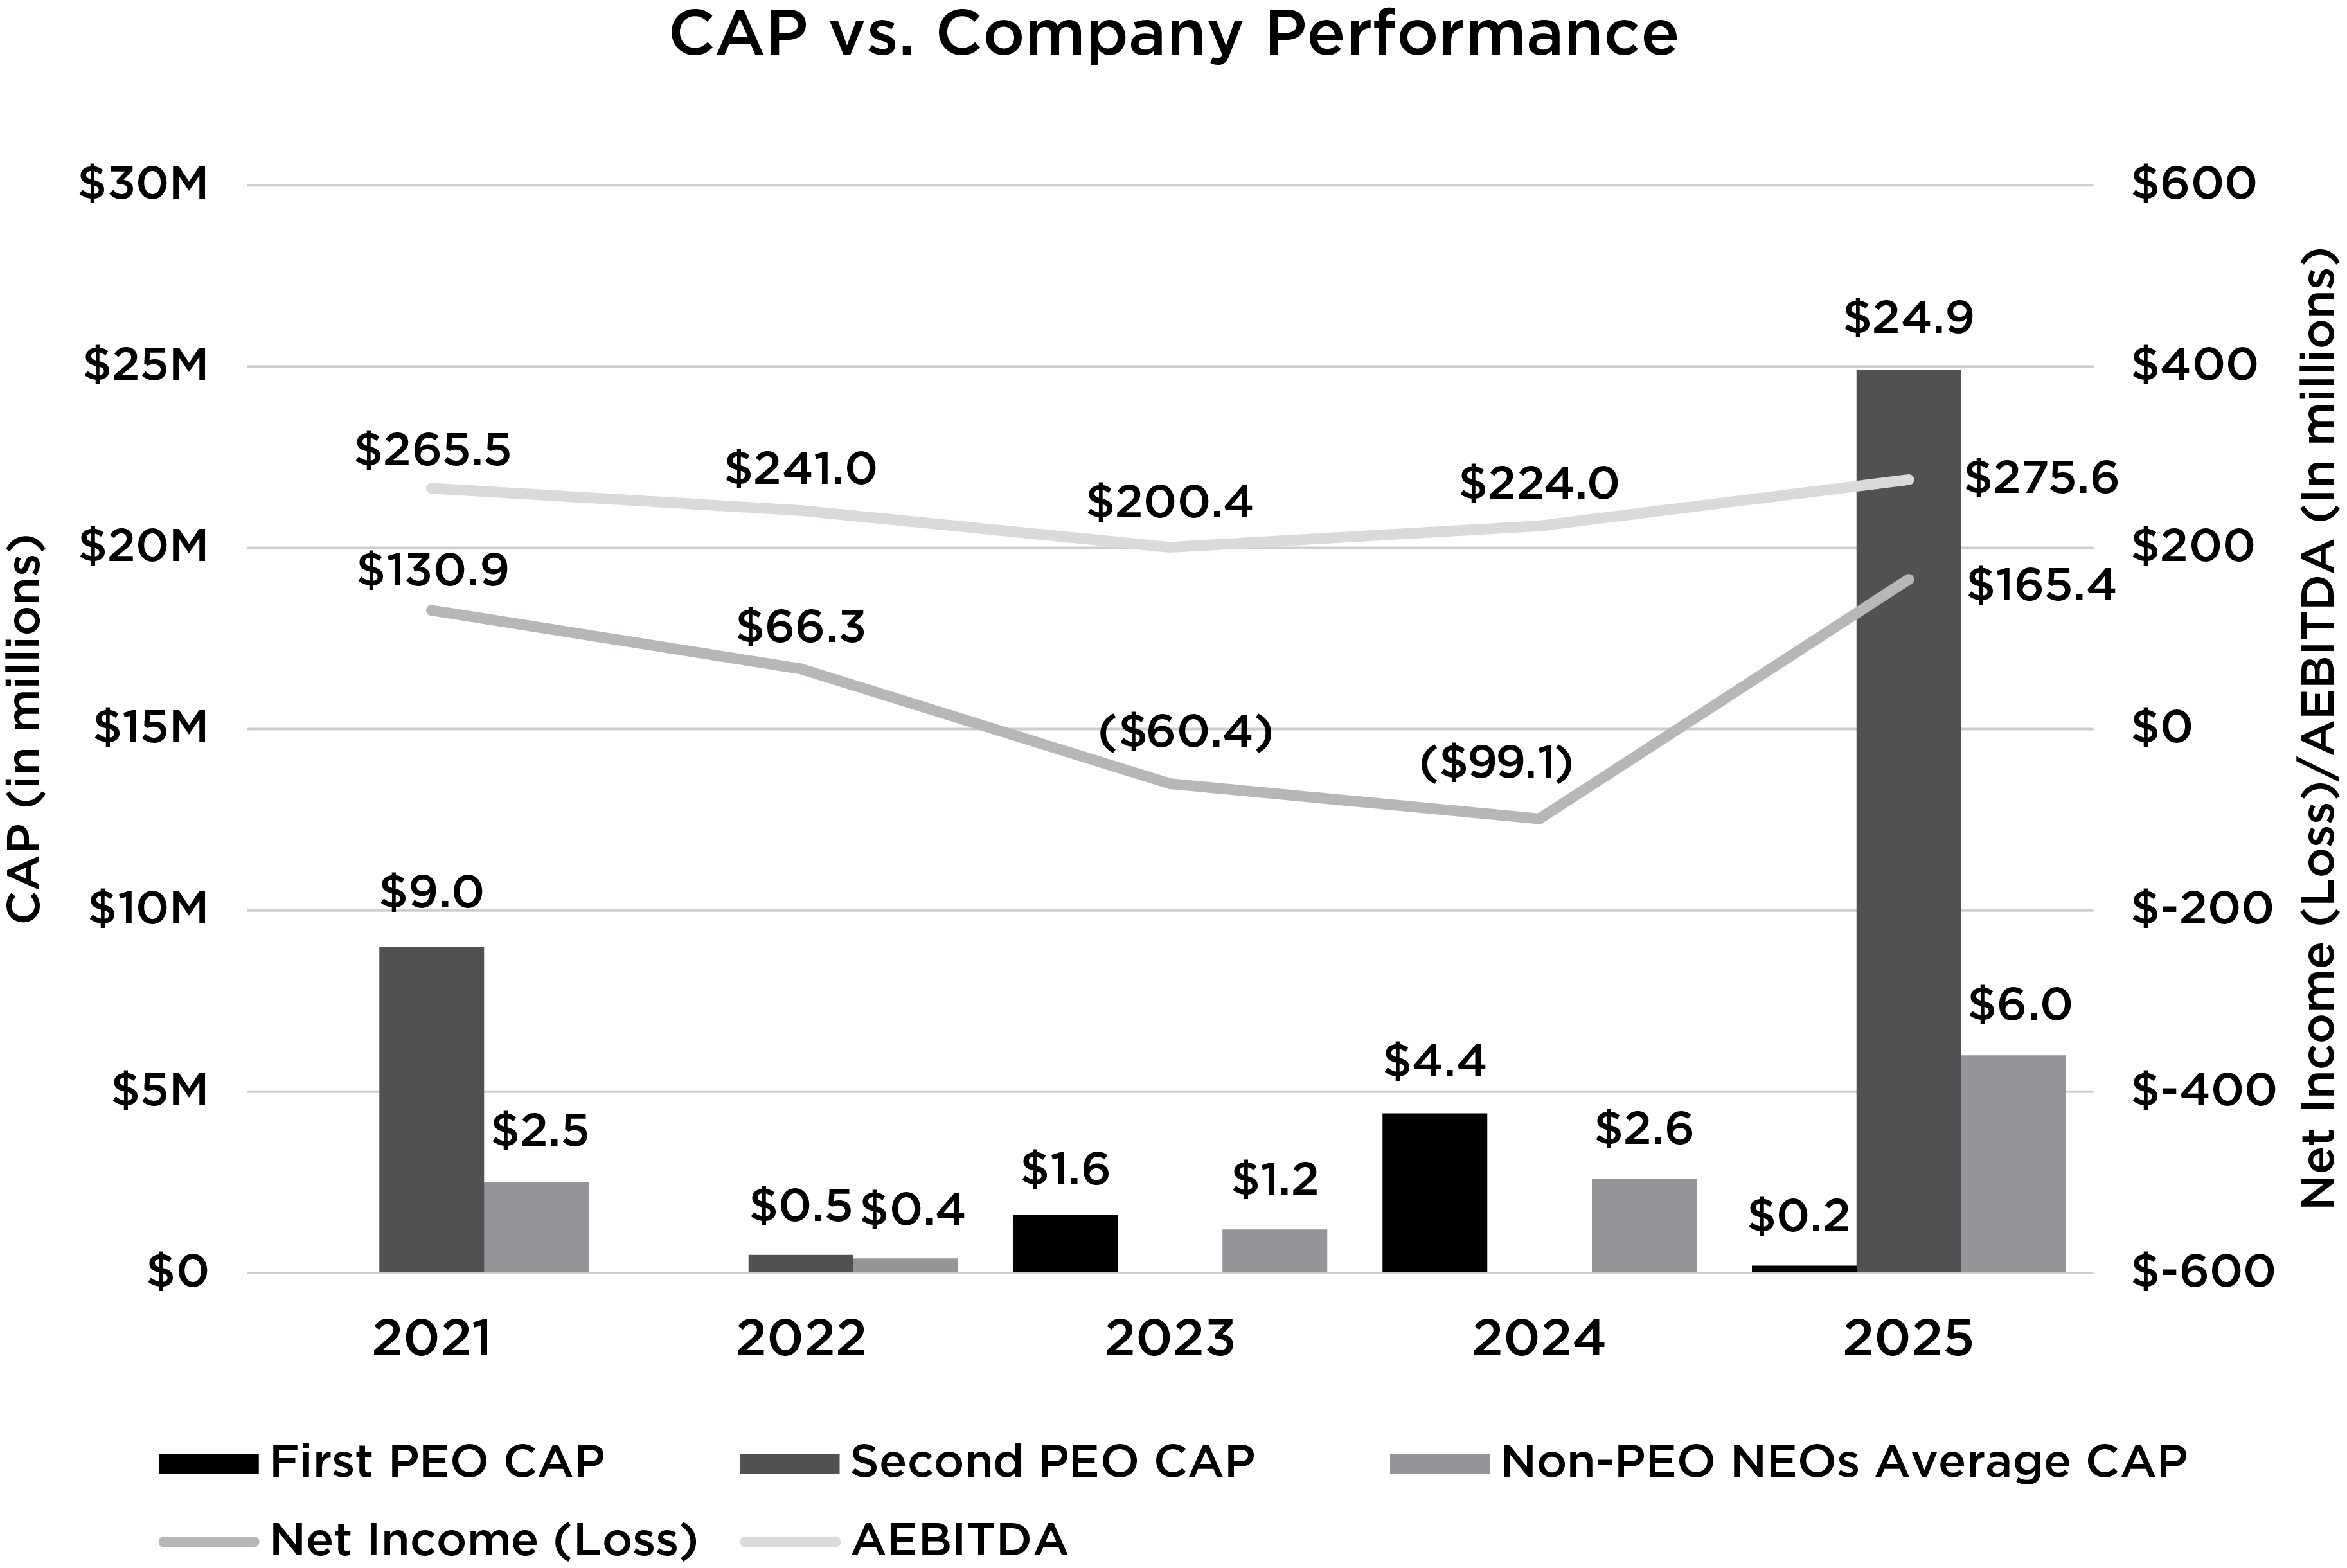
The following chart shows the relationship of the compensation actually paid to our PEOs and the average compensation actually paid to our other non-PEO NEOs as compared to our net (loss) income and our Adjusted EBITDA (“AEBITDA”).
Tabular List of Most Important Financial Performance Measures
We consider the below financial performance measures to be the most important measures used by us to link NEO compensation to Company performance. For further information regarding these performance metrics and their function in our executive compensation program, please see “Compensation Discussion and Analysis.”
Most Important Financial Measures |
|
• Adjusted EBITDA |
• Adjusted Income From Operations |
• Stock Price |
|